Abstract
Objective:
Describe resource utilization and costs for total hip replacement (THR) and total knee replacement (TKR) for the 90 days before hospitalization for surgery, the hospital event, and the 90 and 360 days after hospitalization for surgery with emphasis on 90 days after hospitalization.
Methods:
A large insurance database was used to identify outpatient and summarized hospital resource use and payments (insurer perspective) for THR and TKR. A second large US database provided hospital details (charge description master level) of inpatient services, costs, and charges (hospital perspective) for a different sample of THR and TKR patients. Included patients were ≥45 years old, had no hospitalization record within 1 year before surgery, and THR length of stay (LOS) of 2–8 days or TKR LOS 2–6 days.
Results:
There were 22 618 THR and 50 686 TKR patients in the insurance database and 81 635 THR and 158 990 TKR in the hospital database. Average age was ∼66 years for THR and TKR patients. Median LOS was 4 days (both surgeries). Hospital costs (hospital perspective) were $17 588 in US dollars (USD) and $16 267 (USD) for THR and TKR, respectively. Reimbursement for hospital services (insurer perspective) were $22 967 (USD) and $21 583 (USD) for THR and TKR, respectively. In 90 days post-surgery, THR and TKR total payments were $3827 (USD) and $4237 (USD), respectively. Payments for the first 90 days post-surgery were 57.5% of the 360-day post-period for THR-related payments and 59.9% for TKR-related payments.
Conclusion:
Payers considering use of episode-of-care payment models for THR and TKR may wish to concentrate efforts on the 90 days post-discharge.
Limitations:
While this study used large samples of subjects, generalisability of the results may be limited since the samples were not randomized samples of THR and TKR patients. It is noteworthy that patients in the hospital sample are not the same as those in the insurer sample. Selection of hip-related and knee-related procedures and associated costs was based on qualitative review. Payers may use different billing codes or aggregate costs differently.
Introduction
Hip and knee joint replacements are two of the most frequently performed surgical procedures in the USCitation1 and are commonly accepted as safe and effective while improving functional status and health-related quality-of-lifeCitation2–4. Total hip replacement (THR) and total knee replacement (TKR) have been documented to relieve pain and restore function in 90% of patients with low complication rates and with mortality rates of less than 1%Citation5. Further, hip and knee prostheses can be expected to last more than 10 years in 90% of patientsCitation6, and have been shown to be cost-effective in multiple studiesCitation5,Citation7. In fact, delaying TKR and THR such that patients have worse functional status and greater pain at the time of surgery has been shown to result in inferior short- and long-term outcomesCitation8–11.
Given the safety and effectiveness of total joint replacement and changing demographics in the US, it is not surprising that the frequency of these procedures has been growing rapidly. In 2009, discharges for THR and TKR were 284 708 and 620 192, respectively (excluding revision surgeries)Citation12. From 2000 to 2009, TKR procedures nearly doubled (97%) and THR procedures increased 73%Citation13. The Organization for Economic Co-operation and Development (OECD) shows more variation in 2009 (or closest year) rates per 100–000 for hip and knee replacement surgeriesCitation14. The published rate for Hip surgeries was 184/100 000 for the US vs OECD countries at 154/100 000. Hip replacement surgeries ranged from 296/100 000 (Germany) to 8/100 000 (Mexico). For Knee surgeries the rates were 213/100 000 for the US vs 118/100 000 for the OECD countries, with Germany and the US at the top (213/100 000) and Mexico with the lowest rate (3/100 000). In the US, growth rates of these surgeries are expected to continue as baby boomers approach the 65+ age group and Americans in general experience declining health and mobility due to obesityCitation15. THR and TKR surgeries are expected to reach 572 000 and 3 480 000, respectively, by 2030, with revision surgeries doubling for TKR by 2015 and THR by 2026Citation16.
In 2004, an estimated $22.9 billion (USD) was charged in the US for TKR and THR surgeriesCitation17. The cost burden to Medicare exceeded $13 billion (USD) for original hip replacement surgeries and ∼$2 billion (USD) for hip revision surgeriesCitation6. In 2007, patients aged 65 and over accounted for more than 50% of all hip (54.3%) and knee (58.2%) replacement surgeriesCitation6. The number of THR/TKR original and revisions surgeries has been projected to cost $80 billion (USD) by 2015Citation6. A search of the peer-reviewed literature found no articles describing costs associated with specific episodes of THR/TKR surgery in the US.
Understanding the cost associated with THR and TKR episodes of care is important in light of recent health reform developments. The Centers for Medicare and Medicaid Services has begun a number of initiatives to curb spending through the Affordable Care ActCitation18. In 2009, the Acute Care Episode demonstration was initiated to test the potential of episode-based payments for specific cardiovascular and orthopedic procedures, including THR and TKRCitation19. An episode-based payment is a global payment that covers an episode of inpatient care, essentially bundling Medicare Part A and Part B services, as well as physician services pertaining to the inpatient stay. Only five US hospitals participated in the demonstration project, and published data regarding these results are limited. However, based on the results, opportunities and barriers associated with the programs have been discussedCitation20. Among the opportunities cited are the potential to reduce unneeded services and to improve quality of patient care. Barriers identified include a lack of standard methods for constructing episodes, the complexity of implementation, and the need for close collaboration between hospitals and physicians. In addition, validation and development of improved metrics for measuring quality will be needed. Ultimately, the relationship between cost and quality (cost-effectiveness) will be a key metric.
Most recently, the US Centers for Medicare & Medicaid Services (CMS) announced a new initiative, The National Pilot Program on Payment Bundling, aimed at giving doctors and hospitals new incentives ‘to co-ordinate care, improve the quality of care and save money for Medicare’Citation21. This voluntary initiative will bundle care for a package of services used to treat specific medical conditions, such as THR and TKR. Hospitals, physician groups, homecare providers, and other healthcare providers would submit a bid (bundled payment) to cover all of the medical services in a pre-defined episode of care.
The objective for bundled payments is to create cost savings compared to a total combined fee for service payments. While CMS expects the bundling initiative to lower the overall cost of care, better patient care is also expected as a result of increased co-ordination across multiple healthcare providers. Bundled care would encourage development of new approaches to organize care and allocate payments among the participating providers such that they could attain efficient, high quality careCitation22.
The current prevalence of THR and TKR and their expected growth rate in the coming decades necessitates a clear understanding of the inpatient and outpatient cost structure associated with these procedures. The purpose of this exploratory analysis was to describe resource utilization and costs for THR and TKR for the 90 days before the hospitalization for surgery, for the hospital event, and for the 90 and 360 days after the hospitalization for surgery with emphasis on 90 days after hospitalization.
This study is unique in that specific costs and resource utilization associated with both the surgical procedure itself and outpatient utilization before and after the procedure are detailed. This research may help inform THR/TKR health policy and, specifically, the structure of bundled payment initiatives.
Patients and methods
The analysis employed an observational design. Independent analyses were conducted for THR and TKR. A goal of the descriptive analysis was to develop inclusion and exclusion criteria to identify a large sample of patients that represent a typical THR and TKR experience (i.e., designed to exclude outlier cases) where cost, charge, and payment data had a high likelihood of being predominately hip or knee related.
Data sources
Data for this analysis were obtained from two sources. The Thomson Reuters MarketScan Commercial and Medicare Research DatabaseCitation23 provided detailed outpatient claims data and summary inpatient data for a large group of insured active employees and their dependents, early retirees, former employees enrolled in Consolidated Omnibus Budget Reconciliation Act (COBRA) designated insurance plans, and Medicare-eligible retirees with employer-provided Medicare Supplemental Insurance. This database covers ∼100 plans and contains in excess of 500 million records. It was the source of THR/TKR summary inpatient and detailed ambulatory reimbursement information for this study. Thomson Reuters financial data are payments from the insurer perspective.
The second data source employed was the Premier Perspective Hospital DatabaseCitation24, which provided detailed encounter and financial information on inpatient hospitalizations for THR and TKR. The Premier data included admission and discharge characteristics, hospital characteristics, billing information, patient demographics, physician characteristics, hospital charges, and costs from more than 600 hospitals, but did not include data on non-hospital services. Premier financial data are costs and charges from the hospital perspective.
Data from these two datasets do not use the same patient samples; however, the use of both datasets allows insight into detailed inpatient and outpatient experiences of a large volume of THR and TKR patients. This retrospective analysis used these administrative encounters and claims data to provide a detailed picture of healthcare utilization and expenditures associated with THR and TKR. Both databases are de-identified, HIPAA (Health Insurance Portability and Accountability Act of 1996) compliant databases, and as such, no institutional review board approval was necessary.
Inclusion/exclusion criteria
To be included in the analysis, patients were required to have a primary International Classification of Diseases, Ninth Revision, Clinical Modification (ICD-9) Volume 3 procedure code for either THR (ICD-9 procedure code = 81.51) or TKR (ICD-9 procedure code = 81.54) between January 1, 2006, and December 31, 2008; be continuously eligible for services for 360 days before and after the index date (Thomson Reuters data only); and be at least 45 years of age at the time of the THR or TKR surgery (index date). This criterion focused the analysis on typical joint replacement procedures since joint replacement patients younger than 45 years of age are infrequent.
Patients were excluded if they had any record of a hospitalization for the year prior to the index event or any THR or TKR hospitalization in the post-index year. Patients were also required to have only a single hospital record on the index date, have prescription coverage (Thomson Reuters data only), and payment amounts greater than zero in cost fields. Hospital length of stay was required to range from 2–8 days for THR and 2–6 days for TKR. This length of stay criterion removed patients with a 1-day stay since it was unlikely to have represented a replacement surgery. Exclusion of patients with longer stays was also expected to eliminate those who were likely hospitalized for other reasons (e.g., trauma or serious complication). Again, the goal was to identify ‘typical’ THR and TKR patients.
Financial variables and resource utilization
Thomson Reuters data provided summary payment, diagnosis, and procedure information for inpatient hospitalization and detailed payment and resource use information for outpatient services. The term ‘payment’ is used because the data are from an insurer’s perspective and reflect the amount that the insurer would pay a provider or facility. Premier provides detailed inpatient resource use data and reports four financial variables that reflect internal charges and costs: hospital charges (the amount that would appear on a patient bill), cost (the total cost of the hospitalization from the hospital perspective), variable costs (the cost of the specific billable items used during the hospitalization), and fixed costs (allocated overhead). Note that Premier does not report the amount they received from an insurer, but does provide details on all procedures and tests received by patients while in the hospital. It is noteworthy that the insurer database contains payment amounts for all types of services (e.g., payments to physicians, pharmacies, and hospitals) while the hospital database contains internal cost and charge information for only hospitalizations.
Premier financial data were used in conjunction with the Thomson Reuters payment data to demonstrate how costs and charges from the hospital perspective differ from payments to hospitals from an insurer perspective. However, in comparing hospital charge/cost and payment data, it is important to remember that these data describe two different patient populations created using the same selection criteria.
For Premier, the assumption was that all inpatient care incurred for the index event was replacement related. For the Thomson Reuters data, procedures and payments were categorized as replacement-related and non-replacement-related. Hip-related claims were those with any hip-related ICD-9-CM diagnosis code in the primary diagnosis field or a hip-specific ICD-9 procedure code in any procedure field. All other claims were considered non-hip-related. Knee-related claims were those with any knee-related ICD-9-CM diagnosis code in the primary diagnosis field or a knee-specific ICD-9 procedure code in any procedure field. All other claims were considered non-knee-related.
Analysis
All analyses were descriptive, and THR and TKR analyses were performed independently. No statistical testing was conducted between THR and TKR since differences between these populations are not of interest for the purposes of this analysis. The objective of the analysis was to document the magnitude of expenditures within joint replacement surgeries. No conclusions are made regarding differences between the two populations. To this end, the results are presented side-by-side; however, no implication is suggested regarding differences between the groups. It is also noted that, due to the large sample sizes, even trivial differences would lead to significant tests. The primary interest is whether the magnitude of differences within each type of surgery is meaningful.
Examination of specific procedures was conducted and categories for presentation were selected based on qualitative review. All financial data were adjusted to December 2009 using the Medical Services Component of the Consumer Price IndexCitation25. Frequencies and percentages of categorical variables and means, standard deviations, minimums, maximums, and medians of continuous variables are reported. Aggregate data are reported as well as results for frequently encountered procedures. All data are reported separately for THR and TKR in December 2009 US dollars. All analyses were conducted using SAS version 9.2 for WindowsCitation26.
Results
Baseline characteristics
Application of the study criteria identified 22 618 THR and 50 686 TKR patients in the Thomson Reuters MarketScan database. Attrition tables for the hip and knee samples are presented in Appendices A and B. Descriptive data on the baseline patient characteristics represented in the Thomson Reuters cohort are presented in . The THR patients averaged 65.9 (SD = 10.8) years of age, 54.2% female, and 49.9% had Medicare insurance. TKR patients were 66.5 (SD = 9.7) years of age, 61.9% female, and 52.9% had Medicare coverage.
Table 1. Patient characteristics for the Thomson Reuters sample.
There were 81 635 hip replacement and 158 990 knee replacement hospital discharges in the Premier inpatient hospital dataset. Patient characteristics for these discharges are detailed in . Average age and percentage female were consistent with what was observed in the Thomson Reuters cohorts. The first five categories of health plan types in were rank ordered identically to those in the outpatient cohort (see ) and account for approximately the same percentage of patients (93.0% THR and 93.6% for TKR).
Table 2. Patient characteristics for the Premier hospital inpatient sample.
Payments (insurer perspective) and resource use in the 90 days prior to the procedure
Average healthcare payments in the 90 days before THR were $2403 (USD), of which $546 (USD; 22.7%) were hip related. Findings for TKR patients in the 90-day pre-period were similar (average of $2424 (USD); $590 (USD; 24.3%) knee related). The majority of pre-period costs were for outpatient billings (>70%).
The most notable result from the pre-period costs was identified by a qualitative review of outpatient billing codes, which suggested that pre-surgical evaluation was one of the most salient reasons for pre-period visits in both THR and TKR patients. More than 70% of THR and TKR patients had a cardiovascular medical claim in the 90 days before surgery. A high percentage of these claims were for cardiovascular testing (e.g. electrocardiogram, echocardiography, and stress testing), presumably in preparation for surgery. This assumption was supported by a steep drop in the rate of cardiovascular claims in the 90 days post-surgery.
THR and TKR procedure charge/costs (hospital perspective) and resource use
Length of stay and discharge status from the Premier database are shown in . Average length of stay for THR and TKR patients was 4.4 and 4.3 days, respectively. Median length of stay was 4 days across both cohorts. Even though the databases are independent, hospitalizations in the Thomson data showed and average LOS of 4.2 and 4.1 for THR and TKR, respectively. The median LOS was also 4 days (data not shown). Discharge to home was the most prevalent for both THR (62.4%) and TKR (64.1%) patients. Of those discharged to home, 40.7% of THR patients and 42.2% of TKR patients received home healthcare.
Table 3. Length of stay and discharge status based on Premier data.
Overall THR and TKR hospital cost and charges are detailed in . Charges represent the US dollar amount that would typically appear on a patient’s bill (i.e., includes some markup over costs). Costs represent the total cost of providing the service from the hospital perspective. Total costs are further divided into either direct or indirect costs. Direct costs are costs associated with procedures, medical equipment, and services utilized during the hospitalization. Indirect costs represent overheads (e.g., general maintenance, administration). Payments, which are not included in the Premier hospital database, are expected to be somewhere between costs and charges. Actual amounts paid by an insurer to a provider may be negotiated at rates that are quite different from the means presented here. TKR charges tended to be slightly lower than THR for each of the charge categories. Total direct departmental costs for the three most common service categories are summarized in .
Table 4. Inpatient cost and charges (USD) per patient based on Premier data.
Mean payments to hospitals for THR and TKR procedures from the Thomson Reuters database are reported in . Hospitals were paid on average a total of $22 967 (USD) and $21 583 (USD) for THR and TKR, respectively. When Medicare and non-Medicare payments are presented separately, a substantial difference is apparent. For THR, Medicare pays on average $18 925 (USD) while non-Medicare payments average $26 988 (USD). A similar disparity occurs for TKR where Medicare payments average $18 131 (USD) and the non-Medicare average is $25 443 (USD).
Table 5. Payments (insurer perspective in USD) for hospital services based on Thomson Reuters data.
Payments and resource use in the 90 days pre-surgery and 360 days post-surgery
provides an overview of payment categories that changed substantially in terms of the proportion of patients utilizing services or mean payment per patient in the 90-day post-period compared to the 90-day pre-period. Overall, payment drivers for THR and TKR in the 90-day post-period included physical therapy, home care, durable medical equipment, and nursing facility services. However, it is important to note that the Current Procedural Terminology/Healthcare Common Procedure Coding System (CPT/HCPCS) coding rules do not group all codes of a similar type together. Therefore, these payments are likely a conservative estimate of total payments within these areas.
Table 6. Percentage of patients with at least one claim and mean payment per patient (USD) for selected CPT procedures 90 days before and after hospitalization.
For users the physical medicine and rehabilitation category was the most costly in the 90 days before and after hospitalization. A much greater percentage of patients utilized services in the 90 day post-period with substantially greater average payments. Durable medical equipment had a modest average payment decrease from the 90-day pre-period to the 90-day post-period for THR patients, but TKR patients showed a modest increase in average payment. There was a substantial increase in the percentage of THR and TKR patients using durable medical equipment in the 90-day post-period compared to the 90-day pre-period. The percentage of patients with a CPT-coded claim for nursing services in the post-period was 13–15-times higher compared to pre-period percentages and the average per patient payment also increased. CPT coding for nursing services was consistent with reported discharge status.
Temporary Procedure and Temporary National Procedure codes showed both an increase in the percentage of patients receiving services and the mean payment per patient. These payments were driven by physical rehabilitation services. Most frequently occurring codes included physical/occupational therapy, physician certification for home health services, home nursing care, and electrical stimulation.
Payments in 30-day increments before and after the index event for total, joint-related, and non-joint-related payments are depicted in . Non-hip/knee payments represent healthcare payments that were not associated with a primary diagnosis code for hip or knee care during the 360-day post-period. Trends for each type of surgery follow similar patterns over time, with the vast majority of payments occurring by 90 days after hospital discharge (vertical dashed line). Average hip- and knee-related payment after 90 days is consistently less than $500 (USD) per month per patient.
Figure 1. Average amount paid by insurer (USD) per patient in 30-day increments over the 360-day post-surgery period for hip and knee replacement. Hip n = 22,617; Knee n = 50,686. Cost data are adjusted to December 2009 using the Medical Services component of the Consumer Price IndexCitation12.
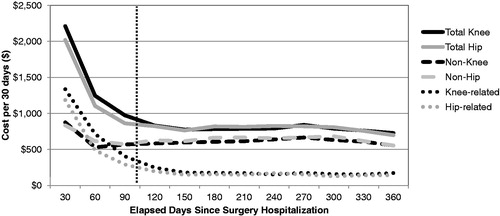
Average total payments (insurer perspective) per patient in the 90 days prior to the procedure and in 90 days immediately after the procedure were $2403 (USD) and $3827 (USD), respectively, for THR, and $2424 (USD) and $4237 (USD) before and after surgery, respectively, for TKR. Hip-related payments in the 90-day pre-period were $546 (22.7% of total payments) and $1932 (USD; 50.5% of total payments) in the post-period. Similar data for TKR was $590 (USD; 24.4% of total payments) and $2427 (USD; 57.3% of total payments) for the pre- and post-periods, respectively. Hip-related payments for the first 90 days of the 360-day post-period were 57.5% of total hip-related payments and 59.9% for knee-related payments.
Discussion
Findings from this study may be useful for development of episode-based payment models and bundled payment initiatives for joint replacement procedures. Costs associated with THR and TKR can generally be divided into three time periods: (1) prior to surgery, (2) hospitalization for surgery, and (3) post-hospitalization. Prior to surgery, the primary cost prior appeared to be testing related to preparation for joint replacement surgery (e.g., cardiovascular testing).
For hospitalization costs related to surgery, the Premier database provided hospitaliaation results for 81 635 THR patients and 158 990 TKR patients. The total cost for the hospital stay averaged $17 588 (USD) for THR patients and $16 267 (USD) for TKR patients. There were substantial differences in the average payment to hospitals for Medicare vs non-Medicare payers. The average payment to hospitals for a THR patient was $18 925 (USD) for Medicare and $26 988 (USD) for non-Medicare payers. Comparable figures for TKR patients averaged $18 131 (USD) for Medicare and $25 443 (USD) for non-Medicare. Average non-Medicare payments were ∼41% greater than Medicare payments overall (42.6% for THR patients and 40.3% for TKR patients). Median length of stay was 4 days for both THR and TKR patients, and the majority of patients were discharged home (62.4% for THR and 64.1% for TKR). The largest component costs (hospital perspective) for both THR and TKR were for supplies, operating room costs, and room and board (see ).
In the 90 days after hospital discharge there were far fewer cardiovascular procedures, but as would be expected there were considerable rehabilitation-related procedures which included physical therapy, durable medical equipment, electrical stimulation, and skilled nursing home visits. Physical medicine and rehabilitation procedures had the highest average cost per patient in the 90-day post-period. Co-ordination across a range of outpatient providers could be required (e.g., physical therapy, home health, durable medical equipment vendors).
Hip-related payments in the 90-day pre-period were 22.7% of total payments and 50.5% of total payments in the 90-day post-period. Similar data for TKR was 24.4% of total payments in the 90-day pre-period and 57.3% of total payments in the 90-day post-period. Hip-related costs for the first 90 days of the 360-day post-period were 57.5% of total payments and 59.9% for knee-related payments. Clearly, the first 90 days after THR and TKR contain a significant portion of payments for THR and TKR patients.
Limitations
The limitations of this study are those associated with the use of retrospective data. This analysis did not include statistical comparisons. Lack of randomization may affect the generalisability of the results. While the sample from both data sources is quite large, we cannot infer national representation of the findings since these are not probability samples of THR and TKR patients. Also, it is important to recognize that patients in the Premier sample are not the same as those in the Thomson Reuters sample. The definitions of original THR and TKR are definitive, but selection of hip-related and knee-related procedures and associated costs for presentation was based on qualitative review. There was no source for a standardized definition of procedures and costs related to these surgeries. Other payers may use different billing codes or aggregate costs differently. While these procedures and costs are not completely definitive, they are presented with time-period limits that should help with interpretation.
Conclusions
Payments in the 90-day period before hospitalization were largely associated with preparation for THR and TKR. Payments in the 90 days after hospital discharge were mostly driven by rehabilitation with home health services, nursing home care, physical therapy, and durable medical equipment being key drivers. Payers considering the use of episode-of-care payment models for THR and TKR may wish to concentrate their efforts on the 90 days after hospital discharge, since much of the outpatient payment is concentrated in this period.
Transparency
Declaration of funding
This study was supported by DePuy Orthopaedics, Inc., 700 Orthopaedic Drive, Warsaw, IN 46581. The views expressed in this paper are those of the authors, and no official endorsement by DePuy Orthopaedics, Inc.is intended or should be inferred.
Declaration of financial/other relationships
Eric T. Edgell, PharmD, MS, is an employee of DePuy Synthes Products, LLC, the company that supported this study. All other authors received research support from DePuy Synthes Products, LLC. JME Peer Reviewers on this manuscript have no relevant financial relationships to disclose.
Supplementary Material
Download PDF (60.8 KB)Acknowledgments
Mike Dickson, PhD, and Lavonda Miley, PhD, participated in the writing of the manuscript. Support for writing was provided by DePuy Synthes Products, LLC.
References
- Kane RL, Saleh KJ, Wilt TJ, et al. Total Knee Replacement. Evidence Report/Technology Assessment No. 86 (Prepared by the Minnesota Evidence-based Practice Center, Minneapolis, MN). AHRQ Publication No. 04-E006-2. Rockville, MD: Agency for Healthcare Research and Quality. December 2003.
- George LK, Ruiz, D, Sloan FA. The Effects of total knee arthroplasty on physical functioning in the older population. Arthritis Rheum 2008;58:3166-71
- George LK, Ruiz, D, Sloan FA. The effects of total hip arthroplasty on physical functioning in the older population. J Am Geriatr Soc 2008;56:1057-62
- Ethgen O, Bruyere O, Richy F, et al. Health-related quality of life in total hip and total knee arthroplasty. J Bone Joint Surg 2004;86-A:963-74
- Chang RW, Pellissier JM, Hazen GB. A cost-effectiveness analysis of total hip arthroplasty for osteoarthritis of the Hip. JAMA 1996;275:858-65
- Katz JN. Total joint replacement in osteoarthritis. Best Pract Res Clin Rheumatol 2006;20:145-53
- Higashi H, Barendregt JJ. Cost-effectiveness of total hip and knee replacements for the Australian population with osteoarthritis: discrete-event simulation model. PLoS ONE 2011;6:e25403
- Lavernia C, D’Apuzzo M, Rossi MD. Is postoperative function after hip or knee arthroplasty influenced by preoperative functional levels? J Arthroplasty 2009;24:1033-43
- Fortin PR, Penrod JR, Clarke AE, et al. Timing of total joint replacement affects clinical outcomes among patients with osteoarthritis of the hip or knee. Arthritis Rheum 2002;46:3327-30
- Fortin PR, Clarke AE, Joseph L, et al. Outcomes of total hip and knee replacement: preoperative functional status predicts outcomes at six months after surgery. Arthritis Rheum 1999;42:1722-8
- Rossi MD, Eberle T, Roche M, et al. Delaying knee replacement and implications on early postoperative outcomes: a pilot study. Orthopedics 2009;32:885
- HCUP Databases. Healthcare Cost and Utilization Project (HCUP). 2006-2009. Agency for Healthcare Research and Quality, Rockville, MD. www.hcup-us.ahrq.gov/databases.jsp. Accessed May 7, 2012
- National Center for Health Statistics. Health, United States, 2010: With Special Feature on Death and Dying. Hyattsville, MD. 2011. Table 103; 340--343. http://www.cdc.gov/nchs/data/hus/2010/103.pdf. Accessed May 7, 2012
- OECD (2011), Health at a Glance 2011: OECD Indicators, OECD Publishing. http://dx.doi.org/10.1787/health_glance-2011-en Accessed March 2013
- When I’m 64: how boomers will change healthcare. First Consulting Group (FCG) and the American Hospital Association, 2007. Washington, DC. http://www.aha.org/aha/content/2007/pdf/070508-boomerreport.pdf. Accessed March 2013
- Kurtz S, Ong K, Lau E, et al. Projections of primary and revision hip and knee arthroplasty in the United States from 2005 to 2030. J Bone Joint Surg Am 2007;89:780-5
- Kim S. Changes in surgical loads and economic burden of hip and knee replacements in the US: 1997–2004. Arthritis Rheum 2008;59:481-8
- Patient Protection and Affordable Care Act. HR 3590, 111th Congress, 2009. http://www.govtrack.us/congress/bills/111/hr3590. Accessed May 7, 2012
- Center for Medicare and Medicaid Innovation, Washington, DC. Acute Care Episode Demonstration. http://www.cms.gov/DemoProjectsEvalRpts/downloads/ACEFactSheet.pdf. Accessed May 7, 2012
- Mechanic RE. Opportunities and challenges for episode-based payment. N Engl J Med 2011;365:777-9
- Affordable Care Act initiative to lower costs, help doctors and hospitals coordinate care [news release]. Washington, DC. US Department of Health and Human Services, 2011. http://www.hhs.gov/news/press/2011pres/08/20110823a.html. Accessed May 7, 2012
- Hackbarth G, Reischauer R, Mutti A. Collective accountability for medical care — toward bundled Medicare payments. N Engl J Med 2008;359:3-5
- MarketScan® User Guide. Commercial claims and encounters medicare supplemental and coordination of benefits, Data Year 2007. Englewood, CO: Thompson Healthcare Inc., 2007
- Premier, 13034 Ballantyne Corporate Place, Charlotte, NC 28277
- US Department of Labor, Bureau of Labor Statistics, Washington, DC. All Urban Consumers, medical services component, Consumer Price Index. http://www.bls.gov. Accessed May 7, 2012
- SAS/STAT software. Version 9.2 of the SAS System for Windows. Copyright 2002-2010. SAS Institute Inc. SAS and all other SAS Institute Inc. product or service names are registered trademarks or trademarks of SAS Institute Inc. Cary, NC: SAS Institute Inc
Appendix
Table A1. Number of patients with inpatient hip replacement hospitalizations meeting study criteria.
Table A2. Number of patients with inpatient knee replacement hospitalizations meeting study criteria.