Abstract
Objective:
To refine a claims algorithm for identifying second-line systemic regimens for metastatic colorectal cancer (mCRC) based on clinical evidence and to compare costs during second-line treatment by targeted therapy administered.
Methods:
This retrospective analysis of a large US managed care database identified patients diagnosed with mCRC during 1 July 2007–30 June 2011. A claims-based algorithm was developed to identify patients with at least two lines of therapy (LOT) and the second LOT contained one targeted agent: bevacizumab or any anti-epidermal growth factor receptor (EGFR). Medical chart data from 92 patients were used to corroborate and refine the LOT algorithm. The positive predictive value (PPV) of the initial algorithm and refined algorithm for identification of second LOT are presented. The final algorithm was applied to claims data and two mutually exclusive second-line cohorts were examined: patients with bevacizumab- or cetuximab-containing regimens. Second-line healthcare costs were analyzed with generalized linear models adjusted for demographic and clinical characteristics.
Results:
The PPV increased from 50.0% (95% CI = 39.4–60.6) for the initial algorithm to 72.1% (95% CI = 59.2–82.9) for the final algorithm. Mean age in the cohorts (n = 569) was 61 years; 58% were men. Days of therapy were similar for the bevacizumab (n = 450) vs cetuximab (n = 119) cohorts, respectively: 131 vs 148 in first LOT and 123 (both cohorts) in second LOT (p ≥ 0.27). Total costs during second-line treatment in the bevacizumab cohort were lower by $12,318 (p = 0.02) and medical costs were lower by $13,809 (p = 0.01). Monthly total and medical costs were lower by $2728 (p = 0.03) and $3133 (p = 0.01), respectively. Results are based on commercially or Medicare-insured patients and may not be generalizable to Medicaid or uninsured patients.
Conclusions:
Corroboration of claim-based algorithms with medical chart data improved algorithm performance. Second-line total and medical costs were lower for mCRC patients treated with bevacizumab compared with cetuximab.
Introduction
Colorectal cancer is the third most commonly diagnosed cancerCitation1 and the second most costly cancer in the US with an estimated $14.1B in direct expenditures in 2010Citation2. At diagnosis, more than 50% of colorectal cancers have progressed to regional or distant metastasesCitation3. Recent advances in surgical approaches and treatment regimens have improved 5-year survival of patients with metastatic colorectal cancerCitation4. The choice of treatments has evolved considerably in the last decade with the development of agents that target the molecular pathways of tumour growth and disseminationCitation5.
BevacizumabCitation6, a monoclonal antibody, targets vascular endothelial growth factor (VEGF). CetuximabCitation7 and panitumumabCitation8 are monoclonal antibodies that target epidermal growth factor receptor (EGFR). Bevacizumab was approved for first- (2004) and second-line (2006) treatment of metastatic colorectal cancer in combination with 5-fluorouracil-based chemotherapy. Cetuximab and panitumumab gained approval in 2004–2006 as single agents after failure of oxaliplatin and irinotecan-based chemotherapy. Cetuximab is also indicated in combination with irinotecan in patients who are refractory to irinotecan-based chemotherapy or as a single agent for those intolerant to irinotecan. The label for both anti-EGFR agents was restricted to patients without KRAS mutations (KRAS wild type) in 2009. In 2012, regorafenibCitation9 (kinase inhibitor) and ziv-afliberceptCitation10 (anti-VEGF fusion protein) were approved for use in second or later line therapy and cetuximab was approved for first-line use in combination with FOLFIRI (irinotecan, 5-fluorouracil and leucovorin).
With multiple second-line therapeutic options, clinicians and patients have several options to balance efficacy and tolerability. When potential benefits and risks are comparable, treatment costs may play a role in patient management. Analysis of healthcare claims data offers an opportunity to explore contemporary treatment patterns and the associated costs in real world clinical practice. These analyses rely on claims for services to identify the relevant population and measures of interest. External corroboration of algorithms with data derived from medical charts of treating physicians can quantify the strengths and limitations of algorithms to identify specific chemotherapy and targeted agent treatment patterns for several cancersCitation11,Citation12 and the results can be used to further refine algorithms. However, the accuracy of algorithms to distinguish between first and subsequent lines of therapy in claims databases is not known.
A patient’s chemotherapy regimen during a line of therapy may change due to a number of factors including toxicity and disease progression. A second-line therapy is initiated after first-line therapy fails due to disease progression, but claims data do not directly capture why a regimen changed and, therefore, in claims analyses, addition of a new agent or discontinuation of all agents in the original regimen after a specified time is often considered evidence of a new line of therapy. Corroboration of second-line therapy algorithms with medical chart review, widely considered the gold standard, affords the opportunity to refine analyses of treatment patterns and costs. A limitation of recently published claims-based analyses of second-line treatment patterns and costs in metastatic colorectal cancer is the ability to distinguish between lines of therapy based on clinically documented disease progressionCitation13,Citation14. One study of second-line therapy costs reported significant costs saving with bevacizumab compared with cetuximabCitation13. The data for more than 95% of the patients in that study were collected prior to the label restriction limiting anti-EGFR agents to patients without KRAS mutations and it is unknown whether costs would be different among only patients appropriate for anti-EGFR therapy.
The objectives of this study were two-fold. Our first goal was to compare results of a second-line therapy algorithm with medical chart data and then refine the algorithm to improve the identification of patients who truly initiated second-line therapy due to disease progression. The second goal was to utilize the refined algorithm to assess contemporary treatment patterns and the impact of different targeted therapies on healthcare costs of patients with metastatic colorectal cancer. Bevacizumab was the only targeted agent approved for first-line use when our study ended in 2011; thus we focused our cost comparisons on the second-line targeted agents approved through 2011.
Methods
Design and data source
This retrospective analysis used administrative health claims data (1 July 2007–31 December 2011) from the Optum Research Database and represents a geographically diverse, national health plan. During the course of the study, more than 25 million individuals with medical and pharmacy benefits were enrolled in the plan. The database contains International Classification of Diseases, Ninth Revision, Clinical Modification (ICD-9-CM) diagnosis and procedures codes, Current Procedural Terminology, Version 4 procedure codes, Healthcare Common Procedure Coding System procedure codes, site of service codes, and health plan and patient-paid amounts. Records of patient deaths were captured from the Social Security Administration master death file and facility-based discharge codes indicating death. All data were de-identified according to Health Insurance Portability and Accountability Act privacy guidelinesCitation15. Institutional Review Board approval was obtained to access a random sample of medical charts for patients included in the study.
Patient selection
Patients with metastatic colorectal cancer were identified from medical claims: (1) ≥ 2 claims for colon (ICD-9-CM 153.xx) or rectal cancer (ICD-9-CM 154.0x, 154.1x, 154.8x), at least 30 days apart, between 1 July 2007 and 30 June 2011 and (2) ≥2 claims for metastases (ICD-9-CM 196.0x-196.1x, 196.3x–196.5x, 196.8x, 197.0x–197.3x, 197.7x, 198.xx) at least 30 days apart between 1 January 2008 and 30 June 2011. The metastasis date was the date of the first claim with a diagnosis of metastasis during the identification period (1 January 2008–30 June 2011). Patients with evidence of any primary cancers other than colorectal cancer (ICD-9-CM 140.xx–152.xx, 154.2x–154.3x, 155.xx–172.xx, 174.xx–195.xx, 199.xx–209.xx), or metastatic disease 6 months prior to the metastasis date (starting on 1 July 2007 for patients diagnosed with metastatic disease on 1 January 2008) were excluded. Claims for laboratory or diagnostic services were not considered when identifying cancer diagnoses as these may represent rule-out rather than diagnostic confirmation. Continuous enrolment in the health plan (with both medical and pharmacy benefits) was also required for at least 6 months prior to and after the metastasis date. Patients were followed until the earliest of death, disenrolment or end of study period on 31 December 2011, whichever occurred first; patients with less than 6 months of data after the metastasis date, due to death, were included in the analysis. Patients were required to have evidence of two lines of therapy (LOT) after the metastasis date; the index date was the date that the second LOT began and patient characteristics were examined during the 6-month period prior to the index date (baseline). The second LOT must have included a biological agent approved for use at the time of the study (bevacizumab, cetuximab, or panitumumab) and patients with evidence of receipt of more than one biological agent during second LOT were also excluded. Three mutually exclusive second LOT cohorts, based on the presence of a single biological agent, were established: bevacizumab, cetuximab, and panitumumab.
Line of therapy algorithm
Initial algorithm
Two LOTs for each patient were identified during follow-up. The first LOT regimen comprised all chemotherapy and targeted agents (‘initial’ agents, including 5-fluorouracil, capecitabine, irinotecan, and oxaliplatin, and targeted agents (bevacizumab, cetuximab, and panitumumab) a patient received within 7 days of the first infusion or fill. The first LOT began on the date of the first infusion/fill of an initial agent and ended at the earliest of (1) addition of a new agent (chemotherapy or targeted therapy) at least 28 days after the initial agents used in the LOT; or (2) discontinuation (a treatment gap of at least 90 days) of all initial agents used in the LOT; or (3) end of the continuous enrolment or study period. The second LOT began on the claim date for a new chemotherapy or targeted agent that was not part of the first LOT regimen and occurred at least 28 days after the start of the first LOT. The criteria for the end date of the second LOT were the same as the first LOT.
Patients who met the selection criteria and initial LOT algorithm were identified in the claims data. Medical records of a sub-set of these patients were reviewed to determine how often the initial claims-based LOT algorithm had identified patients with evidence in the medical charts of receiving: (1) more than one line of therapy and (2) second line therapy that included bevacizumab, cetuximab, or panitumumab.
Final algorithm
After review of medical chart data, the initial algorithm was updated to better define the end of a LOT, although the definition of the LOT start remained the same. In the final algorithm, a LOT began on the date of the first infusion/fill of an initial agent and ended at the latest date of a claim for any of the initial agents prior to the earliest of (1) a treatment gap of at least 90 days or (2) addition of a new chemotherapy agent (but not a targeted agent) at least 28 days after the start of the initial agents with an exception—a switch from 5-fluorouracil to capecitabine (and vice versa) was not considered a new agent (and did not trigger a new LOT), or (3) end of the continuous enrolment or study period. Thus, addition of a new targeted agent (i.e., bevacizumab, which may have been added in the 2nd or 3rd cycle) to the first LOT did not initiate a second LOT and 5-fluorouracil and capecitabine were considered interchangeable. Data for the second LOT were considered censored if all of the following conditions were met: (1) the end date of the LOT was less than 90 days before disenrolment or end of the study period; (2) there was no evidence of initiation of a third LOT; and (3) the patient survived for more than 28 days after the end of the first LOT. Patients with censored data were included in the analyses.
The patient selection criteria and the final claims-based LOT algorithm were used to identify the final study sample of patients with evidence of a second LOT for metastatic disease from colorectal cancer in the claims database from 1 January 2008 to 31 December 2011, and differences in outcomes were assessed by second LOT cohorts.
Medical chart review
After obtaining the necessary approvals (including Institutional Review Board and Privacy Board approvals), medical charts were acquired for a sub-set of patients in the claims database who met patient selection criteria (from 1 January 2008 to 30 June 2010) and had evidence of at least two lines of therapy as defined by the initial LOT algorithm between 1 January 2008 and 31 December 2010. Initially, more than 250 patients eligible for chart abstraction were identified. For each patient, the medical oncologist associated with the largest number of claims for each patient was invited to participate in the study by providing medical charts for review. If no oncologist was identified, then the physician associated with the most claims was contacted. The final convenience sample of medical charts available for review comprised the first 100 charts provided by physicians who opted to participate. An oncologist (A.T.) abstracted chart data to corroborate that the patient met the inclusion criteria for presence of: metastatic colorectal cancer, received more than one LOT (that is, change in regimen due to evidence of disease progression) and had bevacizumab, cetuximab or panitumumab in the second LOT. After the initial abstraction of the 100 charts (during assessment of the LOT algorithm) eight charts were later determined to be incomplete; therefore, 92 charts were used in the assessment of the claims-based LOT algorithm.
Measures/study variables
Demographic characteristics and health plan features during the index year (i.e., year of initiation of second LOT) and the Quan-Charlson comorbidityCitation16 score for the 6-month baseline were determined. Chemotherapy and targeted agents commonly used in the treatment of colorectal cancer or recommended by NCCNCitation17 guidelines were individually identified during first and second LOT and included chemotherapy agents, 5-fluorouracil, capecitabine, irinotecan, and oxaliplatin, and targeted agents (bevacizumab, cetuximab, and panitumumab). In addition, evidence of any other chemotherapy agent, and any other targeted agent during the LOT was identified. The presence of specific individual agents (other than bevacizumab, cetuximab, or panitumumab in second LOT) was not required for the inclusion/exclusion criteria; for example, patients who received bevacizumab in second LOT could also have received bevacizumab in the first LOT. The treatment regimen consisted of all agents identified during each LOT.
Total healthcare costs were computed as the sum of all health plan and patient-paid amounts for medical (inpatient, hospital outpatient, office, emergency room, other) and pharmacy claims. Costs of chemotherapy and targeted agents (including infusion costs) were also determined separately and as aggregate costs. When chemotherapy and targeted agent costs are presented separately, these costs include all infusion costs that occurred on the same day as the claims for the drugs. All costs were determined for the entire length of the second LOT and per patient per month (PPPM). Costs were adjusted to 2011 US dollars by the medical component of the Consumer Price IndexCitation18.
Statistical analysis
Data abstracted from medical charts were used to categorize patients correctly identified by the claims-based LOT algorithm as having a second LOT that included bevacizumab, cetuximab, or panitumumab. True positives were determined from chart data and the sum of true positives plus false positives represented the patients identified from the LOT algorithm. The positive predictive value (i.e., match rate) of the claims-based algorithm was calculated as:
After calculation of the initial match rate, medical chart data of patients who were false positives were examined and this information was used to refine the claims-based algorithm and the final match rate was calculated.
Patients treated with panitumumab-containing regimens were excluded from the outcome analyses due to small sample size (n = 41). For analysis of treatment patterns and outcomes, the second LOT was required to be at least 14 days long, in order that at least one cycle of targeted therapy was assessed. Differences between the bevacizumab and cetuximab cohorts for all measures were assessed by t-test (continuous variables) or chi-square test (proportions). In addition, total healthcare costs, adjusted for demographic and clinical variables, were analysed with a generalized linear model with log-link. Adjustment variables were gender, Quan-Charlson comorbidity score, insurance type (commercial or Medicare Advantage), index year, duration of first LOT, duration of second LOT (excluded from PPPM models), time between first and second LOT, and the following binary variables: surgery during the 6 months before second LOT, radiation during the 6 months before second LOT, and targeted agent monotherapy during second LOT.
Sensitivity analysis
We hypothesized that patients who changed regimens soon after treatment initiation likely experienced severe drug-related toxicity; therefore, a sensitivity analysis examining match rate and differences in outcomes by second LOT cohort was conducted for the sub-set of patients whose first LOT was at least 60 days.
Results
Patients
Based on the initial LOT algorithm there were 644 patients who met patient selection criteria for the initial claims-based algorithm with a second LOT that included bevacizumab or anti-EGFR therapy during the initial identification period of 1 January 2008 to 30 June 2010: 517 bevacizumab patients and 127 anti-EGFR patients (data not shown). Among these patients, 92 had medical record data abstracted and used in the analysis and refinement of the claims-based LOT algorithm.
shows the process by which the final study population was derived after applying the final claims-based algorithm based on the information from the chart review. Among approximately 25,751,087 health plan enrollees during the identification period of 1 January 2008 to 30 June 2011, there were 680 patients who met the final criteria for having a second LOT that included either bevacizumab, cetuximab, or panitumumab. Due to small sample size (n = 41), panitumumab patients were excluded from outcomes analysis. The number of patients in the bevacizumab and cetuximab 2nd LOT cohorts were: 450 vs 119, respectively, for the main outcomes analysis and 290 vs 84, respectively, for the sensitivity analysis. There was no significant difference in age, gender, baseline Charlson comorbidity score, insurance type, or year of second line therapy initiation by cohort (). In addition, there was no significant difference in mean costs incurred during the 6 months prior to initiation of second-line therapy.
Figure 1. Sample selection.
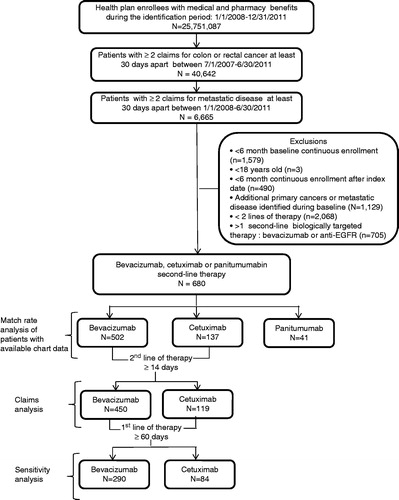
Table 1. Patient demographic and clinical characteristics.
Match rate
The match rates for second LOT between chart-based data and the initial and final algorithms, including the sensitivity analysis of the final algorithm, are shown in . Compared with the initial algorithm, the match rate for evidence of multiple LOT increased from 68.5% (95% CI = 58.0–77.8) to 85.3% (95% CI = 73.8–93.0) for the final algorithm and to 97.7% (95% CI = 88.0–99.9) for the sensitivity analysis. The match rate for the bevacizumab cohort increased from 46.4% (95% CI = 34.3–58.8) to 71.4 (95% CI = 55.4–84.3) for the final algorithm and to 82.1% (95% CI = 63.1–93.9) in the sensitivity analysis. The match rate for the cetuximab cohort was 66.7% (95% CI = 38.4–88.2) for the final algorithm and increased to 75.0% (95% CI = 42.8–94.5) in the sensitivity analysis.
Table 2. Match rate between claims-based algorithm and medical chart review for evidence of two lines of therapy.
Treatment patterns
The most common first LOT chemotherapy regimens contained 5-fluorouracil/capecitabine and oxaliplatin (). A higher proportion of patients in the second-line bevacizumab cohort received 5-fluorouracil/capecitabine as first LOT compared with the second-line cetuximab cohort (91.6% vs 80.7%, p < 0.001). Use of irinotecan was greater in the cetuximab cohort (28.6% vs 20.2%, p < 0.05). Bevacizumab was the most common first-line targeted agent and was more frequently included in the first-line regimen among the second-line bevacizumab cohort than the second-line cetuximab cohort (77.3% vs 60.5%, p < 0.001). First-line cetuximab use was lower in the second-line bevacizumab cohort vs the second-line cetuximab cohort (3.1% vs 26.9%, p < 0.001). Median duration of first LOT was similar for bevacizumb (105.5 days) and cetuximab (99.0 days) patients.
Table 3. First- and second-line treatment patterns.
Use of chemotherapy agents in second LOT differed between cohorts (). The most frequently used agent in the bevacizumab cohort was 5-fluorouracil/capecitabine (81.3%); irinotecan was the most common agent (73.1%) in the cetuximab cohort. Compared with the cetuximab cohort, a higher proportion of bevacizumab patients received oxaliplatin (36.7% vs 5.0%) and a smaller proportion were treated with monotherapy regimens (10.0% vs 17.7%). Mean treatment duration (123 days) and the proportion of patients who died or had censored data were similar between cohorts.
Healthcare costs during second LOT
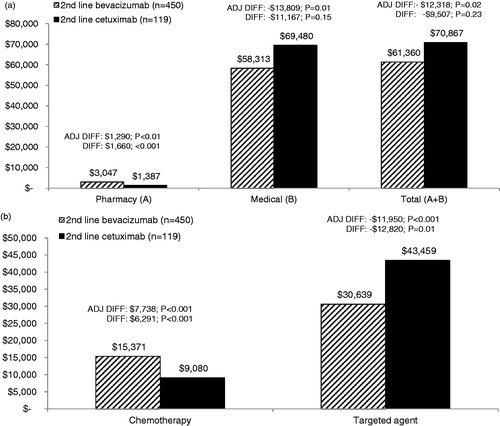
Mean costs during second LOT are shown in . Adjusted total costs (controlling for patient characteristics and treatment patterns) were significantly lower by −$12,318 (p = 0.02) among the bevacizumab cohort compared with the cetuximab cohort. Differences in total costs reflected lower medical (adjusted difference = −$13,809, p = 0.01) and targeted therapy agent plus infusion costs (adjusted difference = −$11,950, p = 0.01) in the bevacizumab cohort despite higher chemotherapy plus infusion costs (adjusted difference = $7738, p < 0.001) and pharmacy costs (adjusted difference = $1290, p < 0.01) in the bevacizumab cohort. Total regimen (chemotherapy and targeted agents plus infusion) costs were lower in the bevacizumab cohort, but the difference did not achieve statistical significance (p = 0.15).
Figure 2. (a) Mean total healthcare costs during second-line therapy. Adjusted (ADJ) and unadjusted difference (DIFF) in mean total healthcare costs between cohorts. Adjusted costs are based on the multivariate GLM model. Medical costs represent inpatient, hospital outpatient, office, emergency room, and other medical services. (b) Mean total chemotherapy and targeted agent costs during second-line therapy. Adjusted (ADJ) and unadjusted difference (DIFF) in mean chemotherapy and targeted agent costs between cohorts. Adjusted costs are based on the multivariate GLM model. Costs include all infusion costs that occurred on the same day as the claims for the drugs.
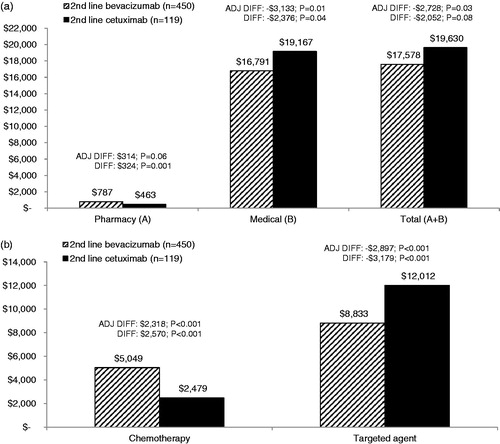
Lower monthly costs () were also evident in the bevacizumab cohort: adjusted total, medical and targeted agent (plus infusion) costs were lower by −$2728 (p = 0.03), −$3133 (p = 0.01), and −$2897 (p < 0.001), respectively. Monthly chemotherapy agent (plus infusion) costs were higher (p < 0.001) in the bevacizumab cohort. Total regimen costs did not differ between cohorts (p = 0.28). Actual costs for the bevacizumab cohort followed a similar pattern of lower total, medical, targeted therapy agent, and overall regimens costs, but the difference was not always significant.
Figure 3. (a) Mean monthly (PPPM) healthcare costs during second-line therapy. Adjusted (ADJ) and unadjusted difference (DIFF) in mean total healthcare costs between cohorts. Adjusted costs are based on the multivariate GLM model. Medical costs represent inpatient, hospital outpatient, office, emergency room, and other medical services. (b) Mean monthly (PPPM) chemotherapy and targeted agent costs during second-line therapy. Adjusted (ADJ) and unadjusted difference (DIFF) in mean chemotherapy and targeted agent costs between cohorts. Adjusted costs are based on the multivariate GLM model. Costs include all infusion costs that occurred on the same day as the claims for the drugs.
In the sensitivity analysis, second LOT costs for patients whose first LOT was at least 60 days were examined. Although the sample size was noticeably impacted (bevacizumab, n = 290; cetuximab, n = 84), total adjusted mean PPPM costs were $2938 lower (p = 0.04) and actual PPPM costs were $2860 lower (p = 0.04) among the bevacizumab cohort compared with the cetuximab cohort. Total costs for the duration of second LOT followed a similar trend though the difference in adjusted (−$11,480, p = 0.07) and unadjusted (−$11,370, p = 0.19) costs was not significantly different (data not shown).
Discussion
This study provides a real world assessment of contemporary treatment patterns and costs of second-line therapy that included a targeted agent (bevacizumab or cetuximab) in patients with metastatic colorectal cancer. We developed a claims-based algorithm, corroborated with medical chart abstraction, to better distinguish between first- and second-line treatments based on clinically documented disease progression from medical record data and to refine cost estimates of second-line therapy that included a targeted agent (bevacizumab or cetuximab). Our results demonstrate that total and monthly healthcare costs differed during second-line treatment by targeted therapy cohort. Total adjusted healthcare costs for the duration of second-line therapy were $12,318 lower with bevacizumab compared with cetuximab, and this difference reflected both lower medical ($13,809) and bevacizumab treatment costs ($11,950). Monthly costs exhibited the same pattern of lower total ($2728), medical ($3133), and targeted agent ($2897) costs in the bevacizumab cohort. Total chemotherapy costs were higher in the bevacizumab cohort by $7738 (monthly, $2318) and the combined chemotherapy plus targeted agents costs did not differ between the cohorts.
Our results corroborate an earlier study based on data from 2002–2009. Compared with the cetuximab cohort, total adjusted monthly healthcare costs in the bevacizumab cohort in this study were $2728 lower vs $6219 lower in the analysis by Yang et al.Citation13. Adjusted targeted therapy costs were also lower in the bevacizumab cohort by $2897 in our analysis vs $6104 (Yang et al.), despite higher chemotherapy costs with bevacizumab in both analyses. The study by Yang et al. also detected significantly lower total regimen costs (chemotherapy plus targeted agent) with bevacizumab; we noted a similar pattern but the difference was not significant. Our targeted therapy and chemotherapy costs included infusion costs and the earlier studyCitation13 did not. Actual total monthly healthcare costs were comparable between the studies: $17,578 vs $17,552Citation1Citation3 for bevacizumab, and $19,630 vs $22,12013 for cetuximab. In a study of metastatic colorectal cancer patients that estimated costs by disease stage (diagnosis, treatment, and death), monthly treatment costs were $8891Citation19. However, during the course of that study (2004–2009), only 30–40% of patients were treated with targeted therapies and ∼60% were treated with chemotherapy agents alone. These agents combined accounted for ∼70% of our total monthly costs.
Bevacizumab was a component of 74% of first-line therapy regimens which is consistent with its widespread use as reported in previous studies that did not select patients based on targeted therapy use in second-line treatment. In prior studies of patients initiating chemotherapy for metastatic colorectal cancer between 2003–2008, bevacizumab was included in 55%Citation14 to 74%Citation20 of the first-line regimens. Most patients (81–92%) initiated chemotherapy with a fluorouracil- or capecitabine-based regimen which is consistent with results from an earlier study in which 86% of first-line regimens contained fluorouracilCitation21. This pattern also conforms to NCCN guidelines for use of first-line bevacizumab in combination with a fluorouracil-based chemotherapy backboneCitation17. During second-line treatment, bevacizumab was used most often in combination with fluorouracil/capecitabine-based and/or irinotecan-based chemotherapy, while cetuximab was most frequently used in combination with irinotecan which conforms to previously reported second-line treatment patternsCitation14,Citation20. Both fluorouracil and irinotecan are recommended as the chemotherapy backbone in second-line use of bevacizumab and cetuximabCitation17. The availability of generic forms of chemotherapy agents also likely influenced cost results. Generic irinotecan became available in 2008, shortly after the start of our study, but generic oxaliplatin was not available until 2012, after our study concluded. Thus, the chemotherapy costs for the patients who were treated with bevacizumab in combination with oxaliplatin may be over-estimated and the total cost difference between bevacizumab and cetuximab is likely to be greater with use of generic oxaliplatin. Second-line therapy patterns will likely exhibit considerable variability, depending on individual patient clinical characteristics including the regimen used in the adjuvant setting, response to first line therapy, tolerability, tumour histology and biomarkers, duration of response, and patient performance status.
Previous claims-based studies of second line therapy patternsCitation13,Citation14 and costsCitation13 have used algorithms that defined initiation of a second-line therapy with the addition of any new chemotherapy or targeted agent administered at least 28 days after initiation of first-line therapy. Our comparison of medical chart data with claims data prompted two main changes in the claims-based LOT algorithm. We excluded the introduction of a targeted agent as an indicator for the start of second-line therapy because our medical chart review revealed that, even when bevacizumab was a planned component of first-line regimens, its introduction was often delayed to permit adequate wound healing in patients who had undergone recent surgery or biopsy. We also excluded a switch from 5-fluorouracil to capecitabine (and vice versa); these drugs are biologically interchangeable and a change from one to the other may reflect better tolerability, convenience of oral administration, (especially when venous access is problematic or limited), or lack of leucovorin availability (administered in conjunction with FOLFOX or FOLFIRI) rather than disease progression. Excluding these changes from identifying a second LOT increased the capability to detect second LOT containing bevacizumab from 46% to 71% and, for anti-EFGR, from 61% to 74%. In the sensitivity analysis, we required a minimum duration of first-line therapy of 60 days as we hypothesized that early regimen changes may be a result of drug-related toxicity rather than disease progression (which would prompt a new line of therapy). Although our sample of medical charts (n = 92) was relatively small, these results suggest an opportunity to improve the accuracy of second-line therapy identification. Future research should address algorithm refinement on a larger scale.
Limitations
Our results are based on healthcare claims captured for administrative purposes, not research, and our results should be considered in this context. Although our findings are strengthened by corroboration of claims results with medical chart review, medical charts may be incomplete. We used a relatively small convenience sample of medical charts which may not be representative of the study population on which results are based. Nevertheless we were able to confirm that bevacizumab is occasionally not added to a first cycle of chemotherapy during first-line therapy but may be added after two or more cycles; we also determined that a switch between capecitabine and 5-fluorouracil does not constitute initiation of a new line of therapy. We used a multivariate model to account for potential demographic and clinical differences between the two cohorts, and this improved the sensitivity of our cost analyses. However, there may have been unobserved differences (e.g., disease severity, patient performance status, and other clinical characteristics not available from claims data) that we could not account for in the model. We included only commercially or Medicare-insured patients; thus, our result may not be generalizable to Medicaid patients or the uninsured. Claims data only capture costs that were billed through insurance and it is possible that a patient may have paid out-of-pocket for drugs not approved or recommended for metastatic colorectal cancer at the time of the study. In addition, patients who participate in clinical trials may not have claims generated for some or all of care received in this context and would, therefore, not be detected in this claims-based analysis. Finally, the label for cetuximab was modified during the course of the study (July 2009), which restricted its use to patients with KRAS mutation-negative (wild type) tumour. Although more than half of the patients in the study began second-line therapy after the labeling change, costs based on full clinical adoption of the revised indication may vary.
Conclusions
In summary, total healthcare costs during second-line therapy were 14% lower and monthly costs were 13% lower with bevacizumab compared with cetuximab. Prior therapy, expectation of clinical benefit, and tolerability are the primary factors to consider in selecting second-line therapies. When comparable results can be achieved with different therapies, cost savings may be a relevant consideration in treatment decisions.
Transparency
Declaration of funding
This study was funded by Genentech, Inc. All authors contributed to the development of this manuscript.
Declaration of financial/other relationships
Stacey DaCosta Byfield is an employee of Optum. Stacey DaCosta Byfield and April Teitelbaum were paid consultants to Genentech, Inc. in connection with this work and development of this manuscript. Dana Evans, Robert Morlock, and Elaine Yu are employees of Genentech, Inc. JME Peer Reviewers on this manuscript have no relevant financial or other relationships to disclose.
Acknowledgements
Sarah Peirce-Sandner (Optum) provided medical writing support for this manuscript and was funded by Genentech, Inc.
References
- Siegel R, Naishadham D, Jemal A. Cancer statistics, 2012. CA Cancer J Clin 2012;62:10-29
- Mariotto AB, Yabroff KR, Shao Y, et al. Projections of the cost of cancer care in the United States: 2010–2020. J Natl Cancer Inst 2011;103:117-28
- Howlader N, Noone AM, Krapcho M, et al.; SEER Cancer Statistics Review, 1975–2009 (Vintage 2009 Populations). 2011. http://seer.cancer.gov/csr/1975_2009_pops09/results_merged/sect_06_colon_rectum.pdf. Accessed March 6, 2013
- Kopetz S, Chang GJ, Overman MJ, et al. Improved survival in metastatic colorectal cancer is associated with adoption of hepatic resection and improved chemotherapy. J Clin Oncol 2009;27:3677-83
- Kim DD, Eng C. The current state of targeted agents in rectal cancer. Int J Surg Oncol 2012;2012:406830 . doi: 10.1155/2012/406830. Epub 2012 May 17
- Genentech Inc. Avastin® (bevacizumab). Prescribing information. 2013. http://www.gene.com/gene/products/information/pdf/avastin-prescribing.pdf. Accessed March 6, 2013
- Bristol-Myers Squibb. Erbitux® (cetuximab) prescribing information. 2012. http://packageinserts.bms.com/pi/pi_erbitux.pdf. Accessed March 6, 2013
- Amgen I. Vectibix® (panitumumab) presribing information. 2013. http://pi.amgen.com/united_states/vectibix/vectibix_pi.pdf. Accessed March 6, 2013
- Bayer HealthCare Pharmaceuticals IncBayer HealthCare Pharmaceuticals I. Stivarga (regorafenib). Prescribing information. 2013. http://labeling.bayerhealthcare.com/html/products/pi/Stivarga_PI.pdf. Accessed March 6, 2013
- Regeneron Pharmaceuticals I. Zaltrap® (ziv-aflibercept). Prescribing information. 2012. http://www.regeneron.com/zaltrap/zaltrap-fpi.pdf. Accessed March 6, 2013
- Liang SY, Phillips KA, Wang G, et al. Tradeoffs of using administrative claims and medical records to identify the use of personalized medicine for patients with breast cancer. Med Care 2011;49:e1-8
- Lund JL, Sturmer T, Harlan LC, et al. Identifying specific chemotherapeutic agents in medicare data: a validation study. Med Care 2013;51:e27--34
- Yang H, Yu AP, Wu EQ, et al. Healthcare costs associated with bevacizumab and cetuximab in second-line treatment of metastatic colorectal cancer. J Med Econ 2011;14:542-52
- Hess GP, Wang PF, Quach D, et al. Systemic therapy for metastatic colorectal cancer: patterns of chemotherapy and biologic therapy use in US medical oncology practice. J Oncol Pract 2010;6:301-7
- US Department of Health and Human Services. Health Insurance Portability and Accountability Act of 1996. Public Law 104-191, 104th Congress. http://www.cms.gov/Regulations-and-Guidance/HIPAA-Administrative-Simplification/HIPAAGenInfo/TheHIPAALawandRelated-Information.html. Accessed March 6, 2013
- Quan H, Sundararajan V, Halfon P, et al. Coding algorithms for defining comorbidities in ICD-9-CM and ICD-10 administrative data. Med Care 2005;43:1130-9
- National Comprehensive Cancer Network (NCCN). NCCN clinical practice guidlines in oncology. Colon cancer. Version 3. 2013. http://www.nccn.org/professionals/physician_gls/pdf/colon.pdf. Accessed March 6, 2013
- US Department of Labor BoLS. Consumer Price Index. Chained Consumer Price Index. 2010. http://data.bls.gov/cgi-bin/surveymost?su. Accessed March 6, 2013
- Song X, Zhao Z, Barber B, et al. Characterizing medical care by disease phase in metastatic colorectal cancer. Am J Manag Care 2011;17(Suppl 5):SP20-5
- Zafar SY, Marcello JE, Wheeler JL, et al. Longitudinal patterns of chemotherapy use in metastatic colorectal cancer. J Oncol Pract 2009;5:228-33
- Ferro SA, Myer BS, Wolff DA, et al. Variation in the cost of medications for the treatment of colorectal cancer. Am J Manag Care 2008;14:717-25