
Abstract
Objective:
To evaluate the cost-effectiveness of bendamustine-rituximab (B-R) compared with CHOP-R (cyclophosphamide, doxorubicin, vincristine, prednisone, rituximab) and CVP-R (cyclophosphamide, vincristine, prednisone, rituximab) as first-line treatment for patients with advanced indolent non-Hodgkin’s lymphoma (NHL).
Methods:
A patient-level simulation was adapted from the model used by the University of Sheffield School of Health and Related Research (ScHARR) in a health technology appraisal of rituximab for first-line treatment of follicular lymphoma. This approach allowed modelling of the complex treatment pathways in indolent NHL. Data from a Phase 3 randomized, open-label trial were used to compare B-R with CHOP-R. The relative efficacy of CHOP-R and CVP-R was estimated using an indirect treatment comparison similar to the original ScHARR approach. The analysis was conducted from the perspective of the National Health Service in England and Wales, using a lifetime time horizon. A number of one-way sensitivity and scenario analyses were conducted, including one using recently published data comparing CVP-R with CHOP-R.
Results:
The deterministic incremental cost-effectiveness ratio (ICER) was £5249 per quality adjusted life year (QALY) for B-R vs CHOP-R, and £8092 per QALY for B-R vs CVP-R. The alternative scenario using direct data comparing CVP-R with CHOP-R approximately halved the ICER for B-R vs CVP-R to £4733. Owing to its better toxicity profile, B-R reduced the cost of treating adverse events by over £1000 per patient vs CHOP-R.
Limitations:
The main limitations were: immaturity of overall survival data from the Phase 3 trial; reliance on quality-of-life data from previous health technology appraisals (as this was not collected in the trial); and a lack of direct evidence or a network of connected evidence comparing B-R with CVP-R.
Conclusions:
The ICERs for B-R vs CHOP-R and CVP-R were considerably below the thresholds normally regarded as cost-effective in England and Wales (£20,000–30,000 per QALY).
Introduction
Non-Hodgkin’s lymphoma (NHL) is the sixth most common cancer in the UK and accounts for 4% of all new casesCitation1. In 2010, the incidence of NHL in the UK was 15.1 per 100,000 and 12,180 new cases were diagnosedCitation1. Worldwide, the incidence of NHL is 5.1 per 100,000, with 355,000 new cases diagnosed each year (based on 2008 data)Citation2. The risk of developing NHL increases with age, with the incidence rising sharply from 50 years and peaking between 80–84 yearsCitation1.
Indolent (low-grade) lymphomas represent 40% of all NHLs, with follicular lymphoma (FL) being the most common indolent sub-typeCitation3. Indolent lymphomas follow a relapsing and remitting disease course, with patients typically exposed to several successive treatment courses over a number of years. This can affect patients’ quality-of-life in a number of ways. As well as the symptoms of the disease, uncertainty (in relation to relapse), perceived lack of control, depression, and dependence on others are all relevant issuesCitation4.
Over the last 40 years, the 10-year overall survival rate for NHL has doubledCitation5. This is due, in part, to the introduction of better treatmentsCitation5, highlighting the importance of introducing optimal therapeutic options. One of these treatments is rituximab, an anti-CD20 monoclonal antibody that has become the central component of therapy for indolent NHL. In England and Wales, the National Institute for Health and Care Excellence (NICE) has recommended the first-line use of rituximab in combination with other chemotherapeutic agentsCitation6; CHOP (cyclophosphamide, doxorubicin, vincristine, and prednisone) and CVP (cyclophosphamide, vincristine, and prednisone) are the two regimens most commonly used (> 80% of first-line treatment for indolent NHLCitation7). CHOP is CVP plus the anthracycline doxorubicin, and CHOP plus rituximab (CHOP-R) is considered more effective than CVP plus rituximab (CVP-R), owing to doxorubicin’s presence. However, this increased effectiveness is offset by an unfavourable toxicity profile that prevents clinicians using CHOP-R in certain patients, notably those at risk of anthracycline-related cardiotoxicity (such as the elderly or patients with co-morbid cardiac conditions). In addition, the toxicity of doxorubicin is cumulative and irreversible, meaning that UK clinicians often choose to use CVP-R at first line, reserving CHOP-R for relapse.
Bendamustine is a novel cytotoxic alkylating agent that has a favourable toxicity profile and has previously been shown to be highly effective, both as monotherapy and in combination with rituximab, in patients with relapsed/refractory indolent NHLCitation8–12. Data published in early 2013 by Rummel et al.Citation13 show that bendamustine plus rituximab (B-R) is more effective and less toxic than CHOP-R in patients with previously untreated indolent NHL or mantle cell lymphoma. After a median follow-up of 45 months, patients treated with B-R had a significantly longer progression-free survival (PFS) than those treated with CHOP-R (69.5 months vs 31.2 months; p < 0.0001). More patients achieved a complete response (CR) with B-R than with CHOP-R (40% vs 30%; p < 0.02). There were significantly fewer haematological toxicities in the B-R group than in the CHOP-R group, including grade 3–4 neutropenia (p < 0.0001) and leukopenia (p < 0.0001).
The cost-utility analysis described below was carried out to inform an appraisal of B-R in the first-line treatment of indolent NHL by NICE. It was designed to evaluate B-R in comparison with CHOP-R and CVP-R. Chlorambucil-R was not included as a comparator as it is used infrequently and only when CHOP-R and CVP-R are not suitable (in very frail or elderly patients).
Methods
Model structure
The model was based on a patient-level simulation developed by an independent academic group at the University of Sheffield School of Health and Related Research (ScHARR) during the NICE appraisal of rituximab for the first-line treatment of follicular lymphomaCitation14. This allowed modelling of the complex treatment pathways that follow first-line treatment of indolent NHL. Specifically, treatment choice at second line could be modelled as a function of prior treatment choice, patient age, and first-line treatment outcome. Unless otherwise stated, the modelling approach was identical to that used by ScHARR. Health effects were expressed as quality-adjusted life years (QALYs), and the analysis was conducted from the perspective of the National Health Service (NHS) in England and Wales over a lifetime time horizon. The model was programmed using the statistical software, RCitation15.
The treatment pathways () were adapted from those used by ScHARR. Based on the efficacy of B-R and clinical experts’ advice, it was assumed that patients treated with B-R at first line would follow the same treatment pathway as CHOP-R patients. The model included 15,000 simulated patients (Appendix 1 [Supplementary material] shows key events experienced by patients and the sequence of these events over time). Patients entered the model in a state of being progression-free at first line (PFS1), where they received induction therapy (B-R in 28-day cycles or CHOP-R in 21-day cycles, each for a maximum of six cycles, as per the Rummel et al.Citation13 study, or CVP-R in 21-day cycles with a maximum of eight cyclesCitation14,Citation16). Unlike the ScHARR model, rituximab maintenance (R-maintenance) was included (NICE issued guidance on the use of R-maintenance therapy after the ScHARR model was developedCitation17). For responders to induction therapy (patients with a CR or partial response [PR]), maintenance therapy was assumed to begin 8 weeks after completion of induction therapyCitation18 and was administered every 8 weeks for a maximum of 24 monthsCitation19. Non-responders (those with stable or progressive disease [PD]) were not treated further, but were assumed to be monitored until disease progression, at which time they received second-line therapy. Time spent in PFS1 was a function of first-line treatment (tx1) and response to this treatment (response1). Patients left PFS1 following an event (either progression or death). First-line overall survival (OS1) was, therefore, modelled by estimating the proportion of PFS1 events that were deaths rather than progressions, as reported in the Rummel et al. study.
Figure 1. Treatment pathways. (A) B-R and CHOP-R. B-R: 28-day cycles; bendamustine 90 mg/m2/day on Days 1 and 2; rituximab 375 mg/m2 on Day 1; maximum six cycles. CHOP-R: 21-day cycles; cyclophosphamide 750 mg/m2 on Day 1; doxorubicin 50 mg/m2 on Day 1; vincristine 1.4 mg/m2 on Day 1; prednisone 100 mg/m2 on Days 1–5; rituximab 375 mg/m2 on Day 1; maximum six cycles. (B) CVP-R. CVP-R: 21-day cycles; cyclophosphamide 750 mg/m2 on Day 1; vincristine 1.4 mg/m2 on Day 1; prednisone 40 mg/m2 on Days 1–5; rituximab 375 mg/m2 on Day 1; maximum eight cycles. R-maintenance: 375 mg/m2 once every 8 weeks (first-line) and once every 3 months (second-line). Second-line treatment doses were taken from the approach by ScHARRCitation14. Early relapse, < 6 months after end of 24 months’ R-maintenance; late relapse, ≥6 months after end of 24 months’ R-maintenance. ASCT, autologous stem cell transplant; B, bendamustine; CHOP, cyclophosphamide, doxorubicin, vincristine and prednisone; CVP, cyclophosphamide, vincristine, and prednisone; FC, fludarabine and cyclophosphamide; HDT, high-dose therapy; R, rituximab.
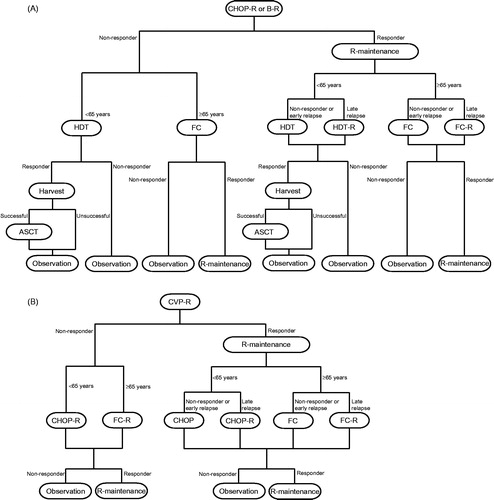
Upon starting second-line induction treatment, patients entered PFS in second line (PFS2). PFS2 was determined by the patient’s second-line treatment. OS2 represented the duration between entering PFS in second line and death. As for PFS2, OS2 was determined by the patients’ second-line treatment. Choice of second-line treatment was determined by tx1, response1, age, and PFS1. Second-line therapies were modelled as per the ScHARR approachCitation14, with the following exception: patients receiving CVP-R who relapsed < 6 months after completion of 24 months’ R-maintenance received either fludarabine plus cyclophosphamide (FC; if aged > 65 years) or CHOP (if aged < 65 years). In the ScHARR model, these patients received FC-R or CHOP-R, respectively. This change was made following advice from clinical experts who stated that patients relapsing early after first-line R-maintenance are not given rituximab-containing induction treatment at second line. Responders to induction were eligible for second-line R-maintenance as recommended by NICECitation20, given every 12 weeks for 24 months.
Responders to first- or second-line induction therapy experienced a ‘zero-risk’ period during induction. In this period, it was assumed that disease progression did not occur. In the first-line setting, this was confirmed by patient-level data analysis of the Rummel et al. study. In the second-line setting, the zero-risk period was applied because the survival curves available for responders were estimated from the end of the induction periodCitation14. This ‘zero-risk’ period was applied at the start of the survival curves for responders and, based on feedback from clinicians, lasted 5.52 months (equivalent to six 28-day B-R treatment cycles) for all first-line induction treatments. In second-line induction, responders were assigned a zero-risk period of 4.14 months (equivalent to six 21-day treatment cycles of CHOP or CHOP-R).
After a second progression event, patients entered the PD state, where they resided until death. The duration of PD was defined as (OS2 – PFS2). To avoid increasing the complexity of the model, PD was modelled as a single health state and there was no explicit modelling of third-line treatment outcomes.
Overall survival was modelled as the minimum of either general population mortality or OS1 (representing survival of those patients whose first event is death), or PFS1 plus OS2 (representing survival of those patients who progress to second-line treatment).
As a patient-level simulation, the model generated estimates of costs and consequences based on the time that patients spend in health states, rather than the proportion of patients occupying a health state at discrete time points. Appendix 2 (Supplementary material) shows the equations used to estimate time-in-state, and Appendix 3 (Supplementary material) shows selected model code.
Model inputs
Model inputs were similar to those used by ScHARR, with the major exception being the inclusion of data from an open-label, Phase 3, randomized clinical trial by Rummel et al.Citation13 to allow comparison of B-R with CHOP-R. A systematic search identified this as one of two studies that compared B-R with CHOP-R as first-line treatment for indolent NHL. The second study (the BRIGHT studyCitation21) was excluded from the analysis as it was only available as a conference abstract and did not report mature time to progression end-points. The Rummel et al. study included 549 patients with previously untreated mantle cell lymphoma or indolent NHL (i.e., FL, lymphoplasmacytic lymphoma, small lymphocytic leukaemia, marginal zone lymphoma). However, this cost-utility analysis included only those 447 patients with indolent lymphoma (B-R, n = 224; CHOP-R, n = 223), as mantle cell lymphoma is generally regarded as more aggressive and is, therefore, treated differently. It should be noted that the data used in this analysis are those submitted for regulatory approval (cut-off date 31st December 2010) and are unpublished. The data published by Rummel et al.Citation13 have a later cut-off date (31 October 2011) and therefore may differ from those presented here.
A systematic search did not identify any head-to-head randomized controlled trials comparing B-R and CVP-R, or any data suitable for an indirect comparison, therefore we used an approach similar to that used by ScHARR.
Patient characteristics
Age, gender, and body surface area (BSA) were sampled for each simulated patient. The proportion of males and females, their average age, and their BSA were based on population statistics for FL patients in England and Wales, and on the Primary RItuximab and MAintenance (PRIMA) trial conducted by Salles et al.Citation18 (). Correlation between age, gender, and BSA was modelled with a multivariate-normal distribution using covariance parameters estimated from individual patient data from the Rummel et al. study.
Table 1. Key clinical and quality-of-life inputs.
Time-in-state data
PFS1
Patients’ time to their first event (progression or death) was modelled using patient-level data from the Rummel et al. study. Separate parametric survival models were fitted for complete, partial, and non-responders to CHOP-R, with a treatment covariate for B-R vs CHOP-R included in each model. The preferred model was selected on the basis of a visual comparison of the fitted and Kaplan-Meier curves, and using Akaike’s Information Criteria and Bayesian Information Criteria as measures of relative statistical goodness of fit. The proportional hazards assumption was tested using a Cox model with treatment as a covariate (5% significance level; p = 0.071 for CR; 0.722 for PR; 0.93 for non-responders/non-evaluable)Citation22, Schoenfeld residualsCitation23, and Martingale residualsCitation24. No evidence was found to suggest a violation of this assumption. Based on this selection process, PFS1 was modelled using a log-normal distribution for complete and non-responders, and a Weibull distribution for partial responders (see Appendix 4 [Supplementary material]). The proportion of B-R and CHOP-R patients following each of these survival curves was based on the proportion of complete, partial, and non-responders for the Rummel et al. study (). This approach allowed flexibility in modelling different distributions for each response category. Base-case parameters for PFS1 curves are presented in .
For CVP-R patients, response rates were calculated by applying a relative risk of 0.84 to the CR and PR rates of the CHOP-R patients (). This relative risk corresponds to the ratio between overall response rates (ORRs) of 96.39% for CHOP-RCitation25 and 80.86% for CVP-RCitation16. Conditional upon response level, patients receiving CVP-R were assumed to experience the same PFS1 as those receiving CHOP-R.
The duration of treatment effect for all first-line treatments on PFS1 was assumed to be lifetime. The R-maintenance treatment effect was assumed to be 42 months from the start of maintenance therapy, and to be multiplicative to the effect of the induction treatment; this was modelled by applying a hazard ratio for R-maintenance of 0.55 (95% confidence interval = 0.44, 0.68)Citation18.
OS1
First-line survival was modelled using the proportion of first events that were deaths rather than progression events: 23% (16 deaths out of 71 events) for B-R and 18% (17 deaths out of 95 events) for CHOP-R. The assumption that deaths are a constant proportion of first events was confirmed by an analysis of the Rummel et al. study. This showed no evidence that the ratio of death to progression events changed over time. It was assumed that the proportion of first events that are death with CVP-R is equivalent to CHOP-R.
PFS2, OS2, and all-cause mortality
Modelling of PFS2 and OS2 was based on two large, long-term, randomized clinical studiesCitation26,Citation27. Non-responders to HDT ± R and responders who subsequently experienced an unsuccessful harvest were assigned the same PFS2 outcomes as non-responders to CHOP ± R (and FC ± R), and the same OS2 outcomes as CHOP ± R (and FC ± R) non-responders. HDT survival outcomes, which were a function of whether or not patients received rituximab, were only assigned to patients who received HDT ± R followed by a successful harvest. All patients receiving R-maintenance had the same OS2, regardless of their induction treatment (except those receiving HDT ± R followed by transplant who were not eligible for R-maintenance). Parameters for modelling all-cause mortality were also taken from the ScHARR approach. Appendix S4 (Supplementary material) shows the second-line response rates, and the PFS2 and OS2 curves.
Utility values
Utility values (with the exception of that for adverse events) were obtained from a study of 222 patients with FL by Wild et al.Citation28, which used the EQ-5D questionnaire. Wild et al. conducted a primary analysis on five different health states, and additional analyses aggregating these into two broader health states (pre-progression and disease progression). We used the aggregate values in the base-case. The impact of adverse events on quality-of-life was modelled using a constant utility decrement of 15% for 45 days; therefore, a decrement of 0.018 × the baseline utility was applied.
Costs
shows the costs applied in the model. Costs were taken from the British National FormularyCitation29, NHS reference costs 2010–2011Citation30, and ScHARRCitation14. Drug acquisition costs were calculated assuming a mean BSA of 1.8 m2. For treatments where the required dose is a function of BSA, it was assumed that the vial/pack size that yielded the lowest cost would be used, and that there would be no vial sharing. Patients who responded to HDT ± R, but who had an unsuccessful harvest and, therefore, did not go on to have an ASCT, were assigned the cost of a stem cell harvest. Patients who did have a successful stem cell harvest and, thus, went on to transplant were assigned the cost of an ASCT and harvest.
Table 2. Costs.
In scenarios where multiple chemotherapies are administered in a single day, the highest administration cost was applied and was assumed to cover administration of all chemotherapy drugs. Delivery of chemotherapy and maintenance therapy was assumed to occur on a day-case basis. Pharmacy costs were applied to rituximab-based regimens once per cycle of therapy. It was assumed that 30% of patients need patient transport; this cost was applied once per day of chemotherapy administration. Based on data from the Rummel et al. study, 15% of B-R patients and 35% of CHOP-R patients received granulocyte colony-stimulating factor in the model. The expected treatment cost per cycle was £3358 for B-R, £2381 for CHOP-R, and £2174 for CVP-R.
Beyond induction, it was assumed that patients received monitoring and management before first- and second-line progression events. Monitoring was assumed to coincide with the timing of R-maintenance administration. While in PFS1, responders during R-maintenance were monitored once every 2 months (one initial computerized tomography scan, plus the following each time: hospital visit, full blood count, patient history, full profile). Following completion of maintenance, patients were assumed to be monitored once every 4 months. While in PFS2, responders were monitored once every 3 months during and after R-maintenance. Non-responders were assumed to be monitored every month for the first 6 months following completion of induction therapies, both at first and second line. Thereafter, they were monitored once every 4 months while in PFS1, or once every 3 months while in PFS2. It was also assumed that patients require a computerized tomography scan (£159.55) every 2 months from start of third-line therapy until death.
Modelling of third-line therapies represented a weighted average of chemotherapy, radiotherapy, stem cell transplant, R-maintenance, and R-chemotherapy-based treatments. All third-line treatment costs were applied as one-off costs determined by the treatment received in second-line induction (). For patients receiving FC-containing therapies at second line, third-line treatment costs were assumed to be as for those who received CHOP-containing therapy at second line. For patients who received HDT ± R followed by ASCT at second line, third-line treatment costs were as for those receiving CHOP-R at second line. For patients who subsequently went on to palliative care, this was assumed to be administered for 3 months before deathCitation31, at a cost of £110 per monthCitation30. A cancer death was costed at £4189Citation1Citation4; non-cancer death was assumed to yield zero additional cost.
For B-R and CHOP-R, the same grade 3–4 adverse events as included in the ScHARR model, plus any others occurring in > 5% of patients in the Rummel et al. study, were included in the model. For CVP-R, the incidence of adverse events was taken from the FOLL-05 study by Federico et al.Citation32 that compared CHOP-R, CVP-R, and FM-R in FL.
As per guidance from NICECitation33, costs and utilities were discounted at 3.5% per annum. Where necessary, costs were inflated to current prices (2012) using the Hospital and Community Health Services Pay & Prices IndexCitation34.
Sensitivity analyses
Extensive sensitivity analyses were conducted for the NICE appraisal. The key analyses are discussed in this paper. The impact of using utility values as per the primary analysis by Wild et al.Citation28 (i.e., non-aggregated health states) was explored (). This meant that, unlike in the base-case, patients had different utilities depending on their depth of response and stage of treatment, allowing the differences in quality-of-life associated with these health states to be captured. The impact of assuming PFS1 equivalence between CHOP-R and CVP-R was explored using data from Federico et al.Citation32.
A probabilistic sensitivity analysis (PSA) was also conducted to calculate the uncertainty in the outcome measures. The inputs for the PSA were the expressions of uncertainty of each individual parameter entering the model. Distributions were assigned to a range of input parameters; random samples were then taken from these distributions over 1000 simulations (the number of PSA simulations is constrained in a patient-level simulation by the need to run each patient profile for each draw of the PSA). The proportions of complete, partial, and non-responders were varied with a Dirichlet distribution, all PFS1 parameters were varied with a multivariate normal distribution, and proportions (e.g., the proportion of first events that are death, the proportion of responders on second-line treatment, and the proportion of patients with adverse events) and utility values were varied with a beta distribution. The beta distribution was selected for utility values because it ensures that simulated values stay within the [0,1] bounds; based on the collected data (high utilities and relatively small standard deviations), it was clear that it would be inappropriate to model negative values. All costs were varied with a log-normal distribution with an assumed standard error of 5% around the log(mean), and the PFS2 and overall survival scale parameters were varied with a normal distribution (shape parameters were kept fixed owing to missing information around the variance-covariance matrix).
Results
Clinical predictions
shows time-in-state and cost by health state. In PFS1, B-R patients accrued an additional 2.48 and 3.27 undiscounted life years vs CHOP-R and CVP-R patients, respectively. B-R patients experienced a delay in time to first event compared with CHOP-R patients, mainly due to the treatment effect of B-R on PFS (as seen in the Rummel et al.Citation13 study), and more B-R patients responding to first-line therapy and, therefore, receiving R-maintenance. Consequently, more B-R patients died before reaching second-line therapy (43% vs 32% with CHOP-R and 29% with CVP-R). B-R patients accrued an additional 1.49 and 1.31 undiscounted total life years vs CHOP-R and CVP-R patients, respectively.
Table 3. Key results.
These extensions to PFS1 and overall survival were within the range reported in the ScHARR modelCitation14 for the addition of rituximab to a range of chemotherapy regimens. This model reported extensions to PFS1 of 2.97–3.16 undiscounted life years and extensions to overall survival of 0.85–1.64 undiscounted life years.
Cost-effectiveness predictions
B-R patients accumulated the highest total costs, yielding incremental lifetime costs per patient of £3826 vs CHOP-R and £4921 vs CVP-R. The difference between B-R and CHOP-R was driven by the following factors: higher acquisition and administration costs per cycle for B-R; a higher proportion of B-R patients receiving R-maintenance; B-R patients receiving R-maintenance for longer owing to them spending longer in PFS1. In all resource categories following first-line treatment, B-R was cost-saving compared with CHOP-R. B-R was also cost-saving compared with CHOP-R in terms of adverse events: £1043 saved per patient. Compared with CVP-R, B-R was cost-saving in all categories following second-line induction; adverse event costs were similar.
shows the base-case results. The deterministic incremental cost-effectiveness ratios (ICERs) of £5249 per QALY vs CHOP-R and £8092 per QALY vs CVP-R show that B-R is highly cost-effective at conventional cost-effectiveness thresholds (£20,000–30,000 per QALY). Not assuming that PFS1 was equivalent for CHOP-R and CVP-R conditional upon response, and using the time to event hazard ratio from the FOLL-05 study by Federico et al.Citation32 approximately halved the ICER for B-R vs CVP-R (). Reducing the length of the treatment benefit from lifetime to 80 months increased the ICERs to £7796 (B-R vs CHOP-R) and £12,061 (B-R vs CVP-R; ).
Table 4. Results of sensitivity analyses.
When a fully incremental analysis was considered, CVP-R dominated CHOP-R in the base-case, and the only relevant ICER was the base-case ICER for B-R vs CVP-R. This is likely to reflect the assumptions made regarding the relative efficacy of CVP-R and CHOP-R. When the data from Federico et al.Citation32 were used, the fully incremental analysis showed that CHOP-R was associated with an ICER of £3755 per QALY (vs CVP-R) and that B-R is associated with an ICER of £5249 per QALY (vs CHOP-R).
Removal of the R-maintenance treatment effect () altered the base-case estimates of incremental undiscounted life years to 1.58 and 0.97 for B-R vs CHOP-R and CVP-R, respectively (vs 1.49 and 1.31 in the base-case). Removal of OS1 events altered the base-case estimates of incremental life years to 1.57 and 1.18 for B-R vs CHOP-R and CVP-R, respectively. This shows that the survival gain observed in the model was driven by delaying entry to PFS2, where a higher risk of death is observed, rather than by OS1 or R-maintenance effects.
Applying utility scores from the primary analysis by Wild et al.Citation28 reduced the ICER relative to both CHOP-R and CVP-R (). This approach could be seen as a more accurate mapping of the quality-of-life experienced by patients in the different health states.
The ICERs were insensitive to all other changes in parameters explored in the key sensitivity analyses and remained below £20,000, with most below £10,000 ().
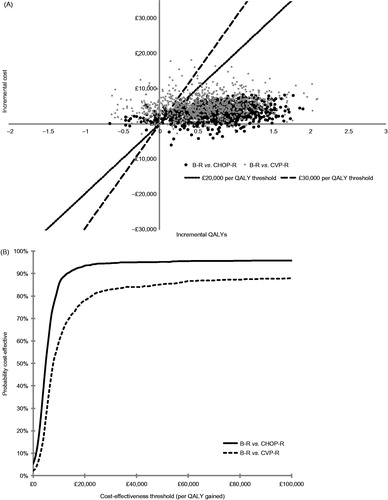
shows the results of the PSA as distributions of simulations on a cost-effectiveness plane and as a cost-effectiveness acceptability curve. At the £20,000 per QALY threshold, the probability of B-R being cost-effective was 94% compared with CHOP-R and 78% compared with CVP-R.
Figure 2. Results of probabilistic sensitivity analysis (1000 simulations). (A) Distribution of simulations on the cost-effectiveness plane. (B) Cost-effectiveness acceptability curve. B, bendamustine; CHOP, cyclophosphamide, doxorubicin, vincristine, and prednisone; CVP, cyclophosphamide, vincristine, and prednisone; QALY, quality-adjusted life year; R, rituximab.
Discussion
Clinical data show that B-R has significant benefits over CHOP-R in terms of PFS, CR rate, and tolerability profileCitation13. Based on the results of this cost-utility analysis, these important clinical benefits translate into positive cost-effectiveness outcomes. The ICERs for B-R vs CHOP-R and CVP-R are below the thresholds for cost-effectiveness commonly applied in England and Wales, suggesting that the use of B-R for the first-line treatment of indolent NHL would constitute an appropriate use of NHS budget. Given that the European Society for Medical Oncology recommends chemotherapy plus rituximab as standard of care in FL (the most common type of indolent NHL)Citation35, it is likely that these results are also relevant outside of England and Wales.
This evaluation was based on an adaptation of a robust model recently designed by an independent academic group (ScHARR) to support a multiple technology appraisal of rituximab as first-line treatment for stage III-IV FLCitation14. The use of a patient-level simulation allowed us to mirror the complex indolent NHL treatment pathways in England and Wales (including the recently recommended R-maintenanceCitation17), and to account for patients’ individual characteristics and previous therapies.
Data comparing B-R with CHOP-R were derived from a large head-to-head, open-label, randomized controlled trial, and the doubling of median PFS observed by the investigators, along with the improved adverse event profile, constitutes the main driver of cost-effectiveness in our analysis. Overall, the model predicted that indolent NHL patients treated with B-R at first line will have a longer survival time than those treated with CHOP-R and CVP-R. Owing to immaturity of the data, and the use of salvage therapies (including bendamustine-based regimens and stem cell transplant) for CHOP-R patients upon progression, the Rummel et al.Citation13 study has not yet shown any difference between treatments in overall survival. Nonetheless, a long-term survival benefit of B-R was considered plausible by clinical experts consulted during development of the model. The relationship between PFS gain and overall survival gain has been accepted in previous appraisals of treatments for NHLCitation6,Citation20.
Mature time-to-event data are not yet available from the BRIGHT study (which compares B-R with CHOP-R or CVP-R)Citation21. However, interim response rates confirm that B-R induces higher CR rates than CHOP-R and CVP-R, validating the inputs in our model.
Limitations
The lack of mature overall survival data in the Rummel et al. study (see above) was one of the main limitations. Another limitation relates to health-related quality-of-life (HRQoL) data. These were not collected in the Rummel et al. study, therefore we used utility values as per previous health technology appraisalsCitation6,Citation17. This is likely to bias against B-R, as these scores do not differentiate between having a CR or PR, or between being in first or second remission. The original study by Wild et al.Citation28 did suggest that patients’ quality-of-life varied, depending on whether they had experienced their first relapse or not; using these values significantly reduced the ICERs vs CHOP-R and CVP-R. In addition, recent data from the BRIGHT study suggest that, overall, patients treated with B-R have a greater improvement in their HRQoL than those treated with CHOP-R or CVP-RCitation36. This improvement was likely to reflect the improved acute toxicity profile seen with B-R over CHOP-R. This will also have implications on the burden of healthcare; indeed the model predicts that the cost saving linked to adverse event management when using B-R over CHOP-R is ∼£1000 per patient, representing a 25% offset of the incremental cost of drug acquisition.
The study by Wild et al.Citation28 was carried out in patients with FL, whereas our analysis included patients with other indolent NHL sub-types. This could be seen as a limitation; however, clinical experts consulted during development of the economic model were of the opinion that different disease states (e.g., PD, remission) will be associated with equivalent quality-of-life, regardless of histology.
At the time of building the model, no direct or indirect evidence was available to inform a formal comparison with CVP-R. Although the response rates for CVP-R were adjusted in the base-case, the TTP was assumed equivalent to CHOP-R for a given response category; this was judged to be conservative by experts, as it is empirically accepted that, conditionally upon response, CHOP-R will provide better disease control than CVP-R. This has now been confirmed by the results of the FOLL-05 study (Federico et al.)Citation37. We conducted a sensitivity analysis using preliminary data from FOLL-05 presented as a conference paperCitation32; this reduced the ICER for B-R vs CVP-R substantially (from £8092 to £4733; ), suggesting the base-case was indeed conservative.
Conclusion
B-R offers a first-line treatment option for indolent NHL that is clinically effective, well-tolerated, helps offset costs related to adverse event management, and is below the thresholds used by decision-makers to judge cost-effectiveness.
Transparency
Declaration of funding
This analysis was funded by Napp Pharmaceuticals Limited and Mundipharma International Limited.
Declaration of financial/other relationships
SD is employed by SHE; BW and CP are employed by Oxford Outcomes, two companies that received funding from Napp Pharmaceuticals Limited and Mundipharma International Limited to develop the economic model. JGC and WD are employees of Mundipharma International Limited (Napp Pharmaceuticals Limited and Mundipharma International Limited are independent associated companies). JME Peer Reviewers on this manuscript have no relevant financial relationships to disclose.
Supplementary Material
Download PDF (221.7 KB)Acknowledgements
Dr Joanna Todd (Napp Pharmaceuticals Limited) provided medical writing services. Data from this analysis were presented as a poster at the International Society for Pharmacoeconomics and Outcomes Research 16th European Congress; 2–6 November 2013; Dublin, Eire.
References
- Cancer Research UK. Non-Hodgkin lymphoma incidence statistics. http://www.cancerresearchuk.org/cancer-info/cancerstats/types/nhl/incidence. Accessed November 27, 2013
- Ferlay J, Shim H-R, Bray F, et al. Estimates of worldwide burden of cancer in 2008: GLOBOCAN 2008. Int J Cancer 2010;127:2893-917
- Harris NL, Jaffe ES, Diebold J, et al. The World Health Organization classification of neoplastic diseases of the hematopoietic and lymphoid tissues. Report of the Clinical Advisory Committee meeting, Airlie House, Virginia, November 1997. Ann Oncol 1999;10:1419-32
- Cella D, Mahon S, Donavan M. Cancer recurrence as a traumatic event. Behav Med 1990;16:15-22
- Cancer Research UK. Non-Hodgkin lymphoma survival doubles since early 1970s. Press release 23 May 2013. London. www.cancerreasearchuk.org/cancer-info/news/archive/pressrelease/. Accessed November 27, 2013
- National Institute for Health and Clinical Excellence. Rituximab for the first-line treatment of stage III-IV follicular lymphoma: review of NICE technology appraisal guidance 110. NICE Technology Appraisal Guidance 243: January 2012. London. http://publications.nice.org.uk/rituximab-for-the-first-line-treatment-of-stage-iii-iv-follicular-lymphoma-ta243. Accessed November 27, 2013
- Mundipharma International Limited. Data on file. Mundipharma Europe Oncology Analyzer. August 2012
- Cheson BD, Rummel MJ. Bendamustine: rebirth of an old drug. J Clin Oncol 2009;27:1492-501
- Rummel MJ, Al-Batran SE, Kim S-Z, et al. Bendamustine plus rituximab is effective and has a favourable toxicity profile in the treatment of mantle cell and low-grade non-Hodgkin’s lymphoma. J Clin Oncol 2005;23:3383-9
- Robinson KS, Williams ME, van der Jagt RH, et al. Phase II multicenter study of bendamustine plus rituximab in patients with relapsed indolent B-cell and mantle cell non-Hodgkin’s lymphoma. J Clin Oncol 2008;26:4473-9
- Friedberg JW, Cohen P, Chen L, et al. Bendamustine in patients with rituximab-refractory indolent and transformed non-Hodgkin’s lymphoma: results from a phase II multicenter, single-agent study. J Clin Oncol 2008;26:204-10
- Kahl BS, Bartlett NL, Leonard JP, et al. Bendamustine is effective therapy in patients with rituximab-refractory, indolent B-cell non-Hodgkin lymphoma: results from a multicenter study. Cancer 2010;116:106-14
- Rummel MJ, Niederle N, Maschmeyer G, et al. Bendamustine plus rituximab versus CHOP plus rituximab as first-line treatment for patients with indolent and mantle-cell lymphomas: an open-label, multicentre, randomised, phase 3 non-inferiority trial. Lancet 2013;381:1203-10
- Papaioannou D, Rafia R, Rathbone J, et al. Rituximab for the first-line treatment of stage III-IV follicular lymphoma (review of Technology Appraisal No. 110): a systematic review and economic evaluation. Health Technol Assess 2012;16:1-253
- R Development Core Team. The R project for statistical computing. Vienna. http://www.r-project.org. Accessed November 27, 2013
- Marcus R, Imrie K, Belch A, et al. CVP chemotherapy plus rituximab compared with CVP as first-line treatment for advanced follicular lymphoma. Blood 2005;105:1417-23
- National Institute for Health and Clinical Excellence. Rituximab for the first-line maintenance treatment of follicular non-Hodgkin’s lymphoma. NICE Technology Appraisal Guidance 226: June 2011. http://publications.nice.org.uk/rituximab-for-the-first-line-maintenance-treatment-of-follicular-non-hodgkins-lymphoma-ta226. Accessed November 27, 2013
- Salles G, Seymour JF, Offner F, et al. Rituximab maintenance for 2 years in patients with high tumour burden follicular lymphoma responding to rituximab plus chemotherapy (PRIMA): a phase 3, randomised controlled trial. Lancet 2010;377:42-51
- Roche Products Limited. MabThera summary of product characteristics. 2013. Leatherhead, Surrey. http://www.medicines.org.uk/emc. Accessed November 27, 2013
- National Institute for Health and Clinical Excellence. Rituximab for the treatment of relapsed or refractory stage III or IV follicular non-Hodgkin’s lymphoma: review of technology appraisal guidance 37. NICE Technology Appraisal Guidance 137: February 2008. http://publications.nice.org.uk/rituximab-for-the-treatment-of-relapsed-or-refractory-stage-iii-or-iv-follicular-non-hodgkins-ta137. Accessed November 27, 2013
- Flinn IW, van der Jagt R, Kahl BS, et al. An open-label, randomized study of bendamustine and rituximab (BR) compared with rituximab, cyclophosphamide, vincristine, and prednisone (CVP-R) or rituximab, cyclophosphamide, doxorubicin, vincristine, and prednisone (CHOP-R) in first-line treatment of patients with advanced indolent non-Hodgkin’s lymphoma (NHL) or mantle cell lymphoma (MCL): the BRIGHT study. Blood (ASH Annual Meeting Abstracts) 2012;120:abstract 902
- Grambsch P, Therneau T. Proportional hazards tests and diagnostics based on weighted residuals. Biometrika 1994;81:515-26
- Schoenfeld D. Partial residuals for the proportional hazards regression model. Biometrika 1982;69:239-41
- Lin DY, Wei LJ, Ying Z. Checking the Cox model with cumulative sums of Martingale-based residuals. Biometrika 1993;80:557-72
- Hiddemann W, Kneba M, Dreyling M, et al. Frontline therapy with rituximab added to the combination of cyclophosphamide, doxorubicin, vincristine, and prednisone (CHOP) significantly improves the outcome for patients with advanced-stage follicular lymphoma compared with therapy with CHOP alone: results of a prospective randomized study of the German Low-Grade Lymphoma Study Group. Blood 2005;106:3725-32
- van Oers MH, Van GM, Giurgea L, et al. Rituximab maintenance treatment of relapsed/resistant follicular non-Hodgkin's lymphoma: long-term outcome of the EORTC 20981 phase III randomized intergroup study. J Clin Oncol 2010;28:2853-8
- Sebban C, Brice P, Delarue R, et al. Impact of rituximab and/or high-dose therapy with autotransplant at time of relapse in patients with follicular lymphoma: a GELA study. J Clin Oncol 2008;26:3614-20
- Wild D, Pettengell R, Lewis G. Utility elicitation in patients with follicular lymphoma. Poster presented at ISPOR 9th Annual European Congress; 2006 Oct 28-31; Copenhagen, Denmark
- Joint Formulary Committee. British National Formulary [online]. 2012. London. http://www.medicinescomplete.com/mc/bnf/current/. Accessed January 28, 2013
- NHS Reference Costs 2010–11. London: Department of Health. http://www.dh.gov.uk/en/Publicationsandstatistics/Publications/PublicationsPolicyAndGuidance/DH_131140. Accessed November 27, 2013
- Guest JF, Ruiz FJ, Greener MJ, et al. Palliative care treatment patterns and associated costs of healthcare resource use for specific advanced cancer patients in the UK. Eur J Cancer Care 2006;15:65-73
- Federico M, Luminari S, Dondi A, et al. CVP-R vs. CHOP-R vs R-FM for the initial treatment of patients with advanced-stage follicular lymphoma. Final results of the FOLL05 trial from the Fondazione Italiana Linfomi. Presented at the ASCO Annual Meeting; 2012 Jun 1 – 5; Chicago, IL, USA. http://issuu.com/spom/docs/1_8006_federicorev. Accessed September 13, 2013
- National Institute of Clinical Excellence. Guide to the methods of technology appraisal. 2008. London. http://www.nice.org.uk/media/B52/A7/TAMethodsGuideUpdatedJune2008.pdf. Accessed November 27, 2013
- Personal Social Services Research Unit. Unit costs of health and social care 2012. Canterbury, Kent. http://www.pssru.ac.uk/project-pages/unit-costs/2012/. Accessed November 27, 2013
- Dreyling M, Ghielmini M, Marcus R, et al; on behalf of the ESMO Guidelines Working Group. Newly diagnosed and relapsed follicular lymphoma: ESMO Clinical Practice Guidelines for diagnosis, treatment and follow-up. Ann Oncol 2011;22(6 Suppl):vi59-63
- Burke JM, van der Jagt RH, Kahl BS, et al. Differences in quality of life between bendamustine plus rituximab compared with standard first-line treatments in patients with previously untreated advanced indolent non-Hodgkin’s lymphoma or mantle cell lymphoma. Blood (ASH Annual Meeting Abstracts) 2012;120:abstract 155
- Federico M, Luminari S, Dondi A, et al. R-CVP versus R-CHOP versus R-FM for the initial treatment of patients with advanced-stage follicular lymphoma: results of the FOLL05 trial conducted by the Fondazione Italiana Linfomi. J Clin Oncol 2013;31:1506-13