
Abstract
Objectives:
The value of a health technology can be measured in terms of cost and benefit on two-dimensional co-ordinates. This study is to quantitatively analyze the correlation and to conduct a regression on the X-Y plane constituted by cost and QALYs (quality-adjusted life years) associated with the first line treatment, the maintenance treatment, and the second line treatment for non-small cell lung cancer (NSCLC).
Methods:
The cost-effectiveness data of the cost and QALYs were extracted, with respect to the three categories of the NSCLC treatment, from the CEA Registry at Tufts Medical Center, regarding the literature published from 2000–2011. As a result, 44 QALY-cost ratios were identified.
Results:
Based on those extracted data, the correlation and regression analyses were performed by mathematical model using log and square-root functions. The plotted ratios stratified by the three stages for the NSCLC treatment were visually grouped into three clusters. There were statistically significant differences among the correlation coefficients of the cluster. In regression, the log model was found to be better fitted than the square-root model; formulating QALY = −1.12 + 0.16 log(Cost), −1.99 + 0.28 log(Cost), and −0.69 + 0.10 log(Cost) for the first line, the maintenance, and the second line treatment, respectively. Monetary units were standardized to 2008 US dollars.
Conclusion:
A good methodological potential was confirmed so as to assess the Incremental Cost Effectiveness Ratio (ICER) variations, considering stratification by multiple factors such as disease and treatment categories. This study has certain limitations, such as the small number of included articles and the stratification, not reflecting a factor of new genetic findings.
Introduction
In Japan, cancer deaths are identified by an epidemiological data of cancer based on a complete survey in Japan Cancer Statistics. In 2011, approximately 357,000 persons died of cancer; approximately 1.5-times greater in men than in women. Lung cancer is ranked at the highest in men, with 23.8% of all the cancer deaths, followed by stomach cancer, with 15.4%, and liver cancer, 9.82%. The high incidence of lung cancer is also recognized in women, accounting for 13.5% of all cancer deaths, followed by stomach cancer with 11.8% and colon cancer with 10.8%Citation1.
On the other hand, according to the Ministry of Health, Labor and Welfare, the fiscal year 2010 Estimates of National Medical Care Expenditure (NMCE) in Japan were approximately 37.4 trillion yen, 3.9% increase (1.4 trillion yen) from 36.0 trillion yen in the previous fiscal year, and that figure of the NMCE amounted the record highest. Viewing by disease, the expenditures for cardiovascular diseases such as hypertension and myocardial infarction were the highest at 5.7 trillion yen, followed by those for neoplasm including cancer at 3.5 trillion yen, and those for respiratory diseases at 2.1 trillion yen. In particular, among the expenditures for neoplasm, those for malignant neoplasm of trachea, bronchus and lung were 381.1 billion yen, a 8.2% increase (31.3 billion yen) from 349.8 billion yen in the previous fiscal yearCitation2.
Amid these situations, the medical care system in Japan is in the midst of a significant transition period toward the aging societyCitation3. Furthermore, the system faces an urgent challenge to address the problem of skyrocketing medical care expenditures. Unfortunately, medical resources are not infinite. Therefore, it is required to use limited medical resources efficiently for improving quality-of-life (QoL) in patients without compromising the quality of healthcare. In other words, an explanation has been required on how much improvement of health can be achieved by medical care, as well as appropriateness of the healthcare costs in relation to its health benefits. That is, demand for assessment of healthcare technologies and the consensus to the society is globally increasing not only focused on medical effectiveness but on healthcare costsCitation3. Under these circumstances, where we inevitably have to consider economic efficiency in healthcare, it is important to evaluate the efficacy and cost-effectiveness of treatments comprehensively and to consider how to allocate the medical resources so as to maximize the resulting health benefits.
In this context, measuring the value of medical technology has become a key issue. A standard measure of the value of health technologies is cost-effectiveness, defined to be the cost (numerator) incurred by a technology divided by the health benefit (denominator) provided by the technologyCitation4,Citation5.
Health technology assessment (HTA) agencies evaluate medical therapies and technologies to inform coverage and reimbursement decisions based on value for payers. However, the scientific methods for assessment of the value are still in the course of evolution, especially regarding expensive cancer drugsCitation6, in which HTA agencies often confront special considerations on dilemma between affordability and patients demand. In Canada, for example, cancer treatments pay prominent attentions in press, and patients demand rapid coverage decision in government. The Pan-Canadian Oncology Drug Review does not publicly acknowledge using an explicit cost-effectiveness threshold, they allow one to reimburse some of expensive cancer drugs despite their relatively poor cost-effectiveness. In those cases, we find the cost-effectiveness ratios vary across different categories and stages of cancer, which remains a challenge to find a systematic way to scientifically interpret such diversity of the ratios. One of the systematic ways was proposed by Kamae et al.Citation7 in terms of regression analysis in the case of HIV prevention and treatment. Accordingly, our study intends to further investigate the potential applicability of regression analysis, seeking correlations and functional associations between cost and benefit in the case of lung cancerCitation8–10.
The National Institute for Health and Care Excellence (NICE) in the UK has used a single cost per QALY (quality-adjusted life-year) as the measure of cost-effectiveness of medical treatments for the past 10 years. Although NICE has not disclosed the exact single cost per QALY threshold in Great Britain Pounds (GBP), used as the reference for determination of eligibility of reimbursement for the medical technology appraised by NICE, the threshold of cost-effectiveness of the medical treatment is estimated to be GBP 20,000 to GBP 30,000 per QALY. This means that a reimbursement decision is made by using a single threshold and applying one appraisal theory for cost-effectiveness ratio, regardless of disease areas and treatment stagesCitation11.
Kamae et al.Citation7 investigated the distribution of QALY-cost ratios stratified by prevention stage, country of the study, and payer perspective, in the area of prevention and treatment for HIV/AIDS, utilizing the efficiency frontier (EF) approach based on regression analysis with the log and square-root modeling. They reported that stratification of HIV/AIDS interventions by prevention stage could yield distinct EF curves specific to each stage, and that the correlation and regression analyses were useful for parametrically characterizing the EF equations. In our study, it is investigated whether or not the same approach using the EF equations could be valid to interpret the correlation between cost and QALY in the context of treatments for NSCLC.
Materials and methods
Our study relied on cost-effectiveness estimates catalogued in the Tufts Medical Center Cost-Effectiveness Analysis (CEA) RegistryCitation12, a comprehensive database of healthcare cost-effectiveness analyses.
There were two objectives for this study: to review the published cost-effectiveness estimates for the first line treatment, maintenance treatment, and the second line treatment of NSCLC, thereby determining if the estimates can be stratified, using a scatter-plot method, by treatment stage for NSCLC we constructed; and to estimate equations using the log and the square-root models by performing correlation and regression analyses.
Step 1: Identify CE ratios
We identified a set of cost-effectiveness analyses catalogued in the Tufts CEA Registry satisfying the following selection criteria:
Publication ranged from 2000–2011;
The studies evaluated an intervention that treats individuals with NSCLC;
The studies reported the ratio’s numerator (cost) and denominator (QALYs gained) separately for both the intervention and the comparator (however, a study which reported the Incremental Cost Effectiveness Ratio (ICER) leading to cost-saving was excluded from our analysis); and
The first line treatment, the maintenance treatment, and the second line treatment of NSCLC were identified in the study (a study which reported smoking cessation program, CT screening, or supportive treatment should be excluded). Monetary units were standardized to 2008 US dollarsCitation11.
Step 2: Develop scatter-plots using graphical procedures
We constructed a scatter-plot of QALY-log (Cost) using costs and QALYs of treatments for NSCLC, with QALYs on the vertical axis and costs on the horizontal axis. Independent cost data, independent effectiveness data, and both cost and effectiveness data for the intervention and the comparator were used. In this scatter-plot of cost and effectiveness, however, the ratio’s numerator of cost and denominator of QALYs gained for the treatment of which the ICER lied to the northwest were excluded. That is, the studies which reported the ICER leading to cost-saving were excluded from our analysis.
Step 3: Develop a log model and a square-root model
We stratified QALY-cost ratios by treatment stage for NSCLC (first line treatment, maintenance treatment, and second line treatment), and performed correlation and regression analyses using the same approach proposed by Kamae et al.Citation7. We investigated the applicability of the log model for determining if a linear relationship exists between QALY and log (Cost) (equation (1), shown below). We also investigated the applicability of the square-root model for determining if a linear relationship exists between QALY2 and cost (equation (2), shown below). We assessed goodness-of-fit for these two regression models by measuring the Pearson correlation coefficient between QALY and log (Cost) and also between QALY2 and cost for the log model and the square root model, respectively, with the level of significance of 0.05. We analyzed the data using Microsoft Office Excel 2007 and Sma4 for WindowsCitation13.
where p = intercept and q = regression coefficient.
Results
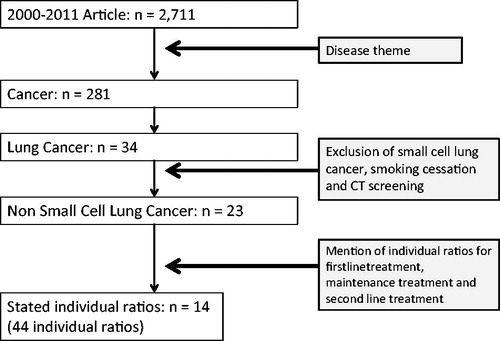
The search of the Tufts CEA Registry identified 2711 articles published from 2000–2011. Of these, 34 articles pertained to lung cancer treatments. A total of 44 QALY-cost ratios were identified in 14 articles according to the selection criteria shown above ().
Figure 1. Processes of the article extraction.
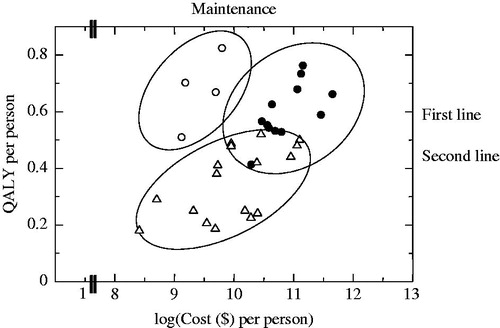
We constructed a two-dimensional scatter-plot using QALYs and log (Cost) for the 44 ratios of treatments for NSCLC (). The plot suggested that the data can be divided into at least three clusters; the first one which is along the vertical axis (maintenance treatment), the second one which is located in the northeast from the center of the plane (the first line treatment), and the third one that is close to the horizontal axis (the second line treatment).
Figure 2. Scatter plot and clusters for non-small cell lung cancer by treatment stage: log model. Eclipses express the clusters of QALY-cost ratios.
presents correlation coefficients and p-values for correlations between QALY and log (Cost) and between QALY2 and cost. The notation of QALY2 means QALY squared using equation (2). The correlation coefficients were statistically significant except for that between QALY2 and cost for the first line treatment.
Table 1. Correlation coefficients for cost and QALY data stratified by treatment stage.
We constructed scatter-plots of QALY and log (Cost) using the articles reporting treatments for NSCLC. Cost data and QALY data were grouped into a cluster by treatment stage for NSCLC. The correlation coefficients for each cluster were statistically significant. We developed a log model and a square-root model for each cluster of the first line treatment, maintenance treatment, and the second line treatment based on the correlation coefficients.
The correlations were found to exist except for the square-root model showing a correlation between QALY2 and cost for the first line treatment, demonstrating that the log model showing a correlation between QALY and log (Cost) is usefully applied to the first line treatment, maintenance treatment, and the second line treatment of NSCLC.
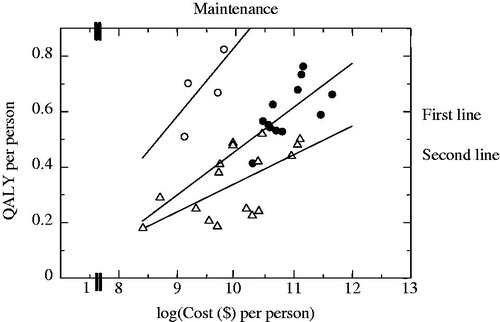
illustrates the regression equations generated using the log models for the first line treatment, maintenance treatment, and the second line treatment.
Figure 3. Three regression line plots for non-small cell lung cancer by treatment stage: log model. Equations used here are following: first line treatment: QALY = −1.12 + 0.16 log(Cost), maintenance treatment: QALY = −1.99 + 0.28 log(Cost), second line treatment: QALY = −0.69 + 0.10 log(Cost).
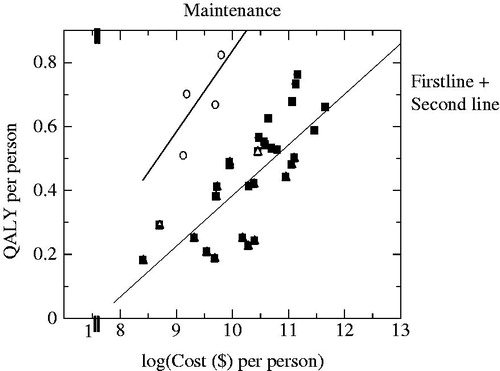
illustrates the regression equations generated using the log models for maintenance treatment and the combined group of both the first and second line treatments.
Figure 4. Two regression line plots for non-small cell lung cancer by treatment stage: log model. Equations used here are following: maintenance treatment: QALY = −1.99 + 0.28 log(Cost), first + second line treatment: QALY = −1.24 + 0.16 log(Cost).
In summary, the regression equations obtained by the log models were as follows for the first line treatment, maintenance treatment, the second line treatment, and the combined group of both the first and second line treatments:
First line treatment:
Maintenance treatment:
Second line treatment ion:
First + Second line treatment:
Discussion
We investigated the correlation between cost and benefit with QALY in the treatment for NSCLC, which was stratified by the first line, maintenance, and the second line categories. The observed correlation was subsequently formulated in terms of non-linear regression using log-function and square root function. Our regression model has four advantages;
The curve fitting for regression can consider uncertainty of a point estimate for QALY or cost. It could be a better alternative for the efficiency frontier which considers the point estimates only.
We assume that the QALYs have a distribution for the given cost, which was drawn from the work of EvansCitation14. He investigated a theoretic relationship between higher costs and better health outcomes based on a cost-benefit function assuming overall health outcomes on the cost axis, as shown in . More sophisticated work on the relation between the QALYs and costs was proposed by Van Hout et al.Citation15, which gave an analytic formula of 95% confidence ellipse and the interval of ICER based on the model using a joint normal distribution. Hoch et al.Citation16 proposed the formulation of the cost-effectiveness problem within a standard regression type framework, exploring the net-benefit statistics on the cost. Once a regression equation is obtained, the observed data of QALY can be regressed to the mean value of QALY for an observed cost. The residual error between an observed value and the predicted value (the mean) of QALY can be, either to the downside or to the upside, a manifestation of uncertainty inherent in measuring cost and benefit in the real world. As a result, correcting the observational error, we can make a correction of ICERCitation17, which is the ratio of the change in costs to incremental benefits of a therapeutic intervention or treatment, with the expression
, where C1 and C0 are observed estimates of cost for technology 1 and technology 0, respectively, and
The regression equation enables us to calculate the ICER between two points which exist at any location on the curve. This property gives us an imputation capability of estimating ICER for continuous change of the cost parameter.
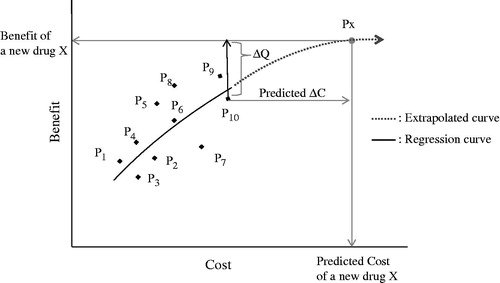
The extension of the regression equation makes it possible to extrapolate costs and benefits beyond the range of the observed data. Even if the price of a new drug is not yet determined (i.e., the cost for the new drug is unknown), and if the benefit such as gained QALY is known, the regression equation can provide with a predicted estimate for the expected QALY, by being extrapolated to the expected point of QALY. It could be potentially applied for value-based pricing as a future challenge ().
Figure 5. Extrapolation of regression curve: The horizontal line, higher by ΔQ (assumed known) than P10, determines Px at the point of intersection to the extrapolated curve. Then the vertical line from Px down to the x-axis determines the predicted cost of the new drug X, even if the price of X is not determined yet. Px, Point of a new drug X; P1, P2, … P10, Original points for regression. P10, Point of comparator for a new drug X; ΔQ, Gained benefit of a new drug X compared to the comparator P10; ΔC: Increased cost of a new drug X compared to the comparator P10.
Such advantages in the methodology are not completely unrelated to the decision-making on economic evaluations in the international HTA agencies. NICE in the UK established the ICER as an appropriate indicator of value. Although NICE has not disclosed the rigorous threshold with cost per QALY for the standard to make a reimbursement decision, the threshold for the decision is estimated to be GBP 20,000–GBP 30,000 per QALY. The current decision standard is determined by a concept of single common threshold, regardless of disease areas and treatment stagesCitation18. Our approach for the ICER evaluation of medical technologies is intended to provide decision-makers with flexibility to make judgments, considering multiple cost-per-QALY thresholds that progressively change alongside the regressed curve. Accordingly we suggest that the proposed method in this paper can enable us to evaluate various thresholds changeable in different categories such as disease areas or treatment stages.
We stratified QALY-cost ratios by treatment stage for NSCLC (first line treatment, the maintenance treatment and second line treatment) and performed correlation and regression analyses using the same approach proposed by Kamae et al.Citation7. We investigated the applicability of the log and square root model if a linear relationship exists between QALY and cost. We evaluated the goodness of fitting of each function by calculating the Pearson correlation coefficient on transformations of the data that should be linear under each model. In particular, for the log model, we estimated the correlation between QALY and log (Cost), and, for the square root model, we estimated the correlation between (QALY)Citation2 and cost. In correlation between QALY and log (Cost) case, the correlation coefficient was statistically significant, and the magnitude of the correlation coefficient was large. We constructed multiple cost-effectiveness equations for each treatment stage and for each treatment strategy in the clinical setting, which can be used to discuss how expensive technologies could be justified despite of a high value of ICER.
In recent cancer treatment, patients with cancer significantly get benefit from newly-developed health technologies such as molecular-targeted drugsCitation19. However, these technological advances are associated with a dramatic increase in costs of treatments for cancer which pose large economic burdens on the society, insurers, patients, and their familyCitation6. The high costs of cancer treatment have led to the situation, in the many countries, where some patients cannot receive reimbursement from insurers when a new drug used for cancer treatment does not meet the threshold to be socially accepted. Acknowledging the unique circumstances of end-of-life care, several countries have adopted special mechanisms of coverage decisions for cancer drugs, or more flexible decision criteria for reimbursementCitation20–22. For example, a Canadian study recently suggested that some cancer drugs are adopted at the highest threshold of acceptabilityCitation23. Even more recently, following a public debate over the coverage of four expensive drugs for treating metastatic renal cell carcinoma and after a brief consultation, UK NICE outlined a new approach to end-of-life drugs starting January 2009Citation2Citation4,Citation25. In the course of HTA for cancer treatment, the health policy for cancer is implemented separately from the other therapeutic areas. The health policy for cancer treatment intends to facilitate access to new drugs by making an exception for cancer patients. In the patients at the terminal stage or those with severe diseases, the exception policy means remaining a threshold method unchanged, which is still used for determining if the treatment value is worth the treatment costCitation20. Hence, the presence of this health policy for cancer treatment suggests that it is necessary to establish individual thresholds for each disease area and for each treatment stage.
Accordingly, one of the advantages of our method is that correlation and regression analyses on cost and effectiveness by treatment stage can propose a new approach to the evaluation of multiple ICERs, corresponding to the slope of the line connected between two points on the regression curve of cost and effectiveness.
Our study has certain limitations. The search of the Tufts CEA Registry identified 34 articles which pertained to lung cancer treatments. Of these, NSCLC treatment was identified in 23 articles. Finally, a total of 44 QALY-cost ratios was identified (first line treatment: 14, maintenance treatment: 8, and second line treatment: 22). The limited number of articles has led us to see that the results of this study should be verified regarding a larger number of articles. In recent cancer treatment, personalized medicine based on tumor genetic information has emerged along with the development of molecular-targeted drugs. For example of that, Echinoderm microtubule-associated protein-like 4 (EML4-ALK) fusion gene has been found to be expressed in ∼5% of patients with NSCLC, and efficacy of its inhibitor has been demonstratedCitation15. However, in our study, the stratification could not reflect such a new genetic finding, because of the still limited number of articles relevant to the EML4-ALK. If the number of cost-effectiveness analysis studies including tumor genetic information is increased in the future, the cost-effectiveness analysis for molecular-targeted drugs will be feasible, and it should be continuously discussed as a future challenge.
Conclusion
We quantitatively analyzed the correlation and regression between cost and QALYs in the cost-effectiveness analysis of treatments for NSCLC.
Data obtained was grouped into a cluster by treatment stage; each cluster consisted of the first line treatment, maintenance treatment, and the second line treatment. In correlations between QALY and log (Cost) case, the correlation coefficient was statistically significant, and the magnitude of the correlation coefficient was large. We constructed multiple cost-effectiveness equations for each treatment stage and for each treatment strategy in the clinical setting, which can be used to discuss how expensive technologies could be justified despite of the high value of ICER. Our findings suggested that our approach could justify high cost per a unit of clinical benefits often seen in recent expensive cancer drugs.
Transparency
Declaration of funding
The authors have no support or funding to report.
Declaration of financial/other relationships
Currently, N. Nakahara is an employee of Zimmer K.K., and I. Kamae is an employee of Health Technology Assessment and Public Policy Project, Graduate School of Public Policy, The University of Tokyo, and also The Canon Institute for Global Studies. N. Nakahara is also a research fellow in the Division of Medical Statistics, Department of Community Medicine and Social Healthcare Science, Kobe University Graduate School of Medicine, Japan, where I. Kamae works as a visiting professor.
Notice of Correction
The version of this article published online ahead of print on 29 May 2014 contained an error in the results section. The following sentence was introduced before the list of regression equations on page 5 “In summary, the regression equations obtained by the log models were as follows for the first line treatment, maintenance treatment, the second line treatment, and the combined group of both the first and second line treatments:” The error has been corrected for this version.
Acknowledgments
We express our appreciation to Dr Joshua T. Cohen and Dr Peter J. Neumann at the Center for the Evaluation of Value and Risk in Health, Tufts Medical Center, USA, for allowing us to access the CEA database, the Tufts CEA Registry.
References
- Cancer Statistics in Japan Editorial Board. Cancer Statistics in Japan. Tokyo, Japan: Foundation for Promotion of Cancer Research, 2012
- Statistics and Information Department, Minister's Secretariat, Ministry of Health, Labour and Welfare. National Medical Care Expenditure, 2010. Tokyo, Japan: Statistics and Information Department, Ministry of Health, Labour and Welfare, 2012
- Kamae I. Perspective of pharmacoeconomic approaches to health technology assessment (1) recent development in assessing innovation. Pharmaceut Med Device Regulatory Sci 2012;43:39-44. Japanese
- Grusenmeyer PA, Wong YN. Interpreting the economic literature in oncology. J Clin Oncol 2007;25:196-202
- Shih YC, Halpern MT. Economic evaluations of medical care interventions for cancer patients: how, why, and what does it mean? CA Cancer J Clin 2008;58:231-44
- Greenberg D, Earle C, Fang CH, et al. When is cancer care cost-effective? A systematic overview of cost-utility analyses in oncology. J Natl Cancer Inst 2010;102:82-8
- Kamae MS, Kamae I, Cohen JT, et al. Regression analysis on the variation in efficiency frontiers for prevention stage of HIV/AIDS. J Med Econ 2011;14:187-93
- Brown T, Pilkington G, Bagust A, et al. Clinical effectiveness and cost-effectiveness of first-line chemotherapy for adult patients with locally advanced or metastatic non-small cell lung cancer: a systematic review and economic evaluation. Health Technol Assess 2013;17:1–278
- Maher AR, Miake-Lye IM, Beroes JM, et al. Treatment of metastatic non-small cell lung cancer: a systematic review of comparative effectiveness and cost-effectiveness. Washington, DC: Department of Veterans Affairs (US), 2012
- Global Lung Cancer Coalition. Global Awareness of Lung Cancer Symptoms. Available at: http://www.lungcancercoalition.org/ja/pages/facts/types. Accessed Dec 2013
- Sculpher M, Claxton K. Sins of omission and obfuscation: IQWiG’s guidelines on economic evaluation methods. Health Econ 2010;19:1132-6
- Neumann PJ, Cohen JT. Center for the Evaluation of Value and Risk in Health. The Cost-Effectiveness Analysis Registry. [Internet]. Boston, MA: Institute for Clinical Research and Health Policy Studies. Tufts Medical Center. www.cearegistry.org. Accessed October 30, 2012
- Sma4 for Window. Tokyo, Japan: Vector Inc, 2013
- Evans RG. Strained mercy: the economics of Canadian Health Care. Toronto, Ontario, Canada: Butterworths, 1984
- van Hout BA, Al MJ, Gordon GS, et al. Costs, effects and C/E -ratios alongside a clinical trial. Health Econ 1994;3:309-19
- Hoch JS, Briggs AH, Willan AR. Something old, something new, something borrowed, something blue: a framework for the marriage of health econometrics and cost-effectiveness analysis. Health Econ 2002;11:415-30
- Folland S, Goodman AC, Stano M. Chapter 4: economic effiencey and cost-benefit analysis. The Economics of Health and Health Care. 6th edn. Boston, MA: Prentice Hall, 2010
- Raftery J. NICE and the challenge of cancer drugs. BMJ 2009;338:271-2
- Fukuoka M. Development of target drug and personalized therapy in lung cancer. Med Frontline 2010;65:327-34. Japanese
- Mason AR, Drummond MF. Public funding of new cancer drugs: is NICE getting nastier? Eur J Cancer 2009;45:1188-92
- Raftery JP. Paying for costly pharmaceuticals: regulation of new drugs in Australia, England and New Zealand. Med J Aust 2008;188:26-8
- Rocchi A, Menon D, Verma S, et al. The role of economic evidence in Canadian oncology reimbursement decision-making: to lambda and beyond. Value Health 2008;11:771-83
- Neumann PJ, Bliss SK, Chambers JD. Therapies for advanced cancers pose a special challenge for health technology assessment organizations in many countries. Health Affairs 2012;31:700-8
- Caplan AL. Will evidence ever be sufficient to resolve the challenge of cost containment? J Clin Oncol 2011;29:1946-8
- Rawlins M, Barnett D, Stevens A. Pharmacoeconomics: NICE's approach to decision-making. Br J Clin Pharmacol 2010;70:346-9