
Abstract
Objective:
To assess the effectiveness of managed care plans that limited access to infusion biologics via a step therapy policy.
Study design:
This was a retrospective cohort study using Symphony Health Solutions claims databases that included payer, prescription (Rx), diagnosis (Dx) and procedure (Px) information with unique anonymized patient identifiers.
Methods:
The percentage of patients with claims for infusion and subcutaneous (SQ) biologics were evaluated across three increasingly restrictive cohorts: (1) patients in step therapy plans versus all others in the database (population), (2) patients in step therapy plans versus patients that were members of plans that were roughly matched (matched) and (3) a subsample of patients that were members of step therapy plans that had sufficient data for a pre/post analysis (pre/post).
Results:
The population analysis comparison showed 5.1% fewer patients (p < 0.0001) with claims for infusion biologics among step therapy plans than among the overall plans. The more controlled matched and pre/post analyses showed a greater percentage of patients with claims for intravenous products in the plans with step therapy policies versus plans without step therapy policies, differences of +7.0% (p < 0.0001) and +2.8% (p = 0.0522), respectively.
Conclusions:
Policies designed to limit utilization of infusion biologics showed equivocal results. In the near term, the intended effects of implementing step therapy policies may be limited by relatively small numbers of patients that are affected relative to the total number of users.
Introduction
In 2010 US healthcare spending was estimated at $2.6 trillion, or about 18% of US gross domestic product (GDP)Citation1. This amount represented over $8400 annually for every AmericanCitation1. Spending on medication was $320 billion in 2011, accounting for approximately 12% of total healthcare spendingCitation2. In an attempt to curb the growing costs of medicines, managed care organizations and insurance plans have implemented a number of drug utilization controls. Step therapy (ST), one such control, requires members to use a ‘first step’ medication (frequently a generic) within a class before being eligible for a second medicationCitation3. The popularity of this approach is evident as 65% of commercial payers surveyed reported having one or more step therapy programs in 2012Citation4. Often these programs focus on specific, high cost disease areas, such as asthma and depressionCitation4. Step therapy programs are appealing because of the availability of lower cost generics, strong supporting clinical evidence for such programs, and the limitation of the programs’ effect to new medication users, which minimizes potential disruption for the wider patient populationCitation5. Given its popularity as a cost control technique, benefit managers are likely to continue to employ step therapy and broaden its application across a wide variety of therapeutic areas.
Step therapy policy assessments have been published for antidepressantsCitation6,Citation7, antihypertensivesCitation8,Citation9, anxiolyticsCitation10, antipsychoticsCitation11–14, nonsteroidal anti-inflammatory drugsCitation15, and proton pump inhibitorsCitation16,Citation17. A 2011 review of the step therapy literature described the results of 14 step therapy program evaluations covering both commercial and Medicaid populationsCitation5. The author concluded that “step therapy programs for therapy classes other than antipsychotics (e.g., antidepressants, antihypertensives, nonsteroidal anti-inflammatory drugs, and proton pump inhibitors) can provide significant drug savings through the greater use of lower-cost alternatives and, to a lesser extent, reduced drug utilization”. Financial implications for antipsychotic step therapy programs were less clear as results varied among published studies.
Since publication of this review, two subsequent studies of pregabalin have been publishedCitation18,Citation19. The first study evaluated a pregabalin step therapy restriction in a Medicare population and found that the step therapy restriction “was associated with increased disease-related pharmacy costs and decreased total medical costs; however, there was no net difference in total healthcare cost or total pharmacy cost”Citation18. The second study assessed the effect of a pregabalin step therapy restriction in a commercial population. Results showed lower pregabalin utilization associated with the step therapy restriction. However, the restriction did not result in reductions in total healthcare costs, medical costs, or pharmacy costsCitation19.
While step therapy policies have been shown to decrease pharmaceutical costs, several researchers have discussed potential unintended and undesirable consequences. Panzer et al.Citation10, for example, noted that SSRI medication costs were reduced by step therapy, but overall medical costs increased because of the number of therapy changes and patient discontinuation.
In an older publication, focused on step therapy, the authors raised concern that some step therapy approaches might add more in administrative and legal expenses than savings overall. The stated belief was that such programs may “defeat their purpose”Citation20. Another author noted that drug management tools must control medication appropriately, and not at the expense of patient outcomes or burdensome program administrationCitation21. More current publications have pointed out the need to balance cost control and the ability of patients and physicians to tailor therapy to patient needs and continue to reinforce the idea that the decision to use step therapy depends on the range in efficacy of the drugs available in the therapeutic classCitation22,Citation23. The literature highlights the complicated relationships between drug classes, effects on pharmaceutical versus total costs, and ethical considerations of restricting access.
Biologics are a challenge for managed care organizations because of their relative high costs compared to conventional non-biologic medications and the complexity of the diseases treated. According to Tu and SamuelCitation24, biologic utilization management “has focused on prior authorization and quantity limits, rather than on step-therapy approaches that are prevalent with conventional drugs”. Some biologics, unlike conventional drugs, are administered in medical offices and are covered under the medical benefit rather than the pharmacy benefit. Integration of the pharmacy and medical benefits to assess appropriate utilization may pose an organizational challenge to benefit managers looking to control costs.
Biologic treatment of auto-immune disorders like rheumatoid arthritis (RA) and inflammatory bowel disease (IBD) continues to increase. Biologic treatment in RA, for example, increased from 3% in 1999 to 26% in 2006Citation2 Citation5. A more recent analysis that used a 20% random sample of Medicare beneficiaries from 2007 to 2011 found a 47% increase per beneficiary in spending on specialty drugs from the beginning to the end of the study periodCitation26.
Treatment, including both subcutaneous injections and infused biologics, has been shown to improve symptoms, inhibit disease progression and improve physical function of RA patients.
Anecdotal evidence suggests that rheumatology practices have been increasingly exposed to patient health benefit plans that include step therapy policies for RA medications since the inception of such program in the late 90s. While not specific to step therapy, over 80% of plans in a 2011 US survey representing 50 plans that covered over 80 million lives indicated that they have prior authorization or step therapy policiesCitation27. Plans with step therapy policies attempt to influence the sequence of product use by targeting patients new to biologics and requiring the patient to fail on a subcutaneous product prior to approving infusion therapy.
Few studies have assessed the effect of drug utilization policies, particularly step therapy, on biologics. The objective of this research was to assess whether managed care policies that limited access to infusion biologics via a step therapy policy in order to shift patients to subcutaneous injection biologics (SQ) achieved a detectable effect on utilization.
Methods
This was a retrospective cohort study using data from Symphony Health Solutions (formerly Wolters Kluwer Source Rx and Medical) databases with data available for the time period of 1 January 2006 through 31 December 2011. The Symphony Health Solutions data included payer, prescription (Rx), diagnosis (Dx) and procedure (Px) information with unique anonymized patient identifiers associated with each claim. These data are obtained through claims clearinghouses and as such do not contain eligibility information which necessitates the use of proxies for eligibility (i.e., completeness of claims). The Symphony database was selected because it provided a unique opportunity to identify multiple plans which could be associated with known step therapy policies. The database is a de-identified, HIPAA (Health Insurance Portability and Accountability Act of 1996) compliant database, and as such, no institutional review board approval or patient consent was required.
Biologics were identified in pharmacy claims using National Drug Codes. Medically billed claims for biologics (i.e., claims submitted directly by physicians or medical facilities) were identified using Healthcare Common Procedure Coding System (HCPCS) codes. The biologic medications included infusion and SQ products. The infusion products were: abatacept, infliximab, rituximab and tocilizumab. The SQ products were: adalimumab, anakinra, certolizumab pegol, etanercept and golimumab.
Outcome
The primary outcome of interest was the percentage of patients with claims for infusion products out of the total number of patients with biologic claims.
Statistical analysis
The research questions addressed whether differences in the outcome between step therapy and non-step therapy plans were meaningful, directionally as expected and stable across the various cohort comparisons. The analysis focused on descriptive statistics and analyzed three increasingly restrictive and controlled cohorts: (1) patients in step therapy plans versus all others in the database (population), (2) patients in step therapy plans versus patients that were members of plans that were roughly matched to the step therapy plans (matched) and (3) a subsample of patients that were members of step therapy plans that had sufficient data for a pre/post analysis (pre/post). The analysis for the first two cohorts used one calendar year of data (2010). The analysis of the pre/post cohort set the date of the step therapy policy change as the analysis index date and used the 12 months before and after the index date as the comparison periods. Differences for the population and matched cohorts were tested using chi-square tests. The pre/post differences were tested with a McNemar’s test. No corrections were made for multiple tests.
Cohort identification
A list of managed health care organizations (comprising multiple health plans), their US State of operation, date of step policy plan implementation and claim volume was provided by the study sponsor. This list was matched to the data provider’s plan database to identify plans for which data were available. Sixteen managed care organizations consisting of 95 health plans were identified that had a step therapy program that began on or prior to 1 January 2010 and for which data were available.
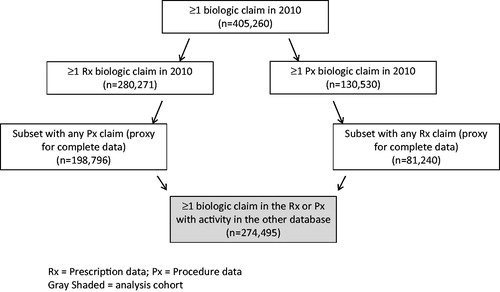
Cohorts were identified for three analyses labeled as: population, matched, and pre/post. A diagram of the process used to identify the population cohort is presented in . More than 400,000 patients with at least one biologic prescription in either the pharmacy (Rx) or medical benefit (Px) data were observed in 2010. To provide evidence that complete medical and pharmacy data were available patients were required to have at least one claim in both the Rx and Px databases. Patients with a biologic claim in the Rx database were required to have activity (i.e., any claim) in the Px database and patients with a biologic claim in the Px database were required to have activity (i.e., any claim) in the Rx database. The number of subjects with ≥1 biologic claim in the Rx or Px data with activity (any type) in the other database was 274,495. The population cohort was divided into patients that were members of step therapy plans versus patients that were not members of one of the 16 step therapy plans. The population cohort was the least well controlled, but largest sample.
Figure 1. Cohort identification for the policy change versus all other analysis.
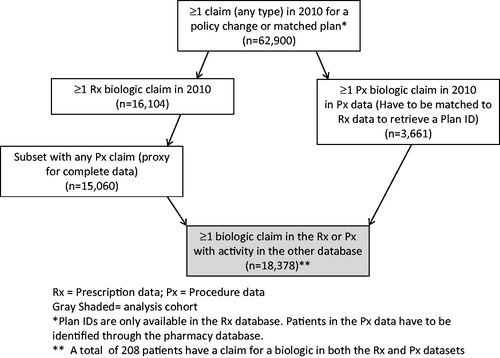
The second cohort was the matched cohort (). The 16 managed care organizations with a step therapy restriction were qualitatively matched to known non-step therapy organizations based on claim volume and region. Where possible similar types of plans were selected for the match; for example, if a Blue Cross plan was selected in the step therapy group a Blue Cross plan without a step therapy plan was selected. All patients with claims in the step therapy and matched plans were included using the same requirement of at least one claim in both databases. Plan information only existed in the pharmacy database; therefore patients with medical claims had to have Rx activity to establish plan membership. This cohort provided greater control of potential confounders, but with a substantially smaller sample. The number of subjects with ≥1 biologic claim in the Rx or Px data with activity (any type) in the other database was 18,378.
Figure 2. Cohort identification for the policy change versus matched plans.
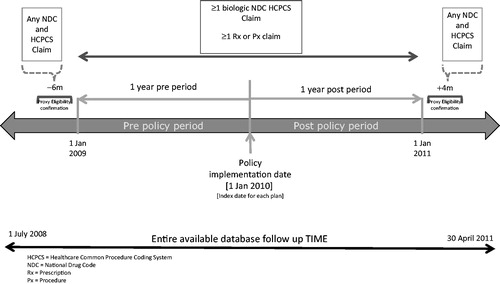
The pre–post analysis included data from four of the 16 managed care organizations that implemented a step therapy policy. Of the twelve plans eliminated, 10 had policy change dates that did not have sufficient longitudinal data for the 12 month pre–post policy change analysis given the date range of the available data, and two plans had too few biologic patients for meaningful interpretation (<10 patients in the time period of available data). The four plans included in the analysis had a step therapy implementation date (index date) of 1 January 2010 and biologic patients in these plans were followed for 12 months before and after this index date (). Patients included in the analysis had prescription and medical activity (≥1 claim) more than 1 year before and after the index date (i.e. proxy for complete claims) and had at least one biologic claim in the pre- or post-index periods. This cohort provided the smallest sample (n = 252) but a higher level of control of confounding since plans served as their own controls.
Figure 3. Pre–Post analysis inclusion/exclusion criteria and follow up time.
Results
Sixteen managed care organizations representing 95 health plans were identified with a step therapy policy. The population cohort consisted of 8098 patients in the step therapy group and 266,397 in the non-step therapy group. The population cohort had 3.3% more females than the policy change cohort and averaged 2.4 years older. The matched cohort compared the same 8098 patients to 10,280 patients from the matched plans. The matched cohort showed a closer age and gender distribution with only 1.6% more females and a lower average age (by 0.6 years) than the policy change cohort. For the pre–post cohort, subjects served as their own controls. The policy change cohort did not appear substantially different from any of the cohorts based on age and gender.
The only analysis to demonstrate a shift in patient utilization away from infusion biologics was the population analysis comparison, which was the least controlled of the three analyses (, ). This analysis showed 5.1% fewer patients with claims for infusion biologics among step therapy plans than among the overall plans (25.9% vs. 31.0%; p < 0.0001).
Figure 4. Percentage of patients with ≥1 infusion biologic claim by step therapy status and cohort.
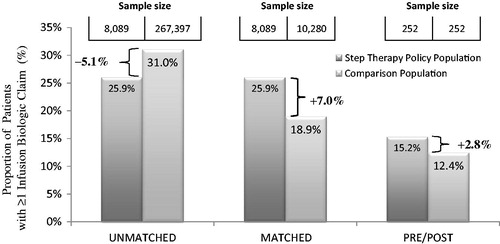
Table 1. Definition of step therapy (ST) plans and comparison cohorts and resulting effect on use of infusion products.
When observing biologic use among matched vs. step therapy plans, infusion biologic use was higher in the step therapy than matched plans, 25.9% vs. 18.9% (p < 0.0001; ).
There were four step therapy policy plans included in the pre–post analysis that evaluated 365 days (four quarters) before and after the policy change analysis. A total of 252 patients were identified as having a claim for a biologic at some time during the 2 year pre and post (inclusive) observation window and met proxy eligibility requirements (at least one claim more than a year before and after the index date). Results demonstrated the majority of these patients were on biologic therapy in the first quarter of observation (range by plan 66.1% to 81.2%). Patients stabilized on infusion therapy are not likely to switch to a new SQ treatment. Therefore, the opportunity to make changes to therapy choice is limited to a relatively small group of patients, likely those newly diagnosed or new to the plan.
The percentages of patients with infusion claims before and after the policy change date were 12.4% and 15.2%, respectively, a difference of +2.8% (, ). At the available sample size there was no detectable effect (p = 0.0522). A detectable effect would have been expected if the step therapy program was effective in driving utilization toward SQ products.
Limitations
There is an inherent weakness in using clearinghouse data for this type of assessment. However, this data source represented one of the few sources where plans with step therapies could be identified and compared to plans with no evidence of step therapy restrictions. The data are not assumed to provide causal evidence of an effect or lack of effect, but rather are intended to assess the potential for an effect at a population level. The assumption was that if the step therapy program was having a substantial effect on utilization of infusion products that it might result in a detectable effect in these samples.
Completeness of data had to be established based on the claims data as opposed to actual plan eligibility data. The degree to which the data are complete between the medical and pharmacy data are unknown. The database only captures medical claims that are filed through the participating clearinghouses. The number of patients receiving products billed through medical claims (i.e., infusions) is likely to be lower than actual practice. However, the relative changes from pre to post observed in this analysis should be relevant even if the share of patients may be underestimated for infusion products since there were no changes in claims data capture within the database that would have affected the medical claims data differently from the rest of the population.
The medical procedure data (Px) does not have a plan indicator. Thus, for the analysis of the Px data patients were categorized by all plans from which they had a claim in 2010. If a patient had any claim activity during the year for a policy claim plan they were considered to be a policy change patient and all of their claims for 2010 were assumed to have been potentially affected by being a member of the policy change plan.
This analysis used all biologic prescriptions; however, the plans with step therapy programs were identified based on presence of an RA step therapy policy. This may have affected the magnitude of the effect that was observed.
It is possible that the results are confounded by unmeasured variables. Plans in the comparison groups may have other reimbursement limitations or case mix differences with regard to diagnosis. It is also possible that the biologics were used for various indications. It is noteworthy that because of the timing of this analysis the newer agents (certolizumab, tocilizumab, anakinra, and golimumab) accounted for 6% or fewer patients in the population and matched analyses and less than 3% of the pre–post analysis cohort.
This was an exploratory analysis that attempted to evaluate whether the effect of step therapy programs was sufficient to overcome these unmeasured variables using a large population. The use of the three cohorts was to provide increasing levels of control of potential confounding variables to the extent allowed within the limitations of the data.
Discussion
Step therapy policies were originally designed to create a medication treatment path in an environment with multiple perceived therapeutically similar options. In this situation step therapy policies appear logical and allow plans to mitigate the influence of promotion on their formulary budget. In the case of biologic agents used to treat RA or IBD there are no generically equivalent choices. The choices available are largely grouped based on route of administration, either subcutaneous or intravenous (infusion). These two choices tend to create an inherent selection bias since healthcare providers and patients will naturally choose the least complex choice that will provide appropriate therapy for patients. Therefore, a logical step therapy policy is already in place with the providers choosing the simplest therapy to administer that will provide the desired outcome in their patients. This effect may be counter-balanced by potential income a rheumatologist might receive from providing infusion services. Adding a forced step therapy policy in this environment may simply delay a provider’s therapy choice, supplying suboptimal care and incurring any added expense a delay in the preferred treatment might cause. As the results in this analysis suggest, it may be difficult to find any short term benefit to step therapy policies in this therapeutic category. Furthermore, given the potential length of time that might be needed to detect a benefit it is possible that newer, more cost-effective treatments may emerge before significant cost savings are achieved.
One of the reasons for the popularity of step therapy is its effect on new medication users, rather than disrupting patients already controlled on an existing productCitation5. This is consistent with our findings from the pre–post analysis that showed 60–80% of the patients on biologic therapy were already established on a medication and only a small percentage of patients were newly diagnosed. In relatively small disease states, the opportunity to affect cost may be limited to a small segment of the population with the disease. This could be even more significant within small plans where the total number of biologic patients may be relatively few. Implementation of a step therapy plan could take several years to accrue any significant cost saving within a drug budget silo.
While drug costs are a concern, rheumatoid arthritis patients desire the best treatment available to prevent further physical damage and debility. Managed care organizations want to use sound economic programs, like step therapy, to optimize patient care while minimizing cost. At the same time they want to avoid potential undesired consequences such as treatment discontinuation. Given the potential administrative burden of developing and administering step therapy policies for biologics, it is important to assess these administrative costs in lieu of the apparently limited per member per month (PMPM) savings associated with first line SQ biologic use.
Step therapy policies appear well suited for newly diagnosed patients in broad based populations with medical conditions like depression, hypertension and asthma. However, its utility in specialty areas (e.g., RA or IBD) will need to be considered versus its potential outcomes. Our study examined the drug utilization component of care only. Results suggest that step therapy policies are not likely to have a major effect on overall infusion usage in the near term. Newly diagnosed patients will likely be directed to use SQ products in a stepwise fashion before using infusion biologics. However, managed care organizations will have to weigh the potential cost savings in the broader context of patient management and determine whether the potential cost savings warrant the additional policy development and management time required to develop and administer the policies.
Conclusions
Policies designed to limit utilization of medical benefits (such as infusion biologics) showed equivocal results. In the near term, the intended effects of implementing step therapy policies may be limited, in the best case scenario, by relatively small numbers of patients that are affected relative to the total number of users. These data suggest that policies intended to restrict product choice for patients requiring a biologic therapy have relatively little effect on the proportion of patients receiving infusion biologics. The cost of implementing and maintaining these programs needs to be balanced against the potential for savings.
Transparency
Declaration of funding
This study was funded by Janssen Scientific Affairs LLC.
Declaration of financial/other relationships
C.M.K. has disclosed that she/he is supported by a grant from EMD Serono Inc. A.P. has disclosed the he is supported by a grant from Janssen Scientific Affairs. M.I. and L.E. have disclosed that they are employees of Janssen Scientific Affairs and are shareholders of Johnson & Johnson.
JME peer reviewers on this manuscript have no relevant financial or other relationships to disclose.
Acknowledgments
Lavonda Miley of Miley Consulting provided medical writing assistance with funding from CK Consulting Associates, LLC. Previous presentations: Ingham MP, Paris A, Ellis L, Kozma CM. Effectiveness of step therapy policies for specialty pharmaceuticals in immune disorders. Poster presentation at the 16th Annual International Society for Pharmacoeconomics and Outcomes Research Meeting, 23 May 2011, Baltimore, MD, USA. Ingham MP, Paris A, Ellis L, Kozma CM. Three approaches to evaluating step therapy policies for immune disorder specialty pharmaceuticals. Poster presentation at the 2013 American College of Rheumatology meeting, 27 October 2013, Baltimore, MD, USA.
References
- U.S. Health Care Spending: The Big Picture. National Institute for Health Care Management Foundation Data Brief. May 2012. Available at: http://nihcm.org/images/stories/Data_Brief_1_-_Big_Picture_FINAL.pdf (Last Accessed 4/7/2015)
- The Use of Medicines in the United States: Review of 2011. IMS Institute for Healthcare Informatics. Healthcare. Available at: https://www.imshealth.com/ims/Global/Content/Insights/IMS%20Institute%20for%20Healthcare%20Informatics/IHII_Medicines_in_U.S_Report_2011.pdf (Last Accessed 4/7/2015)
- Gleason PP. Assessing step-therapy programs: a step in the right direction. J Manag Care Pharm 2007;13:273-5
- Pharmacy Benefit Management Institute. 2012–2013 Prescription drug benefit cost and plan design report. Available at: https://www.pbmi.com/shop/prescription-drug-benefit-cost-and-plan-design-reports/2012-2013-prescription-drug-benefit-cost-plan-design-report/ (Last Accessed 4/7/15 registration required)
- Motheral BR. Pharmaceutical step-therapy interventions: a critical review of the literature. J Manag Care Pharm 2011;17:143-55
- Mark RL, Gibson TM, McGuigan K, Chu BC. The effects of antidepressant step therapy protocols on pharmaceutical and medical utilization and expenditures. Am J Psychiatry 2010;167:1202-9
- Dunn JD, Cannon E, Mitchell MP, Curtiss FR. Utilization and drug cost outcomes of a step-therapy edit for generic antidepressants in an HMO in an integrated health system. J Manag Care Pharm 2006;12:294-302
- Mark TL, Gibson TB, McGuigan KA. The effects of antihypertensive step-therapy protocols on pharmaceutical and medical utilization and expenditures. Am J Manag Care 2009;15:123-31
- Yokoyama K, Yang W, Preblick R, Frech-Tamas F. Effects of a step-therapy program for angiotensin receptor blockers on antihypertensive medication utilization patterns and cost of drug therapy. J Manag Care Pharm 2007;13:235-44
- Panzer PE, Regan TS, Chiao E, Sarnes MW. Implications of an SSRI generic step therapy pharmacy benefit design: an economic model in anxiety disorders. Am J Manag Care 2005;11(12 Suppl):S370-9
- Lu CY, Soumerai SB, Ross-Degnan D, et al. Unintended impacts of a Medicaid prior authorization policy on access to medications for bipolar illness. Med Care 2010;48:4-9
- Zhang Y, Adams AS, Ross-Degnan D, et al. Effects of prior authorization on medication discontinuation among Medicaid beneficiaries with bipolar disorder. Pyschiatr Serv 2009;60:520-7
- Soumerai SB, Zhang F, Ross-Degnan D, et al. Use of atypical antipsychotic drugs for schizophrenia in Maine Medicaid following a policy change. Health Aff (Millwood) 2008;27(3):w185-95. Epub 2008 Apr 1
- Farley JF, Cline RR, Schommer JC, et al. Retrospective assessment of Medicaid step-therapy prior authorization policy for atypical antipsychotic medications. Clin Ther 2008;30:1524-39
- Motheral BR, Henderson R, Cox ER. Plan-sponsor savings and member experience with point-of-service prescription step therapy. Am J Manag Care 2004;10(7 Pt 1):457-64
- Delate T, Mager DE, Sheth J, Motheral BR. Clinical and financial outcomes associated with a proton pump inhibitor prior-authorization program in a Medicaid population. Am J Manag Care 2005;11:29-36
- Cox ER, Henderson R, Motheral BR. Health plan member experience with point-of-service prescription step therapy. J Manag Care Pharm 2004;10:291-8
- Suehs BT, Louder A, Udall M, et al. Impact of a pregabalin step therapy policy among medicare advantage beneficiaries. Pain Pract 2014;14(5):419-26. Epub 2013 May 23
- Udall M, Louder A, Suehs BT, et al. Impact of a step-therapy protocol for pregabalin on healthcare utilization and expenditures in a commercial population. J Med Econ 2013;16:784-92
- Burton SL, Randel L, Titlow K, Emanual EJ. The ethics of pharmaceutical benefit management. Health Affairs 2001;20:150-63
- Goldman DP, Joyce GF. Moving towards better formulary management. Am J Manag Care 2005;11:13-14
- Nayak RK, Pearson SD. The ethics of ‘fail first’: guidelines and practical scenarios for step therapy coverage policies. Health Aff (Millwood) 2014;33:1779-85
- Vogt WB, Joyce G, Xia J, et al. Medicaid cost control measures aimed at second-generation antipsychotics led to less use of all antipsychotics. Health Aff (Millwood) 2011;30:2346-54
- Tu HT, Samuel DR. Limited options to manage specialty drug spending. Res Brief 2012;22:1-13
- Yazici Y, Shi N, John A. Utilization of biologic agents in rheumatoid arthritis in the United States: analysis of prescribing patterns in 16,752 newly diagnosed patients and patients new to biologic therapy. Bull NYU Hosp Jt Dis 2008;66:77-85
- Trish E, Joyce G, Goldman DP. Specialty drug spending trends among Medicare and Medicare Advantage enrollees, 2007–11. Health Affairs 2014;33:2018-24
- Greenapple R. Trends in biologic therapies for rheumatoid arthritis: results from a survey of payers and providers. Am Health Drug Benefits 2012;5:83-92