
Abstract
Objective To compare the cost-utility of the glucagon-like peptide-1 receptor agonist albiglutide with those of insulin lispro (both in combination with insulin glargine), insulin glargine, and the dipeptidyl peptidase-4 inhibitor sitagliptin, representing treatments along the type 2 diabetes treatment continuum.
Methods The Centre for Outcomes Research and Effectiveness (CORE) Diabetes Model was used for the cost-utility analysis. Data from three Phase 3 clinical trials (HARMONY 6, HARMONY 4, and HARMONY 3) evaluating albiglutide for the treatment of patients with type 2 diabetes were used for the baseline characteristics and treatment effects. Utilities and costs were derived from published sources.
Results Albiglutide treatment was associated with an improvement in mean quality-adjusted life expectancy of 0.099, 0.033, and 0.101 years when compared with insulin lispro, insulin glargine, and sitagliptin, respectively. Over the 50-year time horizon, mean total costs in the albiglutide arm were $4332, $2597, and $2223 more than in the other respective treatments. These costs resulted in an incremental cost-utility ratio of $43,541, $79,166, and $22,094 per quality-adjusted life-year (QALY) gained for albiglutide vs insulin lispro, insulin glargine, and sitagliptin, respectively. At a willingness-to-pay threshold of $50,000 per QALY gained, there was a 53.0%, 41.5%, and 67.5% probability of albiglutide being cost-effective compared with the other respective treatments.
Limitations This analysis was an extrapolation over a 50-year time horizon based on relatively short-term data obtained during clinical trials. It does not take into account potential differences between the respective treatments in adherence and persistence that can influence both effects and costs.
Conclusions Albiglutide represents a reasonable treatment option for patients with type 2 diabetes based on its cost-utility, relative to insulin lispro, insulin glargine, and sitagliptin.
Introduction
Diabetes in the US represents a significant economic burden, with estimated total costs of $245 billion in 2012, including $176 billion in direct medical costsCitation1. The largest components of these medical costs were hospital inpatient care (43%), prescription medications to treat complications of the disease (18%), and antidiabetic agents and diabetes supplies (12%)Citation1.
Because type 2 diabetes is a chronic, progressive disease, it is associated with increasing treatment intensity and long-term complications that result in a significant financial burden for the patientCitation2,Citation3. Lifetime direct medical costs for treating type 2 diabetes for patients diagnosed at the ages of 45–54 years are estimated to be $106,200 for men and $110,400 for womenCitation3. These costs encompass those for treating type 2 diabetes-associated complications, such as coronary heart disease and nephropathy; and diabetes management, including medications, physician visits and self-monitoring of blood glucose. Additionally, treatment of hypoglycemia, a potential risk associated with medications for type 2 diabetes, particularly insulin, also represents a significant cost burdenCitation2,Citation4.
Although there are a number of approved agents available for the treatment of type 2 diabetes, patients continue to have trouble reaching and maintaining targets for glycemic controlCitation2,Citation5. Since 2006, incretin-based therapies, such as the injectable glucagon-like peptide-1 receptor agonists (GLP-1RAs) and oral dipeptidyl peptidase-4 inhibitors, have been introducedCitation2,Citation5. Currently, three GLP-1RAs are approved in the US for once-weekly (QW) administration: albiglutide (TanzeumFootnote†), exenatide extended-release (BydureonFootnote‡), and dulaglutide (TrulicityFootnote§§)Citation6–8.
The GLP-1RA class is the most expensive diabetes class of medications in terms of annual costsCitation9,Citation10. From 2008–2012, the total (payer and patient) average annual cost per person for GLP-1RAs rose 75% from $1224 to $2143Citation9. In comparison, the average annual cost of providing pharmaceutical care for diabetes increased from $667 to $741 (11%) in the same periodCitation9. In 2014, annual Wholesale Acquisition Costs of QW GLP-1RAs ranged from ∼$4200 for albiglutide to $6300 for dulaglutideCitation10. The consequence of this high cost is that some payers question the value of GLP-1RAs and are denying coverage for some agents of this classCitation11. Given these high costs and concerns expressed by managed care organizations, the cost-utility of new GLP-1RAs relative to other agents warrants investigation. Furthermore, managed care organizations typically look at the short-term perspective, whereas in diabetes, treatment is given to prevent negative outcomes that occur later in the patient’s life. Therefore, a long-term perspective is needed to assess the value of diabetes treatment.
Presented is a cost-utility analysis comparing albiglutide to relevant comparators at different stages of type 2 diabetes disease: failure of first-line oral therapy, type 2 diabetes requiring basal insulin, and type 2 diabetes requiring prandial as well as basal insulin. Data from 3 Phase 3 studiesCitation12–14 that were designed to reflect real-world practice patterns as far as possible showed that albiglutide treatment was non-inferior to insulin lispro (both in combination with insulin glargine) treatment (p < 0.0001) and insulin glargine treatment (p = 0.0086), and superior to sitagliptin treatment (p < 0.0001) in terms of lowering HbA1c, whereas body mass index (BMI) and hypoglycemic events were reduced with albiglutide treatment relative to either insulin treatment.
Research design and methods
Model methodology
The Centre for Outcomes Research (CORE) Diabetes Model, developed by Palmer et al.Citation15, was used for the cost-utility analyses. This model is a validated, interactive Markov-based computer model designed to evaluate the long-term health outcomes and economic consequences of interventions in patients with type 1 or type 2 diabetesCitation15,Citation16.
The model is composed of 16 sub-models that simulate non-specific mortality and the major complications of diabetes, including cardiovascular disease, stroke, neuropathy, eye disease, nephropathy and end-stage renal disease, lactic acidosis, ketoacidosis, hypoglycemia, foot ulcer, and amputation. Each sub-model has a semi-Markov structure that uses transition probabilities derived from published sources and indexed by time, state, time-in-state, and diabetes type (all type 2 diabetes in the present analysis). Monte Carlo simulation using tracker variables is employed to overcome the memory-less properties of the standard Markov model and allows interconnectivity and interaction between individual complication sub-models.
The progression of diabetes over the 50-year time horizon was individually simulated for a cohort of 1000 hypothetical patients. This was then repeated for 1000 cohorts (first-order Monte Carlo simulation) to produce a joint distribution of incremental costs and effectiveness, which were plotted and from which cost-acceptability curves were derived by calculating the likelihood of albiglutide being cost-effective over a range of willingness-to-pay thresholds. Long-term outcomes evaluated for each analysis using the CORE Diabetes ModelCitation15,Citation16 were life expectancy, quality-adjusted life expectancy, cumulative incidence of diabetes-related complications, time to onset of diabetes-related complications, and direct medical costs.
Simulation cohorts
This study evaluated the cost-utility of albiglutide relative to a comparator treatment from latest to earliest stage of the treatment paradigm; insulin lispro (HumalogFootnote†), in combination with insulin glargine; insulin glargine (LantusFootnote‡); and the dipeptidyl peptidase-4 inhibitor sitagliptin (JanuviaFootnote§), for the treatment of patients with type 2 diabetes in the US. These three agents were selected for comparison because they are not available as generic medications and are included in treatment guidelines at similar stages of therapy as GLP-1RAsCitation2,Citation5. Separate ethical approval for this study was not required as modeling was based on results from primary studies conducted with institutional review board approval.
For each comparison, a simulated cohort of patients was defined using the baseline characteristics from three Phase 3 studies of albiglutide in patients with type 2 diabetes: HARMONY 6Citation12, HARMONY 4Citation13, and HARMONY 3Citation14 (). HARMONY 6 (NCT00976391) was a 52-week, randomized open-label study with a 26-week primary end-point that compared the safety and efficacy of albiglutide to insulin lispro, both in combination with insulin glargine, in patients whose disease was inadequately controlled with intermediate- or long-acting insulinCitation12. HARMONY 4 (NCT00838916) was a 3-year, randomized open-label study with a 52-week primary end-point that compared the safety and efficacy of albiglutide with that of insulin glargine in patients whose disease was inadequately controlled on metformin with or without sulfonylureaCitation13. HARMONY 3 (NCT00838903) was a 3-year, randomized double-blind, parallel-group study with a 104-week primary end-point that compared the efficacy and safety of albiglutide to sitagliptin, glimepiride and placebo in patients whose disease was inadequately controlled with metforminCitation14. In HARMONY 6 and 4, patients in the insulin lispro and insulin glargine treatment groups had their respective insulin treatment initiated as per standard of care at the study siteCitation12,Citation13. Adjustments were made for the respective insulin treatment based on the average of the 2 previous days’ home blood glucose monitoring resultsCitation12,Citation13.
Table 1. Baseline cohort characteristics* Citation12–14,Citation17,Citation18.
Baseline characteristics for smoking and alcohol consumption were based on data from the US Centers for Disease Control and Prevention and the National Institute on Alcohol Abuse and Alcoholism, respectivelyCitation17,Citation18.
Treatment effects, safety, and summary of modifiable inputs
Treatment effects and adverse event rates were obtained using pre-rescue, intent-to-treat data from the respective clinical trials ()Citation12–14. For the HARMONY 6, 4 and 3 analyses, data were used from the primary end-point (reduction in HbA1c) times of 26, 52, and 104 weeks, respectivelyCitation12–14. The base-case time horizon was 50 years in all comparisons.
Table 2. Treatment effects associated with albiglutide and comparators*† Citation12–14.
Treatment strategies and time between treatment switches and intensifications were based on previous published studies for albiglutideCitation12–14 along with clinician guidance and assumptions derived from prior diabetes health economic modeling workCitation19–21. Following application of the initial treatment effects, patients were ultimately switched to a basal-bolus insulin treatment for the remainder of the simulation. In the comparison with insulin lispro, patients in the albiglutide/insulin glargine arm were assumed to take albiglutide 30 mg QW (uptitrated to albiglutide 50 mg QW) plus insulin glargine 53.2 IU once daily (QD) for 3 years and then switched to a basal-bolus insulin treatment of insulin glargine 50.6 IU QD plus insulin lispro 30.6 IU QD for the remainder of the 50-year time horizon. Patients in the comparator arm were assumed to take insulin glargine 50.6 IU QD plus insulin lispro 30.6 IU QD for the duration of the 50-year time horizon with no treatment switching at any stage of the analysis.
In the comparison with insulin glargine, patients in the albiglutide arm were assumed to take albiglutide 30 mg QW (with a majority selecting the option to uptitrate to 50 mg QW) for 3 years followed by insulin glargine 35.1 IU QD for 1 year, before switching to basal-bolus therapy. Patients in the comparator arm were assumed to take insulin glargine 35.1 IU QD for 4 years before switching to basal-bolus insulin.
In the comparison with sitagliptin, patients in the albiglutide arm were assumed to take albiglutide 30 mg QW (with a majority selecting the option to uptitrate to 50 mg QW) for 2 years; and patients in the comparison arm were assumed to take sitagliptin 100 mg QD for 2 years. In both study arms, it was assumed that the study medication was replaced by insulin glargine 35.1 IU QD in year 3 of treatment and then basal-bolus insulin in year 4 of the analysis.
Long-term modeling used commonly accepted approachesCitation15,Citation22,Citation23. HbA1c and systolic blood pressure (SBP) progressions in all analyses followed the UK Prospective Diabetes Study panel regression models, whereas serum lipids (total cholesterol, HDL cholesterol, LDL cholesterol and triglycerides) followed the CORE Diabetes Model default progressions based on the Framingham Heart StudyCitation15,Citation22,Citation23. BMI progression in all analyses assumed the albiglutide arm to converge to the comparator arm at the point when both arms were on similar treatments (at the start of year 4 in the comparisons with insulin lispro and with insulin glargine and at the start of year 3 in the comparison with sitagliptin) and remain level thereafter. Mortality data were obtained from the Global Health Observatory Data Repository of the World Health OrganizationCitation24.
Utilities and costs
Health state utilities used in the modeling analysis were derived from previously published studies ()Citation15,Citation25–28. Costs of study medication and concomitant oral antidiabetic medications were calculated based on doses and medications used in the respective clinical studiesCitation12–14, whereas blood glucose monitoring costs were based on previous reportsCitation29. Dosages used were as follows: albiglutide 30 and 50 mg QW; insulin glargine 35.1 IU QD and 50.6 IU QD (in combination with insulin lispro) or 53.2 IU QD (in combination with albiglutide); insulin lispro 30.6 IU QD; metformin 1000 mg QD; sitagliptin 100 mg QD. All costs of diabetes-related complications (), except for laser treatmentCitation30 and prosthesis following amputationCitation31, were based on the study by Yeaw et al.Citation32. When necessary, costs were inflated to 2014 values using the Consumer Price Index from the Bureau of Labor StatisticsCitation33.
Table 3. Health status utilities used in the modeling analysisCitation15,Citation25–28.
Table 4. Cost input associated with diabetes-related complications and medications used in the base-case analysis* Citation32.
Sensitivity analyses
Because of the uncertainty associated with extrapolating clinical results by modeling long-term consequences, one-way sensitivity analyses were performed on key parameters to assess the robustness of the base-case findings. Alternative assumptions were investigated for time horizon (5, 10, and 20 years), discount rates (0% and 6%), cost of complications (10% increase or decrease), ethnicity (based on 2012 data from the US Census BureauCitation34), and drivers of clinical benefit (albiglutide treatment effect on HbA1c, SBP, serum lipids, and BMI set to equivalence with the comparator). Sensitivity analysis was also performed around the disutility (negative impact on health-related quality-of-life) associated with minor hypoglycemia: in the base-case analyses, a disutility decrement of −0.0035 per minor event was usedCitation27, whereas the sensitivity analyses used data derived from Marrett et al.Citation35, in which the adjusted EuroQol-5D (EQ-5D) score decrement over a 6-month period for a single mild hypoglycemic event was −0.01.
Probabilistic sensitivity analyses were conducted around the base case, with sampling from distributions defined by the standard deviations (SD) of baseline cohort characteristics and treatment effects in and , respectively.
Results
Albiglutide vs insulin lispro (both combined with insulin glargine)
Base-case analysis
Over the 50-year time horizon, albiglutide plus insulin glargine treatment resulted in an improvement in mean life expectancy of 0.099 years compared with insulin lispro plus insulin glargine (13.345 years; SD = 0.178 vs 13.247 years; SD = 0.172), mean quality-adjusted life expectancy by 0.099 years (8.707 years; SD = 0.119 vs 8.608 years; SD = 0.117), and diabetes-related complications ( and ). During the 50-year time horizon, mean total cost in the albiglutide plus insulin glargine arm was $4332 more than in the insulin lispro plus insulin glargine arm, with an incremental cost-effectiveness ratio (ICER) of $43,541 per quality-adjusted life-year (QALY) gained ( and ).
Figure 1. Scatter plots of incremental cost vs incremental effectiveness for albiglutide vs comparator. (a) Albiglutide plus insulin glargine vs insulin lispro plus insulin glargine; (b) albiglutide vs insulin glargine; (c) albiglutide vs sitagliptin. QALY, quality-adjusted life-year; USD, US dollars.
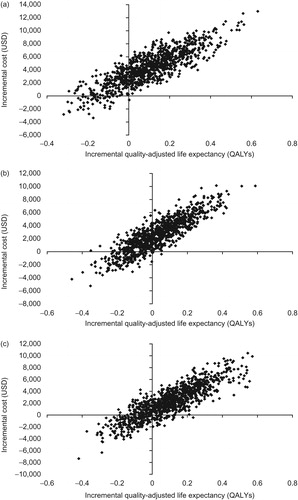
Table 5. Modeled long-term clinical outcomes and costs associated with albiglutide vs comparators* †.
Table 6. Cumulative modeled incidence of diabetes-related complications with albiglutide and comparators.
Sensitivity analysis
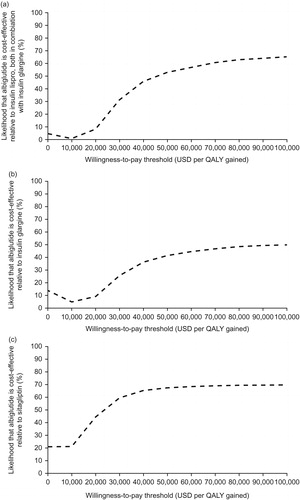
For patients in the albiglutide plus insulin glargine arm, at a willingness-to-pay threshold of $50 000 per QALY gained, there was a 53.0% probability of cost-utility compared with insulin lispro plus insulin glargine (). The probability increased to 65.0% at a threshold of $100,000 per QALY gained.
Figure 2. Cost-utility acceptability curves for albiglutide vs comparators. (a) Albiglutide plus insulin glargine vs insulin lispro plus insulin glargine; (b) albiglutide vs insulin glargine; (c) albiglutide vs sitagliptin. QALY, quality-adjusted life-year; USD, United States dollars.
In the one-way analysis, a noteworthy impact on ICER relative to the base-case analysis was seen when the time horizon decreased from 50 years (in the base-case) to 5 years, with the ICER increasing to $133 234 per QALY gained (). Additionally, a substantial decrease in ICER to $8777 per QALY gained was observed when a greater hypoglycemia disutility decrement value was used in the analysis.
Table 7. Results of sensitivity analysis for albiglutide vs comparatorsTable Footnote*.
Albiglutide vs insulin glargine
Base-case analysis
Albiglutide treatment was associated with a modest improvement in mean life expectancy of 0.017 years compared with insulin glargine (13.795 years; SD = 0.200 vs 13.778 years; SD = 0.191), a mean quality-adjusted life expectancy increase of 0.033 years (9.141 years; SD = 0.133 vs 9.108 years; SD = 0.127) and reduced diabetes-related cardiovascular complications ( and ). During the 50-year time horizon, mean total cost in the albiglutide arm was $2597 more than in the insulin glargine arm, with an ICER of $79 166 per QALY gained ( and ).
Sensitivity analysis
Based on the acceptability curves (), at a willingness-to-pay threshold of $50,000 per QALY gained, there was a 41.5% probability of albiglutide being cost-effective vs insulin glargine. The probability increased to 49.9% when the willingness-to-pay threshold was increased to $100,000 per QALY gained.
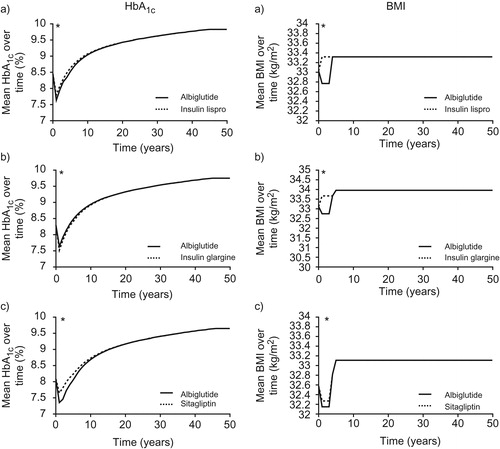
One-way analysis found that the lower BMI associated with albiglutide treatment compared to insulin glargine treatment was the key driver of cost-effectiveness. In the long-term modeling analysis, in years 1–3 BMI was 32.75 kg/m2 for the albiglutide treatment group compared to 33.67 kg/m2 for the insulin glargine treatment group (). Abolishing this difference resulted in an ICER of $470,788 per QALY gained (). Additionally, a noteworthy decrease in ICER to $13,454 per QALY gained was observed when an increased disutility decrement value associated with a mild hypoglycemic event was used, based on data from Marrett et al.Citation35.
Figure 3. HbA1c and BMI progression. (a) Albiglutide plus insulin glargine vs insulin lispro plus insulin glargine; (b) albiglutide vs insulin glargine; (c) albiglutide vs sitagliptin. * Denotes where plots are initially based on CORE model-derived data. Prior to this, plots based on clinical data: (a) 26-week; (b) 52-week; (c) 104 week.
Albiglutide vs sitagliptin
Base-case analysis
An improvement in mean life expectancy of 0.110 years was seen with albiglutide vs sitagliptin treatment (14.335 years; SD = 0.180 vs 14.225 years; SD = 0.190), with mean quality-adjusted life expectancy increasing by 0.101 years (9.618 years; SD = 0.125 vs 9.517 years; SD = 0.130) and fewer diabetes-related complications ( and ). After 1 year, HbA1c decreased by 0.73% with albiglutide and 0.43% with sitagliptin (, )Citation14. Over the 50-year time horizon, mean total cost in the albiglutide arm was $2223 more than in the sitagliptin arm, and the ICER was $22,094 per QALY gained ( and ).
Sensitivity analysis
There was a 67.5% probability of albiglutide being cost-effective vs sitagliptin at a willingness-to-pay threshold of $50,000 per QALY gained. It increased to 69.8% when the threshold was increased to $100,000 per QALY gained ().
The largest effect on the ICER compared with the base-case analysis was observed when the time horizon decreased from 50 years to 5 years, with the ICER increasing to $148,893 per QALY gained (). Abolishing the HbA1c difference also had a substantial effect, with ICER increasing to $66,714 per QALY gained, indicating that this property was the main driver of incremental benefit for albiglutide vs sitagliptin.
Discussion
This study evaluated the cost-utility of albiglutide treatment in patients with type 2 diabetes compared with other agents for diabetes, based on a US third-party payer perspective. Although the high upfront costs of GLP-1RA, such as albiglutide, may cause physicians to prescribe other medications to treat this disease, without a long-term cost analysis, such decisions may be premature. Furthermore, long-term economic evaluation may bridge the gap between use of surrogate markers in clinical trials with hard outcomes that drive the disease burden in the long-term.
For type 2 diabetes management decisions, both short-term and long-term costs are important. The American Managed Care Pharmacy (AMCP) internationally recognized guidelines recommend the use in models of both short- and long-term time horizons for chronic diseasesCitation36,Citation37. Furthermore, surrogate markers of long-term outcomes are evaluated in clinical trials. The CORE Diabetes Model used in this analysis leverages the value of these surrogate markers for predicting long-term outcomes using the United Kingdom Prospective Diabetes Study risk equationsCitation15,Citation16.
In this analysis, albiglutide was associated with a modest improvement in quality-adjusted life expectancy relative to insulin glargine, insulin lispro (both in combination with insulin glargine), and sitagliptin. This improvement was largely driven by mean differences in HbA1c (the primary end-point in the HARMONY studies) and/or by improvements in BMICitation12–14. The projected improvements in life expectancy and quality-adjusted life expectancy were accompanied by an increase in total costs, primarily due to the greater acquisition costs for albiglutide vs the comparator agents. These increases in total costs were partially offset by a reduction in expenditure as a result of a reduction in diabetes-related complications and self-monitoring of blood glucose (compared with those observed with insulin lispro).
At a willingness-to-pay threshold of $100,000 per QALY gained, albiglutide was cost-effective vs all comparators; whereas, at a threshold of $50,000 per QALY gained, albiglutide was cost-effective vs sitagliptin and insulin lispro. A value of $50,000 to $100,000 per QALY gained is commonly cited as a threshold for cost-utilityCitation38, although thresholds greater than $100,000 per QALY gained have been suggested by Braithwaite et al.Citation39 to account for inflation and the perspective of patients, society, and payers.
In sensitivity analyses, shortening the time horizon relative to the base-case analyses consistently resulted in higher ICERs. These increases were likely driven by the up-front costs of albiglutide not being fully balanced by the reduced risk of diabetes complications, which typically emerge over longer periods.
Another aspect that was captured in the sensitivity analysis was the notable relationship between the cost-utility of albiglutide and its ability to improve several drivers of clinical benefit relative to its comparators. For example, eliminating the BMI benefit in the analysis with insulin glargine resulted in an increase in ICER from $79,166 to $470,788, whereas eliminating the HbA1c benefit in the analysis with sitagliptin raised the ICER from $22,094 to $66,714. For BMI, this benefit was seen in years 1–3, while, for HbA1c, the benefit was primarily through years 1–7; thus, the BMI benefit was less affected by discounting. In sensitivity analysis, eliminating differences in individual drivers of clinical benefit resulted in only modest differences in the ICER for albiglutide vs insulin lispro, indicating that the combined effect of all treatment effects produced the overall result, rather than any one difference between treatments.
Additionally, the sensitivity analyses captured the relevance of hypoglycemia in ICER differences between albiglutide and insulin treatment. When a greater hypoglycemia disutility decrement value was used, ICERs substantially decreased in the comparisons of albiglutide to insulin lispro (both in combination with insulin glargine) or insulin glargine.
These results are consistent with published analyses of the cost-utility of the GLP-1RA exenatide QW vs insulin glargine and sitagliptinCitation20,Citation21. However, direct comparisons between the albiglutide and exenatide QW cost-effectiveness studies cannot be made because of fundamental differences in the study designs and assumptions, such as length of time on study drug and assumptions on persistence of differential effects on HbA1c and BMI after the study drug was stopped.
One limitation of this analysis was that it was an extrapolation over a patient’s lifetime (50 years in the base-case analysis) of relatively short-term data obtained during clinical trials. However, the model used has been extensively validated against real-life data and is consistent with published guidance on modeling diabetesCitation15,Citation16,Citation40. Because long-term clinical data are not yet available, health economic modeling remains one of the best available options for informed decision-making. Nevertheless, although such models may perform reasonably well in estimating relative risk, they are limited in their ability to predict absolute riskCitation41.
Another limitation of this study is that the modeling does not take into account potential differences in adherence and persistence between the respective treatments that can influence both effects and costs, particularly those associated with the complications of diabetes. A number of treatment-specific factors have been shown to affect adherence and persistence, including adverse events, cost of medication, and convenienceCitation2,Citation4,Citation42,Citation43. For example, hypoglycemia and its accompanying anxiety, which can be associated with insulin useCitation2, can influence healthcare costs and adherenceCitation4,Citation42. The frequent monitoring of blood glucose levels, which is recommended by the American Diabetes Association for patients taking insulin, can affect adherence because of its effect on quality-of-life and its financial burdenCitation3,Citation43. The need for frequent injections, which was not included in the methods for this analysis, is also a factor associated with adherence to injectablesCitation43.
The effect of nausea and vomiting on cost utility was not evaluated, although the incidence of this adverse event is greater in patients administered albiglutide compared with insulin lisproCitation12. However, because of the transient nature of nausea and vomiting and the low proportion of patients (1.4%) who withdrew owing to this adverse eventCitation12, nausea and vomiting would be anticipated to have a negligible effect on QALY.
Conclusions
In summary, this analysis indicates that albiglutide would modestly increase quality-adjusted life expectancy, partly as a result of increased life expectancy, relative to the combination of insulin lispro and insulin glargine, insulin glargine, or sitagliptin in patients with type 2 diabetes. Albiglutide represents a cost-effective choice compared with other treatments, owing to its reduction in HbA1c and BMI and lower hypoglycemic events. These results support albiglutide as a reasonable second-line treatment option for patients with type 2 diabetes.
Transparency
Declaration of funding
This study was sponsored by GlaxoSmithKline.
Declaration of financial/other relationships
AM and DB are employees of and own stock in GlaxoSmithKline. RT is an employee of GlaxoSmithKline. RP and BH are full-time employees of Ossian Health Economics and Communications GmbH, which received consulting fees from GlaxoSmithKline to conduct the cost-utility analyses. JME peer reviewers on this manuscript have no relevant financial or other relationships to disclose.
Acknowledgments
The authors thank C. Victor Spain, DVM, PhD, for his excellent input and advice in the preparation of this manuscript. Medical writing assistance was provided by Alan Saltzman, PhD (Fishawack Indicia Ltd, Horsham, PA), and funded by GlaxoSmithKline.
Notes
†Tanzeum is a registered trade name of GlaxoSmithKline, Research Triangle Park, NC.
‡Bydureon is a registered trade name of Bristol-Myers Squibb, Princeton, NJ.
§ Trulicity is a registered trade name of Eli Lilly and Company, Indianapolis, IN.
†Humalog is a registered trade name of Eli Lilly and Company, Indianapolis, IN.
‡Lantus is a registered trade name of Sanofi, Bridgewater, NJ.
§Januvia is a registered trade name of Merck & Co., Inc. Whitehouse Station, NJ.
Related Research Data
References
- American Diabetes Association. Economic costs of diabetes in the U.S. in 2012. Diabetes Care 2013;36:1033-46
- American Diabetes Association. Standards of medical care in diabetes—2014. Diabetes Care 2014;37(1 Suppl):S14-80
- Zhuo X, Zhang P, Hoerger TJ. Lifetime direct medical costs of treating type 2 diabetes and diabetic complications. Am J Prev Med 2013;45:253-61
- Fidler C, Elmelund Christensen T, Gillard S. Hypoglycemia: an overview of fear of hypoglycemia, quality-of-life, and impact on costs. J Med Econ 2011;14:646-55
- Garber AJ, Abrahamson MJ, Barzilay JI, et al. AACE comprehensive diabetes management algorithm 2013. Endocr Pract 2013;19:327-36
- Tanzeum® Prescribing Information. Triangle Park, NC: GlaxoSmithKline LLC Research, 2014
- Bydureon® Prescribing Information. Princeton, NJ: Bristol-Myers Squibb Company, 2014
- Trulicity® Prescribing Information. Indianapolis, IN: Eli Lilly and Company, 2014
- Harrison K, Brown F, Seymore B, et al. The expanding role of new medications in the treatment of type 2 diabetes mellitus. Am J Pharm Benefits 2013;5:157-63
- Gohil K, Enhoffer D. Diabetes market grows ever more crowded. P T 2014;39:877-9
- Sullivan K. PBMs refuse to pay for high drug costs. Plainsboro, NJ, USA: American Journal of Managed Care, 2014. http://www.ajmc.com/focus-of-the-week/0614/PBMs-Refuse-to-Pay-for-High-Cost-Drugs. Accessed May 13, 2015
- Rosenstock J, Fonseca VA, Gross JL, et al. Advancing basal insulin replacement in type 2 diabetes inadequately controlled with insulin glargine plus oral agents: a comparison of adding albiglutide, a weekly GLP-1 receptor agonist, versus thrice-daily prandial insulin lispro. Diabetes Care 2014;37:2317-25
- Weissman PN, Carr MC, Ye J, et al. HARMONY 4: randomised clinical trial comparing once-weekly albiglutide and insulin glargine in patients with type 2 diabetes inadequately controlled with metformin with or without sulfonylurea. Diabetologia 2014;57:2475-84
- Ahren B, Johnson SL, Stewart M, et al. HARMONY 3: 104-week randomized, double-blind, placebo- and active-controlled trial assessing the efficacy and safety of albiglutide compared with placebo, sitagliptin, and glimepiride in patients with type 2 diabetes taking metformin. Diabetes Care 2014;37:2141-8
- Palmer AJ, Roze S, Valentine WJ, et al. The CORE Diabetes Model: projecting long-term clinical outcomes, costs and cost-effectiveness of interventions in diabetes mellitus (types 1 and 2) to support clinical and reimbursement decision-making. Curr Med Res Opin 2004;20(1 Suppl):S5-26
- McEwan P, Foos V, Palmer JL, et al. Validation of the IMS CORE Diabetes Model. Value Health 2014;17:714-24
- Centers for Disease Control and Prevention. Vital signs: current cigarette smoking among adults aged ≥18 years - United States, 2005-2010. Atlanta, GA: CDC, 2011. http://www.cdc.gov/mmwr/preview/mmwrhtml/mm6035a5.htm. Accessed May 13, 2015
- National Institute on Alcohol Abuse and Alcoholism (NIAAA). Surveillance report #97. Apparent per capita alcohol consumption: national, state, and regional trends, 1977-2011. Bethesda, MD: National Institutes of Health/NIAAA, 2013. http://pubs.niaaa.nih.gov/publications/surveillance97/CONS11.htm. Accessed May 13, 2015
- Davies MJ, Chubb BD, Smith IC, et al. Cost–utility analysis of liraglutide compared with sulphonylurea or sitagliptin, all as add-on to metformin monotherapy in Type 2 diabetes mellitus. Diabet Med 2012;29:313-20
- Samyshkin Y, Guillermin AL, Best JH, et al. Long-term cost-utility analysis of exenatide once weekly versus insulin glargine for the treatment of type 2 diabetes patients in the US. J Med Econ 2012;15(2 Suppl):6-13
- Guillermin AL, Lloyd A, Best JH, et al. Long-term cost-consequence analysis of exenatide once weekly vs sitagliptin or pioglitazone for the treatment of type 2 diabetes patients in the United States. J Med Econ 2012;15:654-63
- Clarke PM, Gray AM, Briggs A, et al. A model to estimate the lifetime health outcomes of patients with type 2 diabetes: the United Kingdom Prospective Diabetes Study (UKPDS) Outcomes Model (UKPDS no. 68). Diabetologia 2004;47:1747-59
- Hayes AJ, Leal J, Gray AM, et al. UKPDS outcomes model 2: a new version of a model to simulate lifetime health outcomes of patients with type 2 diabetes mellitus using data from the 30 year United Kingdom Prospective Diabetes Study: UKPDS 82. Diabetologia 2013;56:1925-33
- World Health Organization. Global Health Observatory Data Repository. Adult mortality: Data by country. Geneva, Switzerland: WHO, 2014. http://apps.who.int/gho/data/node.main.11?lang=en. Accessed May 13, 2015
- Clarke P, Gray A, Holman R. Estimating utility values for health states of type 2 diabetic patients using the EQ-5D (UKPDS 62). Med Decis Making 2002;22:340-9
- Tengs TO, Wallace A. One thousand health-related quality-of-life estimates. Med Care 2000;38:583-637
- Currie CJ, Morgan CL, Poole CD, et al. Multivariate models of health-related utility and the fear of hypoglycaemia in people with diabetes. Curr Med Res Opin 2006;22:1523-34
- Bagust A, Beale S. Modelling EuroQol health-related utility values for diabetic complications from CODE-2 data. Health Econ 2005;14:217-30
- Yeaw J, Lee WC, Aagren M, et al. Cost of self-monitoring of blood glucose in the United States among patients on an insulin regimen for diabetes. J Manag Care Pharm 2012;18:21-32
- Pollock RF, Curtis BH, Valentine WJ. A long-term analysis evaluating the cost-effectiveness of biphasic insulin lispro mix 75/25 and mix 50/50 versus long-acting basal insulin analogs in the United States. J Med Econ 2012;15:766-75
- O’Brien JA, Patrick AR, Caro J. Estimates of direct medical costs for microvascular and macrovascular complications resulting from type 2 diabetes mellitus in the United States in 2000. Clin Ther 2003;25:1017-38
- Yeaw J, Halinan S, Hines D, et al. Direct medical costs for complications among children and adults with diabetes in the US commercial payer setting. Appl Health Econ Health Policy 2014;12:219-30
- Bureau of Labor Statistics. Databases, Tables, & Calculators by Subject. Washington, DC: US Department of Labor/Bureau of Labor Statistics, 2014. http://data.bls.gov/timeseries/CUUR0000SA0. Accessed May 13, 2015
- US Census Bureau. State & County QuickFacts. Washington, DC: US Department of Commerce/US Census Bureau, 2015. http://quickfacts.census.gov/qfd/states/00000.html. Accessed May 13, 2015
- Marrett E, Radican L, Davies MJ, et al. Assessment of severity and frequency of self-reported hypoglycemia on quality of life in patients with type 2 diabetes treated with oral antihyperglycemic agents: a survey study. BMC Res Notes 2011;4:251
- Academy of Managed Care Pharmacy. The AMCP Format for Formulary Submissions Version 3.1. Alexandria, VA: Academy of Managed Care Pharmacy, 2012. http://www.amcp.org/practice-resources/amcp-format-formulary-submisions.pdf. Accessed January 22, 2016
- International Society for Pharmacoeconomics and Outcomes Research. Pharmacoeconomic Guidelines Around the World. Lawrenceville, NJ: International Society for Pharmacoeconomics and Outcomes Research, 2014. http://www.ispor.org/PEguidelines/countrydet.asp?c=24&t=4. Accessed January 22, 2016
- Grosse SD. Assessing cost-effectiveness in healthcare: history of the $50,000 per QALY threshold. Expert Rev Pharmacoecon Outcomes Res 2008;8:165-78
- Braithwaite RS, Meltzer DO, King JT, Jr., et al. What does the value of modern medicine say about the $50,000 per quality-adjusted life-year decision rule? Med Care 2008;46:349-56
- American Diabetes Association. Guidelines for computer modeling of diabetes and its complications. Diabetes Care 2004;27:2262-5
- Palmer AJ, Clarke P, Gray A, et al. Computer modeling of diabetes and its complications: a report on the Fifth Mount Hood challenge meeting. Value Health 2013;16:670-85
- Walz L, Pettersson B, Rosenqvist U, et al. Impact of symptomatic hypoglycemia on medication adherence, patient satisfaction with treatment, and glycemic control in patients with type 2 diabetes. Patient Prefer Adherence 2014;8:593-601
- Vijan S, Hayward RA, Ronis DL, et al. Brief report: the burden of diabetes therapy: implications for the design of effective patient-centered treatment regimens. J Gen Intern Med 2005;20:479-82