Abstract
Understanding individual response to a drug -what determines its efficacy and tolerability -is the major bottleneck in current drug development and clinical trials. Intracellular response and metabolism, for example through cytochrome P-450 enzymes, may either enhance or decrease the effect of different drugs, dependent on the genetic variant. Microarrays offer the potential to screen the genetic composition of the individual patient However, experiments are «noisy» and must be accompanied by solid and robust data analysis. Furthermore, recent research aims at the combination of high-throughput data with methods of mathematical modeling, enabling problem-oriented assistance in the drug discovery process. This article will discuss state-of-the-art DNA array technology platforms and the basic elements of data analysis and bioinformatics research in drug discovery. Enhancing single-gene analysis, we will present a new method for interpreting gene expression changes in the context of entire pathways. Furthermore, we will introduce the concept of systems biology as a new paradigm for drug development and highlight our recent research - the development of a modeling and simulation platform for biomedical applications. We discuss the potentials of systems biology for modeling the drug response of the individual patient.
La comprensión de la respuesta individual a un fármaco -que determina su eficacia y tolerabilidad en el organismo- es el principal cuello de botella en el desarrollo actual de fármacos y ensayos clínicos. La respuesta intracelular y el metabolismo, donde participan por ejemplo las enzimas del citocromo P-450, puede aumentar o disminuir el efecto de diferentes fármacos, dependiendo de la variante genética. La tecnología de microarrays ofrece el potencial para mapear la composición genética del paciente individual. Sin embargo, como los experimentos no son tan precisos deben acompañarse de un análisis sólido y consistente de los datos. Además, la investigación reciente apunta a la combinación de datos con metodología proveniente de modelos matemáticos que permiten una asistencia orientada a problemas en el proceso de descubrimiento de fármacos. Este artículo revisará el estado actual del conocimiento acerca de las plataformas de tecnología de arrays de ADN y los elementos básicos del análisis de los datos y la investigación bioinformática en el descubrimiento de fármacos. Para incrementar el análisis de un gen único, se presentará un nuevo método para la interpretación de los cambios en la expresión de los genes teniendo en cuenta todas las vías involucradas. Además se introducirá el concepto de biología de sistemas, como un nuevo paradigma para el desarrollo de fármacos, y se destacará nuestra reciente investigación acerca del desarrollo de un modelo y una plataforma de simulación para aplicaciones biomédicas. Finalmente se discutirán las potencialidades de la biología de sistemas para los modelos de respuesta a fármacos en el paciente individual.
La compréhension de la réponse individuelle au médicament, ce qui détermine son efficacité et sa tolérance chez le patient, est le principal goulet d'étranglement des essais cliniques et du développement des médicaments actuels. Le métabolisme et la réponse intracellulaires, par exemple à travers les enzymes du cytochrome P-450, peut soit augmenter soit diminuer l'effet des différents médicaments, selon la génétique. Des microéchantillons (microarrays) permettent de déterminer la configuration génétique de chaque patient. Ces techniques sont toutefois imprécises, justifiant une méthodologie précise et exigeante lors de l'analyse. De plus, la recherche récente permet un débit élevé de données avec des méthodes de modélisation mathématique permettant de résoudre les problèmes ayant trait aux moyens de découverte des médicaments. Cet article concerne les techniques de pointe des plates-formes de technologie de microéchantillons d'ADN ainsi que les bases de l'analyse de données et de la recherche bio-informatique pour la découverte des médicaments. Nous présenterons une nouvelle méthode consistant à décrire les modifications de l'expression génétique au niveau de toute une cascade de réponses biologiques. Nous introduirons le concept de biologie des systèmes comme un nouveau paradigme pour le développement des médicaments et nous mettrons l'accent sur notre recherche récente, le développement d'une plate-forme de simulation et de modélisation pour les applications biomédicales. Nous discuterons du potentiel de la biologie des systèmes pour la modélisation de la réponse de chaque patient au médicament.
Recent reports have highlighted the imbalance between rising costs in drug discovery and the production of new molecular entities for the market,Citation1,Citation2 leading to a. long-term loss of efficiency Remarkably, this decline in productivity has occurred despite the fact that, biomedical research benefits from large governmental and private investments, and despite the comprehensive improvements in our knowledge of human genes resulting from large sequencing projects.
The tremendous efforts that have to be invested for drug target identification, follow-up validation studies, and clinical trials, in combination with the high failure rate as a. consequence of individual response to drugs, has imposed high costs on the development of drugs. Understanding individual response to a drug, what, determines its efficacy and tolerability in the patient's body, is the major bottleneck in drug development, and clinical trials. When a drug is delivered through the body, each individual reacts differently in terms of intracellular response and metabolism. A prominent example is seen with the cytochrome P-450 enzymes, a. family of drug-metabolizing enzymes that, may either enhance or decrease the effect, of different drugs, dependent on the genetic variant.Citation3 Thus, the individual genetic composition of the patient has become a. major issue in studying drug targets and responses to medical treatment.
Microarrays are the state-of-the-art platform for screening the genetic composition of the individual patient. This technology offers the chance to acquire the complete state of gene expressionCitation4-Citation6 and to identify genes and pathways that, are affected by the treatment.Citation7,Citation8 On the other hand, high-throughput technologies such as microarrays are also a. part of the problem. The new technologies have led to an increasing amount of heterogeneous (and often conflicting) data, corresponding to an increasing amount of potential drug targets.
Microarray experiments are “noisy” by nature, and must be accompanied by solid and robust data analysis components. This task has been part of bioinformatics research since the advent of this new discipline. The components of microarray analysis range from lowlevel analysis, explorative statistics to higher-level analysis involving additional data, annotation, and knowledge in order to embed the gene expression data in a functional context. The main purpose of data analysis is to filter the information and to enrich the level of information complexity from single gene markers to biological pathways.
This article will discuss the state-of-the-art deoxyribonucleic acid (DNA) array technology platforms and the basic elements of data analysis and bioinformatics research in drug discovery, developed by us and others. Apart, from the single-gene analysis we will present, a new method for interpreting gene expression changes in the context of the pathways involved. Recent, microarray applications for neuroscience will be considered, and the particular challenges for gene expression analysis of the brain will be discussed. Furthermore, we will introduce the concept of systems biology as a new paradigm for drug development and highlight, our recent research - the development of a. modeling and simulation platform for biomedical applications. This research field, which shows great potential for modeling the drug response of the individual patient, will deliver valuable hypotheses for personalized drug treatment and therapy monitoring in the medium to long term.
DNA array platforms for gene expression profiling
DNA arrays are the most, common gene expression profiling technology. A DNA array consists of a solid support, (nylon membrane, glass chip) that carries DNA sequences representing genes - the probes. In hybridization experiments with the target sample of labeled complementary ribonucleic acids (cRNAs) and through subsequent data, capture a. numerical value, the signal intensity, is assigned to each probe. Labeling is done either radioactively (phosphorus, 33P) and detected with a phosphor imager or fluorescently (Cy3/Cy5 dyes) and detected with specific scanners. Chips are typically small (<2 cm2) and allow the immobilization of tens of thousands of different, gene representatives.
The most, prominent DNA array technology is the Affymetrix GeneChip system.Citation9 Here, genes are represented by probe sets of short, oligonucleotides (typically 11 to 20 25mers) that are distributed across their sequences. These oligonucleotides are synthesized in a highly specific manner at defined locations using a photolithographic procedure. After hybridization, the measured intensity for the represented gene is summarized across the different probes in the probe set. Affymetrix chips have emerged as the pharmaceutical standard, and are widely in use because of the highly standardized chip generation process. Whole-genome chips are available for a. large number of organisms, such as human, mouse, rat, bovine, pig, etc. An experiment, with Affymetrix technology is typically a single-channel experiment, ie, only one target sample is analyzed in one experiment.
An alternative technology is the Agilent, system.Citation10 This relies on the immobilization of longer oligonucleotides (60mers) synthesized in situ at or near the surface of the slide by inkjet printing using phosphoramidite chemistry. These probes are highly specific for the represented gene and show, generally, better hybridization properties than systems with shorter oligonucleotides. Experiments are typically double-channel experiments, ie, two target, samples are analyzed simultaneously, each labeled with a different cyanine dye and cpantified with a separate scanning procedure.
A recent technological development is the Illumina BeadChip systemCitation11,Citation12 that utilizes an ”array of arrays“ format. Each array on the support, contains thousands of wells into which up to hundreds of thousands of beads self-assemble in a random fashion. Specific 50-mer gene sequences concatenated with an address sequence recognize the beads and attach to them. After bead assembly, a hybridization -based procedure is used to map the array, to determine which bead type resides in each well of the array and to validate the performance of each bead type. An advantage of this technology is that several samples can be analyzed on the same chip, thus preventing experimental artifacts across chips or dye labeling procedures. For example, the recent HumanRcf-8 chip offers the possibility of screening eight different. samples in parallel.
Other commercial chip providers are Amersham Biosciences, NimbleGcn, Febit, and Applied Biosystems. There are advantages and disadvantages of the abovementioned platforms regarding hybridization specificity, sample target material needed, and other factors, as pointed out in a recent review.Citation13
Historically the first array technology was based on spotted cDNAs.Citation14-Citation16 This technology is still extensively in use in the academic sector, but. also in pharmaceutical research that, involves probe sets not. covered by standard array formats. cDNAs have a high variability in length (600 to 1.500 bp) and arc amplified using a polymerase chain reaction (PCR). PCR products are then transferred to the surface via contact, printing by robotic devices ().
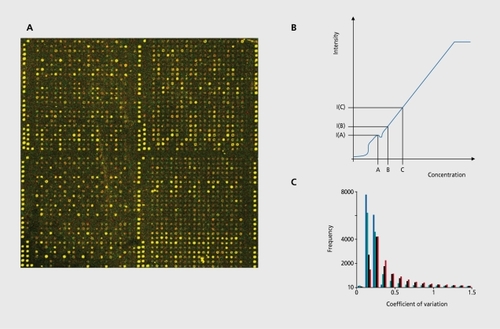
The implicit assumption of all microarray studies is that the signal intensity measured with a specific probe is proportional to the number of molecules of the respective gene in the target sample. Changes in signal intensities are interpreted as concentration changes. It should be pointed out, that, the signal intensities arc only crude estimators for the actual concentrations, and the interpretation as concentration changes is only valid if the intensity-concentration correspondence is approximately linear. Microarray measurements often show deviations from this assumption: for example, saturation effects; the spot, signals are above a limit that no longer allows the detection of concentration changes or other nonlinearitics if the concentration of the gene is below the detection limit, of a microarray (Figure 1b).
Whole-genome chips carry probes for (more or less) the entire genome. These chips are used typically in the beginning of a study when it. is not, clear what, genes are responsible for the drug response of certain groups of patients (for example drug-sensitive and -resistant). For diagnostic purposes specific theme (or custom) chips are used that carry only a few marker genes. The use of custom microarrays for neuroscience applications has been discussed recently.Citation18
There have been several studies comparing the performance of microarray platforms.Citation19-Citation22 Most of these studies reveal a poor correlation in the global expression of the genes. This might, be due to several reasons, such as hybridization sensitivity due to the different probe lengths, different chemical, treatments, and different statistical methods in the readout of the scanned images. A further issue is the source of the probe sequences. Annotation and probe design typically differ with the background sequence database used by the provider. Currently several competing collections of transcript sequences are available, and serve as the basis for probe annotation such as Unigene, Refseq, Locuslink, ENSEMBL, etc. Furthermore, probe design of the chip provider must, be updated regularly A recent study showed the potential misinterpretation of experiments performed with Affymetrix probe set. assignments that are not updated to the latest genome annotations, and reported a 30% to 50% discrepancy in final lists of differentially expressed genes in several gene expression studies.Citation23
Inherent, in most technology platforms is software to read the digital image after the scanning process and to compute for each gene representative the intensity value.Citation24,Citation25 Image analysis methods can be grouped into three different classes: manual, semiautomated, and automated methods. Simulation studies on systematically perturbed artificial images have shown that the data reproducibility increases with the grade of automation of the software (Figure 1c). Citation26 However, for “noisy” images that show a very irregular structure, manual methods might be the best choice.
Data analysis components
Analysis of expression data comprises several modules that address different, questions relevant for drug response screening.Citation27 The most important tasks are:
to identify genes that are differentially expressed when comparing two or more conditions (for example, groups of patients resistant or sensitive to a certain drug)
to identify common gene expression patterns that classify individuals accordingly
to identify relevant pathways explaining the expression patterns.
Regarding the complexity of the resulting information, the major goal of data, analysis is filtering the many thousands of uninformative genes to a set, of informative markers, networks, and pathways that are relevant for the problem under analysis ( Figure 2a).
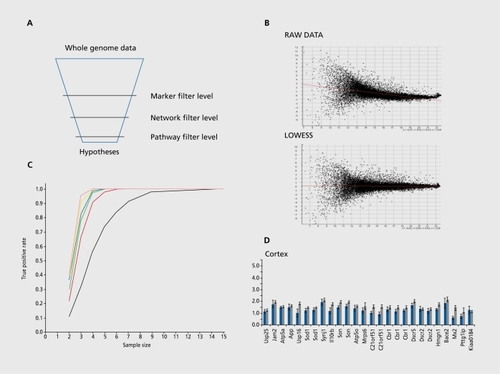
Data from microarray experiments typically come out in the form of a table with raw data, ie, the measured intensity values. This raw data is not easily comparable across experimental replicates, so that some data preprocessing (or normalization) is necessary. The task of normalization is the elimination of influencing factors that arc not. due to the probe-target interaction, such as labeling effects (different, dyes), background correction, pin effects (spotting characteristics), outlier detection (cross-hybridization of oligonucleotidc-probes), etc, thus making signal values comparable across different, experiments (Figure 2b). Different algorithms and methods have been proposed to fulfill these tasks.Citation28-Citation34
The identification of differentially expressed genes between two or more experimental conditions is typically based on two-sample location tests. This setup utilizes replicated experiments with independent samples. The power of such tests is heavily dependent on the number of experimental replicates (Figure 2c).These tests can be used to assign to eachsingle gene a P value that judges the significance of the fold change. Here, it. is notable that this P value is only valid if the distributional assumptions are valid. For example, if a Student's t-test results in a significant. P value, the implication that the corresponding gene is differentially expressed is only true if both sample series are Gaussiandistributed and have equal variances. Usually, these assumptions do not hold in practice but, strikingly, in most, studies this fact is entirely ignored. In our studies we rely therefore on nonparametric alternativesCitation17,Citation35 (Figure 2d): Wilcoxon's rank sum test is based on the ranks of the replicates rather than on the actual signal values. This test (and other tests based on linear rank statistics such as the van der Waerden test) is preferable to the parametric t- tests if the distributional assumptions cannot be proven to be Gaussian. Furthermore, for “noisy” data this test, yields more robust results since it. is less sensitive against outlier values. For larger sample sizes, ie, >25 replicates, we can approximate the P value of the Wilcoxon rank test by the standard normal distribution. However, most practical applications will be based on a rather smaller number of observations (sample sizes in the order of 4 to 12). Therefore, those P values must, be calculated exactly This can be done using a recursive method.Citation36
If several different experimental conditions are screened (for example different, time points after medical treatment), then each gene expresses a certain numerical profile across these conditions. Clustering algorithms are explorative statistical methods that group together genes with similar profiles and separate genes with dissimilar profiles, whereby similarity (or dissimilarity) is defined numerically by a pairwise (dis)similarity function such as Euclidean distance or Pearson correlation.Citation37-Citation40 Hierarchical clustering can be combined with a colorcoded representation of the signal values (the expression patterns) and visualized in the form of a dendrogram. Clustering is a very intuitive way of visualizing data, but it. should be pointed out that, the dendrogram is strongly dependent, on the parameters chosen for cluster analysis. Thus, each clustering process should undergo decent validation.Citation41 Associated groups of genesCitation42 are usually further investigated, for example for common binding sites in the promoter sequences of the genes or for common functional content.Citation43
The major result, of the explorative analysis is essentially a. list of potential marker genes relevant, for the disease or treatment under analysis. Since microarray data is errorprone, this list contains a lot, of false positives. Thus, further filtering steps are commonly included in the analysis. Recent, methods therefore aim at, the correlation of the gene expression profiles with complementing sources of data such as pathway annotation, gene ontology (GO) categories, sequence analysis, clinical data, etc.Citation44-Citation46
Genes do not. act as individual units; they collaborate in overlapping pathways, the deregulation of which is a hallmark for the disease under study New bioinformatics tools have been developed that judge gene expression changes in the context of such pathway analysis. Wehave developed a method that judges the alteration of entire pathways with respect to two experimental conditions. This has been applied recently for the identification of pathways altered upon differentiation of inner cell mass and trophectoderm in the human blastocystCitation47 and upon hormoneinduced aging of the human skin.Citation48 The procedure is based on pathway annotation (for example provided by the Kyoto Encyclopedia of Genes and Genomes [KEGG] pathway database).Citation49 This information is then translated into a two-dimensional statistical test problem that involves Wilcoxon's signed rank sum test in order to compute a Z-score for each pathway that quantifies the degree of alteration across the different experimental conditions. The results of the pathway analysis in the latter study, for example, implicate the involvement of several metabolic pathways in the aging process, such as C21 -steroid hormone metabolism, phospholipid degradation, prostaglandin and leukotriene metabolism, 2,4-dichloro benzoate degradation, and fatty acid biosynthesis. Interestingly, pathways operative in neurodegenerative disease such as Huntington's disease (HD),Citation50,Citation51 dentatorubral-pallidoluysian atrophy (DRPLA),Citation52 and amyotrophic lateral sclerosis (ALS)Citation53 also showed significant age-dependent expression changes.
Databases, standardization initiatives, and common platforms
It has been recognized that, there is a fundamental need worldwide to share microarray data in order to correlate researchers' results with already published data. Since for such a task it is necessary to provide the raw data, large microarray databases have been set up as public repositories (for example the gene expression omnibus (GEO) from NCBICitation54 and ArrayExpress from EBTCitation55).
Functional annotation is provided by the GO consortium.Citation56 The aim of GO is to maintain a consistent, speciesindependent, functional description of gene products. GO terms have a. defined parent-child relationship and form a directed acyclic graph (DAG). At, the root, of the GO are the three top-level categories - molecular function, biological process, and cellular component - which contain many levels of child nodes (GO terms) that describe a gene product with increasing specificity. There are several tools for mining these annotations. We have developed the GOblet server that computes GO-term graph annotation for DNA sequences comprising several different sequence databases.Citation57,Citation58
A particular data repository for neuroscience applications is the National Brain Databank, a publicly accessible gene expression repository for the collection and dissemination of results from postmortem studies of neurological and psychiatric disorders. The project has been developed by the Harvard Brain Tissue Resource Center (HBTRC) in collaboration with Akaza Research, as an online resource for the neuroscience community.
A further useful database for drug discovery and drug response screening is PharmGKB.Citation59,Citation60 This database is a central repository for genetic, genomic, molecular, and cellular phenotype data and clinical information about people who have participated in pharmacogenomics research studies. The data includes, but. is not. limited to, clinical and basic pharmacokinetic and pharmacogenomic research in the cardiovascular, pulmonary, cancer, pathway, metabolic, and transporter domains. Currently, information on 385 drugs and 22 different pathways can be reviewed.
Standardization and the development of standard operating procedures (SOPs), both for data generation and data analysis, are major issues in community initiatives. Whereas SOPs are widespread in experimental procedures, they are not, available for the data-analysis part. Publications often report data analysis methods that are hard to reproduce. Thus, it has been worthwhile to develop some common analysis platforms. Besides commercial programs there have been powerful open-source platforms such as R/Bioconductor. These platforms contain standard statistical procedures, visualization methods, and methods for importing and exporting data. In a script-based language data, analysis methods can be reported and easily reproduced.
The “druggable genome”
The detection of genes (or compounds) that, have a particular molecular feature that makes them useful fo measuring disease progression or effects of treatments can be enhanced by microarray analysis, provided there is a robust data analysis and correlation of the experimental outcome. Other functional genomics technologies are needed to complement the results obtained from microarrays. These technologies (such as proteomics, metabonomics, etc.) arc inherent in standard drug screening workflows in pharmaceutical companies.Citation61 However, the flood of data produced is not easily handlable, and requires a new generation of computational tools that are more effective in managing the data and arc able to embed the obtained result in a functional context.Citation62,Citation63 Current, treatments for most, neurological disorders are either ineffective or minimally effective or produce severe side effects (for example antipsychotic medication in schizophreniaCitation64,Citation65). Thus, there is a clear need for better methods. A potential direction could be the development of compounds that effectively address the disease pathways driven by disease-related pathway identification methods.
It has been reported that the number of potential drug targets is fairly limited. An assessment of the number of genes that might serve as potential targets for drugs has been given recentlyCitation66,Citation67 Starting from the fact, that there are well-known properties that define good drugs, the number of potential drug targets is predictable. These properties can be summarized asCitation68:
presence of more than five hydrogen-bond donors
molecular mass >500 d
high lipophilicity
more than 10 nitrogen and oxygen atoms.
These properties increase the likelihood of oral bioavailability of a compound, ie, what makes it a. commercially viable drug. Looking at the binding sites on human protein sequences for such compounds, only approximately 400 potential targets have been identified. Extending these targets to all members of their relevant gene families, approximately 3000 molecular targets can be identified. Most of these genes belong to a few gene families such as G protein coupled receptors (GPCRs), serine/threonine and tyrosine protein kinases, and nuclear hormone receptors. The implications of these estimations are that the limited number of draggable targets will be well explored within the next decade, with chemical leads being available for most, of them. Thus, there will be a. shift, from the development, of leads to the investigation of the molecular consequences of the drug treatment in the individual patient.
Challenges in neuroscience applications
Drug discovery and treatment in neuroscience face specific challenges, in particular regarding the availability of tissue, poor diagnosis, complexity of brain tissue, and the lack of good model systems for drug target validation.Citation69 Tissue samples in neuroscience applications are mostly post-mortem brain samples from affected individuals. These samples typically reflect, the end stage of the disease, which highly biases the material and makes it impossible to study early disease stages.Citation70 Furthermore, the patients have typically undergone some disease treatment, which has an influence on the gene expression. Thus, separating the effects of these treatments from the effects of the disease is extremely difficult. Here, animal models and tissue culture systems can help to identify marker genes and pathways for the disease, as is common in other studies. For example, in a. recent, work we have utilized a mouse model (Ts65DNCitation71) for trisomy 21 in order to identify genes that show dosage imbalances with respect, to aneuploidyCitation29 Results for many genes (such as APP) could be extrapolated to human tissue samples. Good animal models allow the extraction of untreated brain material as well as material from control samples.
Rodent, and (particularly) nonhuman primate models are primarily interesting in this respect.
Current research utilizes microarrays in several areas of neuroscience research, such as schizophrenia,Citation72-Citation73 brain cancer,Citation74 Alzheimer's disease (AD),Citation75 and HD.Citation76 These studies compare gene expression changes in patient and control groups, and show that microarrays arc valuable tools for the expression profiling of drug response in human individuals.
Interestingly, the latter study incorporated blood samples from patients and control subjects and revealed changes in blood mRNAs that reflect disease mechanisms observed in HD brain. Moreover, these alterations correlate with disease progression. For example, they were able to identify genes altered in blood from HD patients (such as ANXA, CAPZA1, HIF1A, P2Y5, SF3B1, SP3, and TAF7) that were also differentially expressed in HD postmortem brain. This work implies the potential of using easily accessible tissue such as blood for monitoring the progression of complex brain disorders.
Systems biology as a new research paradigm
Systems biology aims at the explanation of physiology and disease from the level of interacting components such as molecular pathways, regulatory networks, cells, organs, and ultimately the entire organism.Citation77 With the use of computer models for such processes in silico predictions can be generated on the state of the disease or the effect, of the individual therapy The new approaches are about, to revolutionize our knowledge of disease mechanisms and of the interpretation of data from high-throughput technologies.Citation1
These approaches are necessary, considering the increasing complexity of research. Often, several laboratories are working with different, techniques on the same problem. A fundamental challenge is thus to search through the exhaustive set of data and extract meaningful information. Here, in silico experiments can be the basis for a more successful drug screening.
Furthermore, there is a fundamental need for integration rules and methods. Multiple databases exist, a variety of experimental techniques have produced gene and proteome expression data from various tissues and samples, and important disease-relevant pathways have been investigated. Information on promoter regions and transcription factors is available for many genes as well as sequence information. This information - although extremely helpful - cannot be utilized in a sufficient way because of the lack of integrative analysis tools. A fundamental aim of systems biology is the understanding of the underlying biological processes on the basis of this data.
Crucial for the step from qualitative, explorative data analysis to quantitative, predictive analysis is the combination of experimental data with the knowledge of the underlying biological reaction system. This approach makes it. possible to come up with conclusions about, the properties of the system, even those that, are not, subject, to experiments or are not. even amenable by any experimental approach. For this purpose we have developed the modeling and simulation system PyBioS.Citation78 With this system it. is possible to construct, models that, are based on the topology of a cellular reaction network and adequate reaction kinetics. Based on this information the system can automatically construct a mathematical model of differential equations that can be used for subsequent, simulation of the temporal behavior and model analysis. Particularly information on the topology of biological systems is available from several databases (eg, KEGG). PyBioS provides interfaces to these databases that can be used for the construction of appropriate model prototypes. Models include metabolic pathways, signal transduction pathways, transport processes, gene regulatory networks, among others, and can be accessed via a Web interface.
Mathematical models for disease pathways have been developed, predominantly for cancer. Examples are general emergence of properties of signaling pathwaysCitation79 such as extended signal duration, threshold behaviors, etc, endodermal growth factor receptor (EGFR) signaling,Citation80-Citation82 and the TNF alpha-mediated NF-kappa B-signaling pathway (NFkB).Citation83,Citation84 Specific pathway models for neuroscience applications are currently rare. Nevertheless, an understanding of the dynamics of these diseases could help to develop strategies to halt them at. the stage they have reached at detection, or to prevent them entirely.Citation85
Conclusion
Despite the great, uncertainties inherent, in functional genomics techniques, they will be indispensable for future work in drug development and therapy monitoring. However, these techniques must, be accompanied by solid support, from data analysis. Bioinformatics, and to an increasing degree, systems biology, have key roles in this process. The information that we can gain about, a biological system (for example a disease process) appears in practice as an experimental observation, and research is restricted to the targeted molecular level and the precision of the experimental techniques in use. It is very likely that, the range of this experimental granularity will increase in the coming years, utilizing heterogeneous techniques that, target a biological question of interest, at, different, points so that data integration becomes a. major challenge for future biomedical research.
In the case of complex disease conditions it is clear that, such integrated approaches are required in order to link clinical, genetic, behavioral, and environmental data with diverse types of molecular phenotype information and to identify correlative associations. Such correlations, if found, are the key to identifying biomarkers and processes that, are either causative or indicative of the disease.
In order to screen the success of drug treatment, in the individual patient, new generations of tools and research methods will be developed. These tools will enable us to perform the crucial step from qualitative to quantitative analysis. Systems biology is pointing in this direction. With its close connection of experimental data, generation, predictive data modeling, and subsequent validation it holds the promise of providing computational tools capable of personalized treatment and therapy monitoring in the individual patient.
Selected abbreviations and acronyms
| AD | = | Alzheimer's disease |
| ALS | = | amyotrophic lateral sclerosis |
| DRPLA | = | dentatombral-pallidoluysian atrophy |
| GEO | = | gene expression omnibus |
| GO | = | gene ontology |
| GPCR | = | G -protein-coupled receptor |
| HD | = | Huntington 's disease |
| PCR | = | polymerase chain reaction |
| PD | = | Parkinson's disease |
| SAGE | = | serial analysis of gene expression |
| SOP | = | standard operating procedure |
The authors wish to thank Christoph Wierling for proofreading the manuscript and Sylvia Krobitsch for providing neuroscience literature.
REFERENCES
- HoodL.PerlmutterRM.The impact of systems approaches on biological problems in drug discovery.Nat Biotechnol.2004221215121715470453
- BoothB.ZemmelR.Prospects for productivity.Nat Rev Drug Discov.2004345145615136792
- WeinshilboumR.Inheritance and drug response.N Engl J Med.200334852953712571261
- GolubTR.SlonimDK.TamayoP.et al.Molecular classification of cancer: class discovery and class prediction by gene expression monitoring.Science.199928653153710521349
- GerholdDL.JensenRV.GullansSR.Better therapeutics through microarrays.Nat Genet.20023254755212454652
- AdlerAS.LinM.HorlingsH.NuytenDS.van de VijverMJ.ChangHY.Genetic regulators of large-scale transcriptional signatures in cancer.Nat Genet20063842143016518402
- MischelPS.CloughesyTF.NelsonSF.DNA-microarray analysis of brain cancer: Molecular classification for therapy.Nat Rev Neurosci.2004578279215378038
- SegalE.FriedmanN.KaminskiN.RegevA.KollerD.From signatures to models: understanding cancer using microarrays.Nat Genet.200537S38S4515920529
- LockhartDJ.DongH.ByrneMC.et al.Expression monitoring by hybridization to high-density oligonucleotide arrays.Nat Biotechnol.199614167516809634850
- HughesT.MaoM.JonesA.et al.Expression profiling using microarrays fabricated by an ink-jet oligonucleotide synthesizer.Nat Biotechnol.20011934234711283592
- GundersonKL.KruglyakS.GraigeMS.et al.Decoding randomly ordered DNA arrays.Genome Res.20041487087715078854
- KuhnK.BakerSC.ChudinE.et al.A novel high-performance random array platform for quantitative gene expression profiling.Genome Res.2004142347235615520296
- HardimanG.Microarray platforms - comparisons and contrasts.Pharmacogenomics.20045487 50215212585
- LehrachH.DrmanacR.HoheiselJ.et al.Hybridization fingerprinting in genome mapping and sequencing. In: Davis KE, Tilghman S, eds.Genome Analysis: Genetic and Physical Mapping. Cold Spring Harbor, NY;19903981
- LennonG.LehrachH.Hybridization analyses of arrayed cDNA libraries.Trends Genet.199173143171781028
- SchenaM.ShalonD.DavisR.BrownP.Quantitative monitoring of gene expression patterns with a complementary DNA microarray.Science.9952704674707569999
- AdjayeJ.HerwigR.HerrmannD.et al.Cross-species hybridisation of human and bovine orthologous genes on high density cDNA microarrays.BMC Genomics.20045814728724
- NewtonSS.BennettA.DumanRS.Production of custom microarrays for neuroscience research.Methods.20053723824616308153
- ParrishML.WeiN.DuenwaldS.et al.A microarray platform comparison for neuroscience applications.J Neurosci Meth.20041325768
- KuoWP.JenssenTK.ButteAJ.Ohno-MachadoL.KohaneIS.Analysis of matched mRNA measurements from two different microarray technologies.Bioinformatics.20021840541211934739
- TanPK.DowneyTJ.SpitznagelEL.et al.Evaluation of gene expression measurements from commercial microarray platforms.Nucleic Acids Res.2003315676568414500831
- BarnesM.FreudenbergJ.ThompsonS.AronowB.PavlidisP.Experimental comparison and cross-validation of the Affymetrix and Illumina gene expression analysis platforms.Nucleic Acids Res.2005335914592316237126
- DaiM.WangP.BoydAD.et al.Evolving gene/transcript definitions significantly alter the interpretation of GeneChip data.Nucleic Acids Res.200533e17516284200
- JainAN.TokuyasuTA.SnijdersAM.SegravesR.AlbertsonDG.PinkelD.Fully automatic quantification of microarray image data.Genome Res.20021232533211827952
- WierlingCK.SteinfathM.ElgeT.et al.Simulation of DNA array hybridization experiments and evaluation of critical parameters during subsequent image and data analysis.BMC Bioinformatics.200232912390683
- SteinfathM.WruckW.SeidelH.LehrachH.RadelofU.O'BrienJ.Automated image analysis for array hybridization experiments.Bioinformatics.20011763464111448881
- HollemanA.CheokMH.denBoerML.et al.Gene-expression patterns in drug-resistant acute lymphoblastic leukemia cells and response to treatment.N Engl J Med.200435153354215295046
- QuakenbushJ.Microarray data normalization and transformation.Nat Genet.200249650112454644
- ClevelandWS.Robust locally weighted regression and smoothing scatterplots.J Am Stat Assoc.197974829836
- ClevelandWS.DevlinSJ.Locally weighted regression: an approach to regression analysis by local fitting.J Am Stat Assoc.198383596610
- YangH.DudoitS.LuuP.et al.Normalization for cDNA microarray data: a robust composite method addressing single and multiple slide systematic variations.Nucleic Acids Res.200230e1511842121
- LiC.WongWH.Model-based analysis of oligonucleotide arrays: Expression index computation and outlier detection.Proc Natl Acad Sel U S A.2001983136
- lrizarryRA.BolstadBM.CollinsF.CopeLM.HobbsB.SpeedTP.Summaries of Âffymetrix GeneChip probe level data.Nucleic Acids Res.200331e1512582260
- DraghiciS.Data Analysis Tools for DNA Microarrays. Boca Raton, Fla: Chapman & Hall/CRC Press2003
- KahlemP.SultanM.HerwigR.et al.Transcript level alterations reflect gene dosage effects across multiple tissues in a mouse model of Down syndrome.Genome Res.2004141258126715231742
- HerwigR.AanstadP.ClarkM.LehrachH.Statistical evaluation of differential expression on cDNA nylon arrays with replicated experiments.Nucleic Acids Res.200129E11711726700
- EisenMB.SpellmanPT.BrownPO.BotsteinD.Cluster analysis and display of genome-wide expression patterns.Proc Natl Acad Sel U S A.1998951486314868
- TamayoP.SlonlmD.MesirovJ.et al.Interpreting patterns of gene expression with self-organizing maps: methods and application to hematopoietic differentiation.Proc Natl Acad Sci U S A.1998962907291210077610
- HerwigR.PoustkaAJ.MullerC.LehrachH.O'BrienJ.Large-scale clustering of cDNA fingerprinting data.Genome Res.199991093110510568749
- SharanR.ShamirR.CLICK: a clustering algorithm with applications to gene expression analysis. Paper presented at: Proceedings of the 8th International Conference on Intelligent Systems for Molecular Biology (ISMB); Menlo Park, California, USA. 2000
- JainAK.DubesRC.Algorithms for Clustering Data. Englewood Cliffs, NJ: Prentice Hall.1988
- TavazoieS.HughesJD.CampbellMJ.ChoRJ.ChurchGM.Systematic determination of genetic network architecture.Nat Genet.19992228128510391217
- GibbonsFD.RothFP.Judging the quality of gene expression-based clustering methods using gene annotation.Genome Res2002121574158112368250
- GittonY.DahmaneN.BaikS.et al.A gene expression map of human chromosome 21 orthologues in the mouse.Nature.200242058659012466855
- RhodesDR.BarretteT.RubinMA.GhoshD.ChinnaiyanAM.Meta-analysis of microarrays: interstudy validation of gene expression profiles reveals pathway dysregulation in prostate cancer.Cancer Res.2002624427443312154050
- RhodesDR.YuJ.ShankerK.et al.Large-scale meta-analysis of cancer microarray data identifies common transcriptional profiles of neoplastic transformation and progression.Proc Natl Acad Sci U S A.20041019309931415184677
- AdjayeJ.HuntrissJ.HerwigR.et al.Primary differentiation in the human blastocyst: Comparative molecular portraits of inner cell mass and trophectoderm cells.Stern Cells.20052315141525
- MakrantonakiE.AdjayeJ.HerwigR.et al.Signalling and metabolic pathways associated with hormone-induced aging in human sebocyte cells in vitro.Aging Cell.2006533134416805856
- KanehisaM.GotoS.KawashimaS.OkunoY.HattoriM.The KEGG resources for deciphering the genome.Nucleic Acids Res.200432D277D28014681412
- Luthi-CarterR.StrandAD.PetersNL.et al.Decreased expression of striatal signaling genes in a mouse model of Huntington's disease.Hum MolGenet. 2000912591271
- SipioneS.RigamontiD.ValenzaM.et al.Early transcriptional profiles in huntingtin-inducible striatal cells by microarray analyses.Hum Mol Genet.2002111953196512165557
- Luthi-CarterR.HansonSA.StrandAD.et al.Polyglutamine and transcription: gene expression changes shared by DRPLA and Huntington's disease mouse models reveal context-independent effects.Hum Mol Genet.2002111927193712165555
- JiangYM.YamamotoM.KobayashiY.et al.Gene expression profile of spinal motor neurons in sporadic amyotrophic lateral sclerosis.Ann Neurol.20055723625115668976
- BarrettT.SuzekTO.TroupDB.et al.NCBI GEO: mining millions of expression profiles - database and tools.Nucleic Acids Res.200533(Database lssue)D562D56615608262
- ParkinsonH.SarkansU.ShojatalabM.et al.ArrayExpress - a public repository for microarray gene expression data at the EBI.Nucleic Acids Res.200533(Databaselssue)D55355515608260
- ene Ontology Consortium. The gene ontology (GO) project in 2006.Nucleic Acids Res.200634(Database lssue)D322D32616381878
- HennigS.GrothD.LehrachH.Automated Gene Ontology annotation for anonymous sequence data.Nucleic Acids Res.2003313712371512824400
- GrothD.LehrachH.HennigS.GOblet: a platform for Gene Ontology annotation of anonymous sequence data.Nucleic Acids Res.200432W31331715215401
- HewettM.OliverDE.RubinDL.et al.PharmGKB: the pharmacogenetics knowledge base.Nucleic Acids Res.20023016316511752281
- ThornCF.KleinTE.AltmanRB.PharmGKB: the pharmacogenetics knowledge base.Methods Mol Biol.2005311179191 16100408
- KramerR.CohenD.Functional genomics to new drug targets.Nat Rev Drug Discov.2004396597215520818
- KanehisaM.BorkP.Bioinformatics in the post-sequence era.Nat Genet.20033330531012610540
- DobrinSE.StephanDA.Integrating microarrays into disease-gene identification strategies.Expert Rev Mol Diagn.2003337538512779011
- DunckleyT.CoonKD.StephanDA.Discovery and development of biomarkers of neurological disease.Drug Discov Today.20051032633415749281
- EvansWE.McLeodHL.Pharmacogenomics- drug disposition, drug targets, and side effects.N Engl J Med.200334853854912571262
- HopkinsAL.GroomCR.The druggable genome.Nat Rev Drug Disc.20021727730
- RussAP.LampelS.The druggable genome: an update.Drug Discov Today2005101607161016376820
- LipinskiC.LombardeF.DominyB.FeeneyP.Experimental and computational approaches to estimate solubility and permeability in drug discovery and development settings.Adv Drug Deliv Rev.199723225
- MimicsK.PevsnerJ.Progress in the use of microarray technology to study the neurobiology of disease.Nat Neurosci.20045434439
- MirnicsK.MiddletonFA.LewisDA.LevittP.Analysis of complex brain disorders with gene expression microarrays: schizophrenia as a disease of the synapse.Trends Neurosci.20012447948611476888
- ReevesRH.IrvingNG.MoranTH.et al.A mouse model for Down syndrome exhibits learning and behaviour deficits.Nat Genet.1995111771847550346
- MimicsK.MiddletonFA.MarquezA.LewisDA.LevittP.Molecular characterization of schizophrenia viewed by microarray analysis of gene expression in prefrontal cortex.Neuron.200028536711086983
- MiddletonFA.MirnicsK.PierriJN.LewisDA.LevittP.Gene expression profiling reveals alterations of specific metabolic pathways in schizophrenia.J Neurosci.2002222718272911923437
- MischelPS.CloughesyTF.NelsonSF.DNA microarray analysis of brain cancer: molecular classification for therapy.Nat Rev Neurosci.2004578279215378038
- BIalockEM.GeddesJW.ChenKC.PorterNM.MarkesberyWR.LandfieldPW.Incipient Alzheimer's disease: microarray correlation analyses reveal major transcriptional and tumor suppressor response.Proc Natl Acad Sci U S A.20041012173217814769913
- BoroveckiF.LovrecicL.ZhouJ.et al.Genome-wide expression profiling of human blood reveals biomarkers for Huntington's disease.Proc Natl Acad Sci U S A.2005102110231102816043692
- ButcherE.BergEL.KunkelEJ.Systems biology in drug discovery.Nat Biotechnol.2004221253125915470465
- KlippE.HerwigR.KowaldA.WierlingC.LehrachH.Systems Biology in Practice. Weinheim, Germany: Wiley-VCH;2005
- BhallaUS.IyengarR.Emergent properties of networks of biological signaling pathways.Science.19992833813879888852
- WileyHS.ShvartsmanSY.LauffenburgerDA.Computational modeling of the EGF-receptor system: a paradigm for systems biology.Trends Cell Biol.200313435012480339
- SchoeberlB.Eichler-JonssonC.GillesED.MullerG.Computational modeling of the dynamics of the MAP kinase cascade activated by surface and internalized EGF receptors.Nat Biotechnol.20022037037511923843
- OdaK.MatsuokaY.FunahashiA.KitanoH.A comprehensive pathway map of epidermal growth factor receptor signaling.Mol Sys Biol.2005 2005.0010Epub2005 May 25
- ChoKH.ShinSY.LeeHW.WolkenhauerO.Investigations into the analysis and modeling of the TNF alpha-mediated NF-kappa B-signaling pathway.Genome Res2003132413242214559780
- HoffmannA.LevchenkoA.ScottML.BaltimoreD.The l-kappaB-NFkappaB signaling module: temporal control and selective gene activation.Science.20052981241124512424381
- ABmusHE.HerwigR.ChoKH.WolkenhauerO.Understanding the dynamics of biological systems: roles in medical research.Expert Rev Mol Diagn. In press2006