Abstract
An increasing number of theoretical and empirical studies approach the function of the human brain from a network perspective. The analysis of brain networks is made feasible by the development of new imaging acquisition methods as well as new tools from graph theory and dynamical systems. This review surveys some of these methodological advances and summarizes recent findings on the architecture of structural and functional brain networks. Studies of the structural connectome reveal several modules or network communities that are interlinked by hub regions mediating communication processes between modules. Recent network analyses have shown that network hubs form a densely linked collective called a “rich club,” centrally positioned for attracting and dispersing signal traffic. In parallel, recordings of resting and task-evoked neural activity have revealed distinct resting-state networks that contribute to functions in distinct cognitive domains. Network methods are increasingly applied in a clinical context, and their promise for elucidating neural substrates of brain and mental disorders is discussed.
Un creciente número de estudios teóricos y empíricos enfocan la función del cerebro humano desde una perspectiva de red. El análisis de las redes cerebrales se ha hecho posible gracias al desarrollo de nuevos métodos de obtención de imágenes, así como de nuevas herramientas provenientes de la teoría de grafos y de los sistemas dinámicos. Este artículo revisa algunos de estos avances metodológicos y resume los hallazgos recientes sobre la arquitectura de las redes cerebrales estructurales y funcionales. Los estudios del conectoma estructural revelan que existen varios módules o comunidades de redes que están vinculadas entre sí por concentradores (“hubs”) que median los procesos de comunicación entre los módules. Análisis recientes han demostrado que los concentradores de la red forman un nodo densamente interconectado denominado “club de ricos”, localizado centralmente para atraer y dispersar las señales de tránsito. En paralelo, los registros de la actividad neural en reposo y evocada por tareas han revelado distintas redes en estado de reposo que contribuyen a las funciones en diversos dominios cognitivos. Ya que los métodos de red se aplican cada vez más en el contexto clínico, se discute lo prometedor que puedan resultar estos para dilucidar los sustratos neurales de los trastornos cerebrales y mentales.
De plus en plus d'études théoriques et empiriques abordent la fonction du cerveau humain sous I'angle de réseaux. L'analyse de ces réseaux est rendue possible par le développement de nouvelles méthodes d'acquisition d'imagerie et de nouveaux outils issus de théories graphiques et de systèmes dynamiques. Cet article analyse certaines de ces avancées méthodologiques et résume les récentes découvertes sur l'architecture des réseaux cérébraux anatomiques et fonctionnels. Des études sur le connectome structurel montrent plusieurs modules ou communautés de réseaux liés par des points centraux ou centres d'activité (hubs) permettant des processus de communication entre les modules. De récentes analyses des réseaux ont montré que les centres de ces réseaux forment un collectif à forte densité de liaison appelé «club de riches», dispose centralement pour attirer et disperser la circulation du signal. Parallèlement, des enregistrements de I'activité neuronale déclenchée par le travail ou au repos ont révélé des réseaux d'état de repos distincts contribuant à des fonctions dans différents domaines cognitifs. Les modèles de réseaux sont de plus en plus appliqués dans un contexte clinique et nous analysons les perspectives qu'ils offrent pour élucider les substrats neuronaux des troubles mentaux et cérébraux.
Introduction
The idea that the nervous system is a network of interconnected neurons has a long and illustrious history in neuroscience. Anatomical studies of the brain's cytoarchitecture, cellular circuits, and long-range fiber systems have yielded an extraordinary amount of detailed information about the brain's structural organization. The ongoing quest to map the intricate networks of the human brain with ever-increasing accuracy and resolution has recently expanded in new directions. Technological developments in noninvasive neuroimaging have opened up new avenues towards studying the structure and function of the human brain.Citation1,Citation2 These advances are increasingly combined with powerful network modeling tools developed in the course of a broader research effort to understand the structure and dynamics of complex systems.Citation3,Citation4 This recent confluence of neuroscience and network science opens up a number of new opportunities for approaching brain function from a complex systems perspective.Citation5-Citation8 This review is intended as a primer on current research efforts to map and model the networks of the human brain, with the long-term aim of understanding how the functioning of the brain depends on its network architecture.
Modern noninvasive imaging techniques applied to the human brain allow the mapping of anatomical regions and their interconnecting pathways at near-millimeter resolution. The resulting large-scale networks provide a comprehensive description of the brain's structural connectivity, also called the human connectome.Citation9,Citation10 The connectome essentially comprises a complete map of the brain's structural connections. These structural connections shape large-scale neuronal dynamics which can be captured as patterns of functional and effective connectivity.Citation11,Citation12 Functional connectivity describes statistical patterns of dynamic interactions among regions, also called “functional networks,” while effective connectivity attempts to discern networks of causal influences. Functional networks can be measured with a variety of neuroimaging or electrophysiological recording methods, and they unfold within the structural networks of the connectome while the brain is endogenously active (or “at rest”) as well as in the course of stimulus- or task-evoked perturbations.
Creating maps of structural or functional connections brings the challenge of extracting relevant or significant aspects of network organization, and this challenge can be met by applying modern network modeling and analysis tools. How these modern network approaches have enriched our understanding of brain function is the main topic of this article. The first section will provide an overview of major quantitative methods for analyzing brain network data. The following section will focus on current efforts directed at mapping networks of the human brain, with a focus on structural networks delivered by diffusion imaging and tractography. The article then turns to the important problem of linking structural networks to ongoing and evoked brain dynamics. Finally, the article examines the state of the art in using network approaches directed at uncovering the role of connectivity in brain and mental disorders. The article concludes with a brief reflection on the future promise of network approaches for understanding the function of the healthy and diseased brain.
Tools and methods of network science
Brain networks can be derived from anatomical or physiological observations, resulting in structural and functional networks, respectively. When interpreting brain network data sets, it is important to respect this fundamental distinction.Citation7,Citation13
Structural connectivity describes anatomical connections linking a set of neural elements. At the scale of the human brain, these connections generally refer to white matter projections linking cortical and subcortical regions. Structural connectivity of this kind is thought to be relatively stable on shorter time scales (seconds to minutes) but may be subject to plastic experience-dependent changes at longer time scales (hours to days). In human neuroimaging studies, structural brain connectivity is commonly measured as a set of undirected links, since the directionality of projections currently cannot be discerned.
Functional connectivity is generally derived from time series observations, and describes patterns of statistical dependence among neural elements.Citation12 Time series data may be derived with a variety of techniques, including electroencephalography (EEG), magnetoencephalography (MEG), and functional magnetic resonance imaging (fMRI), and can be computed in a number of ways, including as cross-correlation, mutual information, or spectral coherence. While the presence of a statistical relationship between two neural elements is often taken as a sign of functional coupling, it must be noted that the presence of such coupling does not imply a causal relationship.Citation14 Functional connectivity is highly time-dependent, often changing in a matter of tens or hundreds of milliseconds as functional connections are continually modulated by sensory stimuli and task context. Even when measured with techniques that operate with a slow sampling rate such as fMRI, functional connectivity may exhibit non-stationary fluctuations (see below).
Effective connectivity represents a third and increasinglyimportant mode of representing and analyzing brain networks.Citation11,Citation15 Effective connectivity attempts to capture a network of directed causal effects between neural elements. As such it represents a generative and mechanistic model that accounts for the observed data, selected from a range of possible models using objective criteria like the model evidence. Recent developments in this area include approaches towards “network discovery”Citation16,Citation17 involving the identification of graph models for effective connectivity that best explain empirical data. While effective connectivity bears much promise for the future, most current studies of brain networks are still carried out on either structural or functional connectivity data sets, and hence these two modes of connectivity will form the main focus of this review.
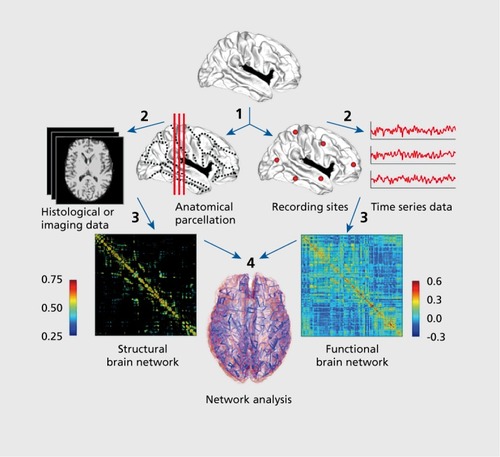
Within the formal framework of graph theory, a graph or network comprises a set of nodes (neural elements) and edges (their mutual connections). Structural and/or functional brain connectivity data recorded from the human brain can be processed into network form by following several steps, starting with the definition of the network's nodes and edges (). This first step is fundamental for deriving compact and meaningful descriptions of brain networks.Citation18,Citation19 Nodes are generally derived by parcellating cortical and subcortical gray matter regions according to anatomical borders or landmarks, or by defining a random parcellation into evenly spaced and sized voxel clusters. Once nodes are defined, their structural or functional couplings can be estimated, and the full set of all pairwise couplings can then be aggregated into a connection matrix. To remove inconsistent or weak interactions, connection matrices can be subjected to averaging across imaging runs or individuals, or to thresholding.
The resulting networks can be examined with the tools and methods of network science. One approach is based on graph theory and offers a particularly large set of tools for detecting, analyzing, and visualizing network architecture. A number of surveys on the application of graph theory methods in neuroscience are available.Citation13,Citation20-Citation25 An important part of any graph-theoretical analysis is the comparison of measures obtained from empirical networks to appropriately configured populations of networks representing a “null hypothesis.” A commonly used random null model is generated by randomizing the global topology of a network while preserving local node statistics, most importantly the graph's degree sequence.
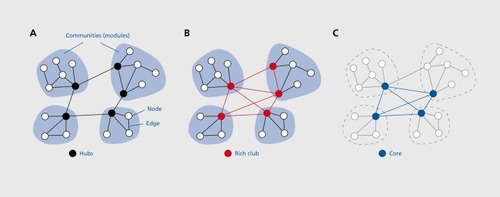
illustrates a selection of graph measures that are widely used in studies of human brain networks. Based on the insights they deliver, they can be classified into measures reporting on aspects of segregation, integration, and influence.Citation13 Segregation (or specialization) refers to the degree to which a network's elements form separate cliques or clusters. Integration refers to the capacity of the network as a whole to become interconnected and exchange information. Influence measures report on how individual nodes or edges are embedded in the network and the extent to which they contribute to the network's structural integrity and information flow.
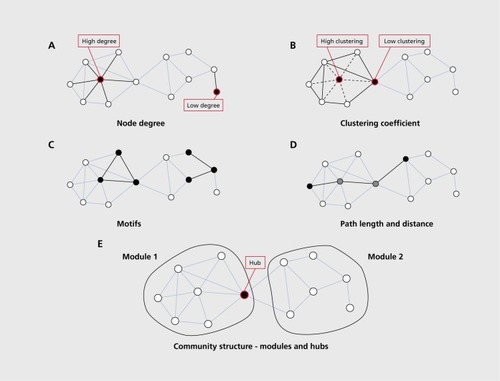
An important measure of segregation is the clustering coefficient of a given node, essentially measuring the density of connections among a node's topological neighbors. If these neighbors are densely interconnected they can be said to form a cluster or clique, and they are likely to share specialized information. The average of clustering coefficients over all nodes is the clustering coefficient of the network, often used as a global metric of the network's level of segregation. Another aspect of connectivity within local (ie, topologically connected) sets of network nodes is provided by the analysis of network motifs, constituting subgraphs or “building blocks” of the network as a whole.Citation26 Every network can be uniquely decomposed into a set of motifs of a given size, and the distribution of different motifs can reveal which subgraphs occur more frequently than expected, relative to an appropriate null model.
Measures of integration are generally based on the concept of communication paths and their path lengths. A path is any unique sequence of edges that connects two nodes with one another, and its length is given by the number of steps (in a binary graph) or the sum of the edge lengths (in a weighted graph). The length of the shortest path between each pair of nodes corresponds to their distance (also often referred to as the “shortest path length”), and the global average of all distances across the entire network is called the network's characteristic path length. Closely related to this measure is the global network efficiency, which is computed as the average of the inverse of all distances.Citation27 One can see easily that the global efficiency of a fully connected network would be maximal (equal to one) while the global efficiency of a completely disconnected network would be minimal (equal to zero). Short path lengths promote functional integration since they allow communication with few intermediate steps, and thus minimize effects of noise or signal degradation.
Measures of influence attempt to quantify the “importance” of a given node or edge for the structural integrity or functional performance of a network. The simplest index of influence is the node degree, and in many (but not all) cases the degree of a node will be highly correlated with other more complex influence measures. Many of these measures capture the “centrality” of network elements, for example expressed as the number of short communication paths that travel through each node or edge.Citation28 This measure of “betweenness centrality” is related to communication processes, but is also often found to be highly correlated with the related measure of “closeness,” quantifying the proximity of each node to the rest of the network. Another class of influence measures is based on the effect of node or edge deletion on short communication paths or network dynamics. For example, vulnerability measures the decrease (or, in some cases, the increase) in global efficiency due to the deletion of a single node or edge.Citation29 The most central or influential nodes in a network are often referred to as “hubs,” but it should be noted that there is no unique way of detecting these hubs with graph theory tools. Instead, a conjunction of multiple influence measures (eg, degree, betweenness, vulnerability) should be used when attempting to identify hub nodes.Citation30
While measures of segregation, integration, and influence can express structural characteristics of a network from different perspectives, recent developments in characterizing network communities or modules can potentially unify these different perspectives into a more coherent account of how a given network can be decomposed into modules (segregation), how these modules are interconnected (integration), and which nodes or edges are important for linking modules together (influence). Community detection is an extremely active field in network science.Citation31 A number of new community detection techniques have found applications in the analysis of structural and functional brain networks. One of the most commonly- used community detection algorithms is based on Newman's Q-metricCitation32 coupled with an efficient optimization approach.Citation33 Another approach called InfomapCitation34 identifies communities on the basis of a model of a diffusive random walk, essentially utilizing the fact that a modular network restricts diffusion between communities. In contrast, the Q-metric essentially captures the difference between the actually encountered within-module density of connections compared with what is expected based on a corresponding random model, given a particular partitioning of the network into modules. Since combinatorics makes it impractical to examine all possible module partitions, an optimization algorithm is needed to identify the single partition for which the Q-metric is maximized.
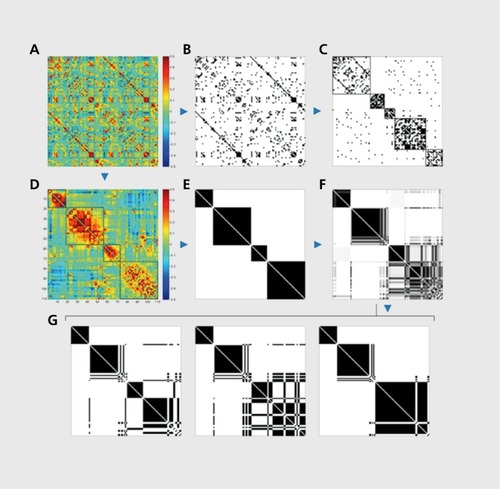
Several methodological issues have arisen in recent years that impact the way community detection is carried out in brain networks, particularly in networks describing functional connectivity (). The first issue concerns the widespread practice of thresholding functional networks to retain only a small percentage (often less than 10%) of the strongest functional connections. In addition, the remaining connections are then set to unit strength, resulting in a greatly sparsified binary network which is then subjected to standard graph analysis. Since the appropriate value of the threshold is a free and completely undetermined parameter, most practitioners vary the threshold across a broad range and then compute and compare graph metrics for the resulting networks. The practice of thresholding functional networks has two immediate consequences, a much sparser topology which then tends to result in more and more separate clusters or modules, and a topology that discards all (even strong) negative correlations. While the status of negative correlations in resting fMRI remains controversial,Citation35-Citation38 it could be argued that the presence of an anticorrelation between two nodes does contribute information about their community membership. Building on this idea, variants of the Q-metric and other related measures that take into account the full weight distribution of a network have been proposed.Citation39 These new metrics can also be applied to functional networks regardless of their density (including fully connected networks), thus eliminating the need for thresholding entirely.
The second issue relates to the optimization of the module partition given a cost or quality metric like Newman's Q. Studies of various real-world networks have shown that identifying the single optimal partition can not only be computationally difficult, but that many real networks can be partitioned at near-optimal levels in a number of different or “degenerate” ways;Citation40 Aggregating these degenerate solutions can provide additional information about the robustness with which a given node pair is affiliated with the same or a different module. This idea has been developed further into a quantitative approach called “consensus clustering.” Citation41 Consensus clustering has not yet been widely applied to brain networks,Citation39,Citation42 but it may soon become a useful tool since it provides information about the strength with which individual neural elements affiliate with their “home community.” An attractive hypothesis is that elements with generally weak affiliation are good candidates to assume functional roles as hub nodes that crosslink diverse communities.
The next three sections of the article will review our current knowledge about the network architecture of structural brain networks, how structural networks relate to functional networks in both rest and task conditions, and what we can learn by applying network approaches to clinical problems.
Mapping the network structure of the human brain
Due to the invasive nature of most classical anatomical methods like tract tracing, these methods cannot be applied to large samples of individual brains and they cannot be deployed in vivo, hence rendering tract tracing studies in human populations and relating structural network features to brain dynamics or behavior virtually impossible. Tract tracing has an important role to play for the study of anatomical connections in animal models, particularly in non-human primates,Citation43 and it is of vital importance for validating anatomical data derived from noninvasive imaging technology.Citation44 To the extent that such validation has been carried out, indications are that most projections identified by noninvasive imaging have counterparts in white matter fascicles described by classical anatomy.
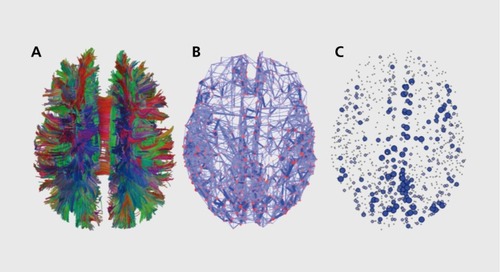
Most studies on human brain connectomics have been carried out by charting structural connections on the basis of data coming from diffusion MRI and tractography (). Citation45-Citation48 Diffusion MRI and traclography infer the spatial orientations and trajectories of bundles of myelinated axons traversing the brain's white matter, on the basis of measurements of the diffusion anisotropy of water or other small molecules within biological tissue. Importantly, diffusion imaging and tractography deliver inferential and statistical models of fiber anatomy but cannot directly trace or visualize anatomical connections. Methods for signal acquisition and fiber reconstruction are under continual development, with important recent advances in imaging complex (eg, intersecting) fiber architecture,Citation49,Citation50 and new algorithms for improved accuracy in inferring fiber pathways, including estimates of their uncertainty and evidence.Citation51,Citation52
Another area of important methodological development concerns the biological interpretation of connection weights resulting from aggregating fiber counts or probabilities into a connection matrix.Citation53,Citation54 New approaches for obtaining additional measures of white matter microstructure, eg, axonal diameters and packing densities,Citation55 will likely help to refine estimates of the weight, strength, and conduction velocity of individual long-distance projections.
The node degree (the number of connections attached at each node) is one of the most easily accessible graph measures and it is also highly informative, as is the distribution of node degrees across the whole network. Most, if not all, complex networks found in natural, especially biological, systems have been shown to have a broad degree distribution, with a small but important admixture of nodes that maintain considerably higher numbers of connections than most other nodes. In the human brain, node degrees appear to be distributed broadly, with some studies reporting exponential or exponentially truncated power-law distributions for node degree.Citation56-Citation59 Such broad (non-Gaussian, log-normal) degree distributions are also seen in tract tracing studies in cortex of nonhuman primates.Citation43
Virtually all studies of human brain networks have found evidence of small-world attributes,Citation60 generally measured as high clustering and a short path length, or alternatively as high local and global efficiency. The presence of small-world organization is indicative of a balance between anatomical and functional segregation on the one side (indexed by clustering and local efficiency) and the capacity for global integration on the other side (indexed by the prevalence of short communication paths and global efficiency). The brain appears to be one among many examples of small-world networks encountered in many different contexts, from social to technological to biological systems.Citation61 However, it should be noted that small-world attributes are not uniquely diagnostic of particular network architectures and can appear in a variety of connectivity models, including randomly rewired lattices, modular and even scale-free networks.
Closer analysis of brain networks has shown that high clustering is often due to the presence of modules, or network communities of densely interconnected neural elements. Such modules are collectives of elements that share common input and output projections, exhibit similar physiological responses and form coherent functional systems.Citation62 More recent studies have suggested that modularity of structural and functional brain networks extends across multiple scales, resulting in a hierarchy of nested “modules-within-modules,” Citation63,Citation64 a mode of organization encountered in other networks specialized for information-processing. In functional terms, modules allow for rapid and efficient sharing of information among brain regions that tend to contribute to a common set of tasks or responses, while promoting their functional specialization by creating boundaries that restrict the spread of information across the entire network. To ensure functional integration across modules requires specialized hub regions, generally identified by their high degree, high centrality, and diverse connection profiles that straddle the boundaries between modules.Citation30 Several studies of human structural brain networks have attempted to identify hubs, and most studies have converged on a set of regions including portions of the medial and superior parietal cortex as well as selected regions in orbitofrontal, superior frontal, and lateral prefrontal cortex.Citation56,Citation58 Many of these regions have been previously described as multi- or transmodal association areasCitation65 and exhibit complex physiological responses, diverse activation patterns across tasks, and widespread functional connectivity.Citation66 These physiological characterizations are consonant with their high centrality and structural embedding as connector hubs interlinking multiple modules.
Hubs perform important integrative roles in structural networks, but until fairly recently it has been unclear how they connect and interact with each other. Several early studies carried out in humans and other species had suggested a tendency for hubs to be densely interconnected in a “hub complex,” Citation30 or a structural core ().Citation56 Network studies in other disciplines have pointed to the existence of a “rich club,” a set of hub regions that are more densely interconnected than predicted by chance alone.Citation67 Rich clubs may be significant features of network architecture as they provide a structural substrate for integrating and disseminating information across the entire network. The first report on rich club organization came from a study of cat cerebral cortex, where a rich club of hub regions was found to form a densely interconnected core circuit cross-linking all major functional subsystems.Citation68 A detailed analysis of the topology of human brain structural connectivity acquired with diffusion imaging and tractography revealed a rich club of highly interconnected hub regions including portions of the superior frontal cortex, superior parietal cortex, and the precuneus, in addition to several subcortical regions including the thalamus, hippocampus, and part of the basal ganglia.Citation69 Graph analysis showed that 89% of all short communication paths among non-rich club regions across the network pass through the rich club, and that damage to pathways linking rich club regions to each other had a larger disruptive effect on network communication than equal amount of damage to connections among non-rich club regions.
Rich club organization has been confirmed and extended in subsequent studies focusing on the role of the rich club in brain communication,Citation70 its disruption in a mental disorder,Citation71 and its presence in the cerebral cortex of a non-human primate, the macaque monkey.Citation72 The latter study not only demonstrated rich club organization in a directed network of inter-regional projections derived from classical tract tracing studies, but also showed again that the rich club is interspersed between structural and functional communities. The macaque rich club contains several regions of association cortex that are homologues to rich club regions found in the human brain. The emerging picture of the organization of the human connectome is one of a modular small world network, with network communities that are interlinked by a coherent sub-network or core of hub regions whose position within the overall network is strongly suggestive of a central role in global information flow and integration. The implications of such a structural core or rich club for cognition and behavior have only begun to be explored.Citation73
An emerging trend in network analyses of human structural networks is to interpret network attributes not only in reference to network topology (which only considers the link structure of the network) but also in reference to the network's spatial embedding (which additionally considers the spatial positions of nodes and the lengths and trajectories of edges). This trend is fueled by the realization that many aspects of network topology are driven by the brain's spatial embedding which places tight constraints on the cost of building and maintaining networks, including wiring length and volume, metabolic energy used for signaling, and developmental mechanisms.Citation74 For example, a propensity of the network to exhibit high clustering may be due to greater network economy that is conferred by mostly short projections. Indeed, modules of structural brain networks are often spatially compact with member regions located in close physical proximity and linked by relatively short projections. But conservation of resources alone is insufficient to explain all aspects of brain network architecture. Long-distance projections have not only been evolutionarily conserved, they have been expanded in cases where their expansion has promoted increased network performance.Citation75 These findings suggest that the benefits brought by conserved network cost are balanced in a closely negotiated trade-off with the demands of network efficiency. Interesting questions for the future concern how this trade-off is instantiated in the healthy human brain and how its disturbance might contribute to brain and mental disorders (see below).
Dynamic brain networks
Ever since Hans Berger's first electrophysiological recordings, it has been recognized that the brain is never silent, but always engaged in apparently spontaneous and endogenously driven neural activity. While the investigation of endogenous neural dynamics has a long and illustrious history in the study of human EEG and MEG recordings, ongoing fluctuations in the brain's blood-oxygenation-level-dependent (BOLD) signal acquired with fMRI were long regarded as “background noise,” to be filtered and averaged away as an undesirable source of variability that obscured stimulus- and task-evoked neural responses. The discovery of structured correlations in spontaneous BOLD signals,Citation76 together with the realization that many attentiondemanding tasks were accompanied not only by regional activations but also by a consistent pattern of regional deactivations,Citation77 paved the way for a reconsideration of spontaneous brain activity as anatomically structured and physiologically meaningful. This reconsideration has ushered in a fundamental paradigm shift in human neuroimaging, away from thinking of the brain as a “reflexive organ,” whose responses are driven primarily by the momentary demands of the environment, and towards a new view that regards the brain's intrinsic dynamics as a dominant feature of its functional activity.Citation78,Citation79
Task-dependent deactivations in regions including the posterior cingulate/precuneus and medial prefrontal cortex led to the notion that increased activity among these regions during rest constituted the brain's “default mode,” Citation80 soon followed by the observation that resting BOLD fluctuations in these regions exhibited coherent inter-regional patterns of functional connectivity constituting a “default mode network.” Citation81 Other coherent resting-state networks were found to be associated with attention and cognitive control,Citation82-Citation84 and some of these networks were found to engage in anticorrelations.Citation36,Citation85 In parallel with studies that primarily examined specific networks revealed by seed-based patterns of whole-brain functional connectivity, an increasing number of studies attempted to decompose whole-brain resting-state fMRI recordings into independent components or communities,Citation86-Citation88 drawing on a variety of clustering, dimension reduction and network analysis techniques. Recent comprehensive surveys have shown that resting-brain dynamics can be broken down into a relatively small set of “resting-state networks” (RSNs).Citation89-Citation91 Some of these networks are primarily composed of regions that, on the basis of their task-evoked responses, can be regarded as either sensory or motor, while others such as the default mode network, the dorsal/ventral attention network and the frontoparietal network comprise sets of regions that exhibit a wide range of responses to more complex multimodal stimuli and tasks.
Despite the cognitively unconstrained nature of the “resting state” (an issue that once gave rise to contentious discussion about its relevance for studying brain functionCitation92), resting brain fluctuations and resting-state networks form largely consistent topographical patterns across individual subjectsCitation93 as well as scanning sessionsCitation94,Citation95 and imaging centers.Citation96 While the global arrangement of these patterns remains largely unchanged during global state transitions such as waking and sleepingCitation97 or other states of consciousness,Citation98 some functional connections exhibit experience-dependent modifications for example in response to specific sensorimotor training.Citation99,Citation100 RSNs are not unique to humans, and have also been described in macaque monkeyCitation101 as well as in the rodent brain.Citation102
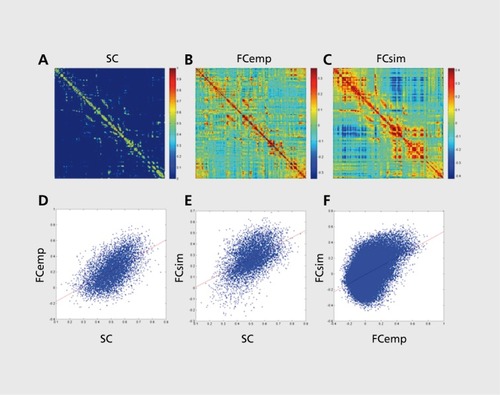
The reproducibility of RSN topography strongly suggests an anatomical basis in the brain's structural connection patterns, the connectome.Citation103 Hiis idea was explored in neurocomputational models that pointed to a relationship between an anatomical coupling matrix of inter-regional projections and emergent patterns of functional connectivity resulting from spontaneous neural dynamics unfolding within this coupling matrix.Citation104 Empirical studies in nonhuman primates showed significant overlap between anatomical projections mapped by tract tracing studies and resting-state functional connections.Citation101,Citation105,Citation106 Studies carried out in humans combining diffusion imaging /tractography and resting-state fMRI recordings obtained within the same cohort of participants also documented a robust statistical relationship between structural and functional connectivity (). Citation56,Citation95,Citation107 Other studies examined anatomical connections in relation to functional RSNs demonstrating that functionally coherent networks were linked by anatomical projections.Citation108,Citation109 More detailed network analyses of structural and functional connectivity revealed that while functional connectivity reflected the underlying structural networks, the relation between structural and functional connections was non-trivial and complex. For example, many strong functional connections were observed among pairs of regions that were not linked by a direct structural projection. Network models strongly suggest that all functional connections reflect a combination of numerous dynamic influences traveling through the network along many paths, most of them indirect paths that take multiple intermediate steps.
An anatomical basis for the organization of dynamic brain fluctuations into RSNs is compatible with the related idea that RSNs represent the result of strengthening and weakening of connections due to a history of co-activation and common recruitment during task-evoked activity.Citation19,Citation110 This proposal suggests that patterns of functional connectivity expressed during rest recapitulate co-activation patterns expressed across many tasks, with the strengths among regions modified through a mechanism akin to Hebbian plasticity. This mechanism of plasticity further sculpts and shapes the efficiency of the underlying anatomical substrate, essentially tailoring RSN configurations to reflect individual history and experience. Indeed, task-evoked patterns of coactivation are robustly related to functional connectivity observed in the resting brain,Citation111,Citation112 lending support to the notion that the resting brain cycles through or rehearses patterns of co-activation that are at other times purposefully deployed in response to varying stimulus and task contexts. This idea of rehearsal or recapitulation implies that spontaneous brain activity displays fine-grained temporal structure on time scales that are considerably shorter than the several minutes typically required for sampling stable and consistent patterns of resting-state functional connectivity.
The idea that the “resting state” is less a state, but rather a dynamic spatiotemporal pattern, was first encountered and explored in computational models of resting brain activity.Citation104 The inherently irregular and chaotic dynamics generated at each cortical region gave rise to fluctuations in their inter-regional coupling that spanned several time scales, including slow variations in coupling strength over the course of seconds to minutes. These slow changes occurred even in the absence of any endogenous or exogenous drive. These findings have been confirmed and extended in a series of computational studies revealing the critical role of noise and dynamic instability in inducing spontaneous fluctuations of resting brain activity.Citation113-Citation116 An emerging theoretical idea is that of a “functional repertoire” of network states that is continually revisited and rehearsed in the course of noise-driven endogenous neural activity.Citation117,Citation118
In line with these computational observations, recent empirical studies carried out in human, macaque, and rat brainCitation119-Citation125 have shown that functional couplings among remote brain regions can indeed exhibit non-stationarities in coupling strength, manifesting as slow variations in functional connectivity and hence in the topology of functional networks across time. The relation of these slow network dynamics to cognitive processes, their relation to much faster non-stationarities in synchronization patterns measured with EEGCitation126,Citation127 and MEG,Citation128 and their potential significance for clinical studies remain to be explored.
Over the past few years, network studies of the brain's structural connections as well as resting or task-evoked functional connectivity have delivered a wealth of insights into brain organization and integrative function. Increasingly, network measures are deployed to characterize patterns of developmentCitation129-Citation133 and individual differences within cohorts of healthy participants.Citation134 The mapping of individual network differences is a principal goal of the Human Connectome ProjectCitation135,Citation136 which aims at drawing relations between network structure and dynamics on the one side, and patterns of heritability, behavior, and genomic variations on the other. These studies will allow, for the first time, to construct an overview of the range of variability in network organization across the human population. An important additional step, which is already pursued in a growing number of recent and ongoing studies of brain networks, involves identifying network correlates of brain and mental disorders.
Clinical applications
So far, this review has focused on how network approaches can become useful tools for understanding and characterizing the structure and function of the intact, healthy brain. However, a major promise of human connectomics is that it will lead to a deeper understanding of the biological substrates underlying brain and mental disorders,Citation137-Citation140 including their genetic bases.Citation141 The primary aim of human connectomics is to map patterns of structural brain connectivity and uncover their relationship to emerging patterns of brain dynamics. Disturbed interactions among brain regions have been shown to be associated with virtually all brain and mental disorders, as well as with brain injury and recovery. A comprehensive treatment of disturbances of network organization in the diseased and damaged brain is beyond the scope of the present review. An instructive example of how studies of connectivity have begun to illuminate disease processes is provided by recent studies of schizophrenia.
Schizophrenia is a severe and partly heritable psychiatric disorder characterized by a number of symptoms generally leading to a loss of integration across several domains of cognition and mental function, and impacting social interactions, emotional and thought processes. Ever since Eugen Bleuler coined the term “schizophrenia” noting that the disorder seems to interrupt “the thousands of associative threads which guide our thinking,” Citation142 the condition has been thought to involve the disturbance or “disconnection” of connectivity in the brain.Citation143 Rather than involving a net loss of connections, the disorder is now more commonly thought to be associated with “dysconnectivity,” an abnormal pattern of connections among distinct brain regions that may involve both the strengthening and weakening of pathways and result in altered functional integration.Citation144 In recent years, numerous studies deploying the full range of electrophysiological and imaging techniques have documented system-wide as well as topographically specific disruptions of structural and functional brain connections.Citation145,Citation146 Among the structural pathways that are consistently found to be disturbed are connections linking portions of the frontal and temporal lobes.Citation147,Citation148
Studies of effective connectivity in controls and patients with schizophrenia conducted in the course of a working memory task have additionally revealed a selective impairment of effective connections between parietal and prefrontal regions.Citation149
Going beyond studies of single regions or pathways, a number of whole-brain connectivity analyses have demonstrated that schizophrenia is associated with the disruption of extended brain networks. Resting-state fMRI analyses in patients with schizophrenia have shown that functional connectivity within the default mode network is selectively disturbed in patients with schizophrenia.Citation150,Citation151 Other studies have shown regionally specific and yet widespread patterns of functional dysconnectivityCitation152, eg, involving both stronger and weaker couplings of the dorsolateral prefrontal cortex with other regions across the brain,Citation150 as well as selectively impaired functional connectivity between components of RSNs involved in cognitive control.Citation153 Diffusion MRI and tractography have shown that connectivity deficits involving frontal and temporal brain regions result in reduced centrality of prominent brain hubs and a less centrally integrated network architecture.Citation154 A different study also found reduced structural connectivity in patients with schizophrenia, as well as disturbances in the centrality of hub regions, for example in the medial frontal and left temporal lobe,Citation155 Both studies pointed to a reduction in global network efficiency, a potential index of impaired functional integration. More recently, network analysis of structural brain connectivity has shown a selective disturbance of pathways cross-linking regions forming the brain's rich club,Citation71 a collective of highly connected and densely linked nodes.Citation69 Given its central role in brain communication, an impairment of rich club connections is likely to manifest in functional disturbances of integrative neural processing.
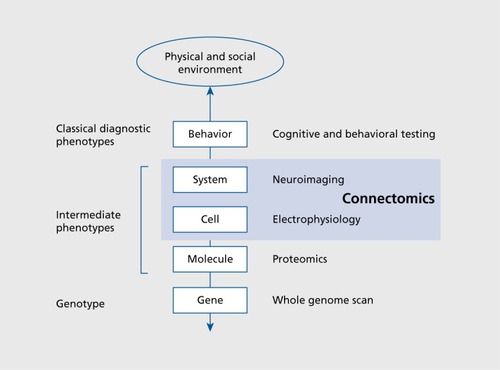
The complexity of the genetic basis for most common brain and mental diseases in conjunction with their pronounced phenotypic heterogeneity greatly complicates any systematic attempts at mapping genetic risk factors to clinical disorders, and even hinders their objective characterization on the basis of biologically based criteria. It has been suggested that the study of intermediate phenotypes, occupying positions that are intermediate between genetics and clinical phenotypes, may represent a promising way forward ().Citation156,Citation157 Intermediate phenotypes may allow for an objective classification of heterogeneous phenotypes into more coherent subgroups, and thus allow a better understanding of which genetic or other biological factors participate in each subgroup's disease mechanisms. The connectome and its endogenous and task-driven dynamics is an attractive candidate for an intermediate phenotype as it represents a point of convergence for a multitude of genetic and environmental factors, while also offering a plethora of potential “biomarkers” or probes that have proven to be of value in characterizing disease states of the brain. As brain network approaches continue to mature, it is to be expected that much work will focus on developing network measures that can characterize healthy and abnormal variations in brain structure and function. Such measures may help to identify factors that are associated with genetic and environmental disease mechanisms, and they may also serve as potential biomarkers for more objective diagnosis and prediction of effective treatment options. There is great potential for learning about disease states by mapping variations in network architecture in large cohorts of healthy participants, a chief goal of the Human Connectome Project. Understanding the “normal” range of variability will provide insight into how disease phenotypes differ. It has been suggested that brain and mental disorders (indeed many common human diseases) represent quantitative rather than qualitative deviations from health.Citation158,Citation159 Rather than being caused by the presence or absence of single genetic factors, it appears that many common diseases, including those affecting brain and mind, manifest through the accumulation of small effects contributed by numerous genetic variantsCitation160,Citation161 and thus represent quantitative traits that form the extremes of otherwise continuous phenotypic distributions. How various measures of brain networks relate to such phenotypic traits is still largely unknown. As more data on the network architecture of healthy and diseased brains becomes available, it will become possible to test the intriguing idea that metrics of connectivity can define new ways of classifying and inter-relating common mental disorders.
Outlook
The study of brain networks is still in its infancy. The development of new analytic techniques and modeling approaches, in parallel with continued methodological refinements in the area of human neuroimaging, continue to allow ever more detailed analyses of human structural and functional networks. Graph methods have proven useful for capturing how networks vary across individuals, how they change with experience, how they evolve across the human life span, and why they fail in a variety of brain and mental disorders. In the immediate future, some important areas of research will likely focus on structure function relationships, leading to a better understanding of how structural networks give rise to rich and flexible neural dynamics. Another promising area involves the analysis of network dynamics, the ever-changing topology of brain networks that are endogenously generated and modulated by stimuli and the environment. Studies of how networks change in the course of early development will likely stimulate new approaches towards mapping individual cognitive and behavioral developmental trajectories. Studies of networks may also prove important in the context of neurodegenerative disorders such as Alzheimer's disease, contributing to the as-yet elusive goal of developing better diagnoses and treatment options.
Whatever the future may bring the convergence of new technologies for observing the structure and function of the human brain with new analysis and modeling methods for the study of complex networks will almost certainly continue to bring change to the field. The new science of networks may provide a much needed theoretical framework for uniting empirical and computational studies of the nervous systems at all scales, from neurons to systems. Along the way, we may finally uncover the principles of network organization that account for the human brain's astonishing computational power, flexibility, and robustness.
The author's research was supported by the JS McDonnell Foundation.
REFERENCES
- FristonKJ.Modalities, modes, and models in functional neuroimaging.Science.200932639940319833961
- BandettiniPA.Functional MRI: a confluence of fortunate circumstances.Neuroimage.201261A3A11
- NewmanMEJ.Networks. Oxford, UK: Oxford University Press.2010
- EstradaE.The Structure of Complex Networks. Oxford, UK: Oxford University Press.2012
- SpornsO.ChialvoD.KaiserM.HilgetagCC.Organization, development and function of complex brain networks.Trends Cogn Sci.2004841842515350243
- BullmoreE.BarnesA.BassettDS.et alGeneric aspects of complexity in brain imaging data and other biological systems.Neuroimage.2009471125113419460447
- SpornsO.Networks of the Brain. Cambridge, MA: MIT Press.2011
- BassettDS.GazzanigaMS.Understanding complexity in the human brain.Trends Cogn Sci.20111520020921497128
- SpornsO.TononiG.KötterR.The human connectome: a structural description of the human brain.PLoS Comput Biol.20051245251
- SpornsO.Discovering the Human Connectome. Cambridge, MA: MIT Press.2012
- FristonKJ.Functional and effective connectivity: a review.Brain Connectivity.20111133622432952
- SmithSM.The future of FMRI connectivity.Neuroimage.2012621257126622248579
- RubinovM.SpornsO.Complex network measures of brain connectivity: uses and interpretations.Neuroimage.2010521059106919819337
- SmithSM.MillerKL.Salimi-KhorshidiG.et alNetwork modeling methods for FMRI.Neuroimage.20115487589120817103
- Valdes-SosaPA.RoebroeckA.DaunizeauJ.FristonK.Effective connectivity: influence, causality and biophysical modeling.Neuroimage.20115833936121477655
- FristonKJ.LiB.DaunizeauJ.StephanKE.Network discovery with DCM.Neuroimage.2011561202122121182971
- SeghierML.FristonKJ.Network discovery with large DCMs.Neuroimage.20136818119123246991
- BullmoreE.SpornsO.Complex brain networks: graph theoretical analysis of structural and functional systems.Nat Rev Neurosci.20091018619819190637
- WigGS.SchlaggarBL.PetersenSE.Concepts and principles in the analysis of brain networks.Ann N Y Acad Sci.2011122412614621486299
- StamCJ.ReijneveldJC.Graph theoretical analysis of complex networks in the brain.Nonlinear Biomed Phy.200713
- GuyeM.BettusG.BartolomeiF.CozzonePJ.Graph theoretical analysis of structural and functional connectivity MRI in normal and pathological brain networks.Magn Reson Mater Phy.201023409421
- WangJ.ZuoX.HeY.Graph-based network analysis of resting-state functional MRI.Front Syst Neurosci.201041620589099
- BullmoreET.BassettDS.Brain graphs: graphical models of the human brain connectome.Annu Rev Clin Psychol.2011711314021128784
- KaiserM.Tutorial in connectome analysis: topological and spatial features of brain networks.Neuroimage.20115789290721605688
- StamCJ.van StraatenECW.The organization of physiological brain networks.Clin Neurophysiol.20121231067108722356937
- MiloR.Shen-OrrS.ItzkovitzS.et alNetwork motifs: simple building blocks of complex networks.Science.200229882482712399590
- LatoraV.MarchioriM.Efficient behavior of small-world networks.Phys Rev Lett.20018719870111690461
- FreemanLC.A set of measures of centrality based on betweenness.Sociometry.1977403541
- LatoraV.MarchioriM.Vulnerability and protection of critical infrastructures.Phys Rev E.200471015103
- SpornsO.HoneyCJ.KötterR.Identification and classification of hubs in brain networks.PLoS ONE.20072e104917940613
- FortunatoS.Community detection in graphs.Phys Rep.201048675174
- NewmanMEJ.GirvanM.Finding and evaluating community structure in networks.Phys Rev E.200469026113
- BlondelV.GuillaumeJL.LambiotteR.LefebvreE.Fast unfolding of communities in large networks.J Stat Mech.2008xxP10008
- RosvallM.BergstromCT.An information-theoretic framework for resolving community structure in complex networks.Proc Natl Acad Sci U S A.20071047327733117452639
- MurphyK.BirnRM.HandwerkerDA.JonesTB.BandettiniPA.The impact of global signal regression on resting state correlations: are anti-correlated networks introduced?Neuroimage.20094489390518976716
- FoxMD.ZhangD.SnyderAZ.RaichleME.The global signal and observed anticorrelated resting state brain networks,J Neurophysiol.20091013270328319339462
- ColeDM.SmithSM.BeckmannCF.Advances and pitfalls in the analysis and interpretation of resting-state FMRI data.Front Syst Neurosci.20104820407579
- ChaiXJ.CastañónAN.ÖngürD.Whitfield-GabrieliS.Anticorrelations in resting state networks without global signal regression.Neuroimage.2012591420142821889994
- RubinovM.SpornsO.Weight-conserving characterization of complex functional brain networks.Neuroimage.2011562068207921459148
- GoodBH.de MontjoyeYA.ClausetA.Performance of modularity maximization in practical contexts.Phys Rev E.201081046106
- LancicinettiA.FortunateS.Consensus clustering in complex networks.SciRep. 20122336
- BassettDS.PorterMA.WymbsNF.GraftonST.CarlsonJM.MuchaPJ.Robust detection of dynamic community structure in networks. Available at: http://arxiv.Org/abs/1206.4358.2012.
- MarkovNT.MiseryP.FalchierA.et alWeight consistency specifies regularities of macaque cortical networks.Cereb Cortex.2011211254127221045004
- SchmahmannJD.PandyaDN.WangR.et alAssociation fibre pathways of the brain: parallel observations from diffusion spectrum imaging and autoradiography.Brain.200713063065317293361
- BasserPJ.MattielloJ.LeBihanD.MR diffusion tensor spectroscopy and imaging.Biophys J.1994662592678130344
- LeBihanD.ManginJF.PouponC.et alDiffusion tensor imaging: concepts and applications.J Magn Res Imaging.200113534546
- Johansen-BergH.RushworthMFS.Using diffusion imaging to study human connectional anatomy.Annu Rev Neurosci.200932759419400718
- BehrensTEJ.SpornsO.Human connectomics.Curr Opin Neurobiol.20122214415321908183
- TuchDS.ReeseTG.WiegellMR.WedeenVJ.Diffusion MRI of complex neural architecture.Neuron.20034088589514659088
- WedeenVJ.HagmannP.TsengWY.ReeseTG.WeisskoffRM.Mapping complex tissue architecture with diffusion spectrum magnetic resonance imaging.Magn Reson Med.2005541377138616247738
- BehrensTEJ.WoolrichMW.JenkinsonM.et alCharacterization and propagation of uncertainty in diffusion-weighted MR imaging.Magn Reson Med.2003501077108814587019
- BehrensTEJ.Johansen-BergH.JbabdiS.RushworthMFS.WoolrichMW.Probabilistic diffusion tractography with multiple fibre orientations: what can we gain?Neuroimage.20073414415517070705
- JbabdiS.Johansen-BergH.Tractography: where do we go from here?Brain Connectivity.2011116918322433046
- JonesDK.KnöscheTR.TurnerR.White matter integrity, fiber count, and other fallacies: the do's and don'ts of diffusion MRI.Neuroimage. 2013;doi:10.1016/j.neuroimage. 2012.06.081.
- AlexanderDC.HubbardPL.HallMG.et alOrientationally invariant indices of axon diameter and density from diffusion MRI.Neuroimage.2010521374138920580932
- HagmannP.CammounL.GigandetX.et alMapping the structural core of human cerebral cortex.PLoS Biol.20086e15918597554
- Iturria-MedinaY.SoteroRC.Canales-RodriguezEJ.Alemán-GomezY.Melie-GarciaL.Studying the human brain anatomical network via diffusion-weighted MRI and graph theory.Neuroimage.2008401064107618272400
- GongG.HeY.ConchaL.et alMapping anatomical connectivity patterns of human cerebral cortex using in vivo diffusion tensor imaging tractography.Cereb Cortex.20091952453618567609
- ZaleskyA.FornitoA.HardingIH.et alWhole-brain anatomical networks: does the choice of nodes matter?Neuroimage.20105097098320035887
- BassettDS.BullmoreET.Small world brain networks.Neuroscientist.20061251252317079517
- WattsDJ.StrogatzSH.Collective dynamics of “small-world” networks.Nature.19983934404429623998
- HilgetagCC.KaiserM.Clustered organization of cortical connectivity.Neuroinformatics.2004235336015365196
- MeunierD.LambiotteR.FornitoA.ErscheKD.BullmoreET.Hierarchical modularity in human brain functional networks.Front Neuroinf.2009337
- BassettDS.BrownJA.DeshpandeV.CarlsonJM.GraftonST.Conserved and variable architecture of human white matter connectivity.Neuroimage.2010541262127920850551
- MesulamMM.From sensation to cognition.Brain.1998121101310529648540
- ColeMW.YarkoniT.Repov_G.AnticevicA.BraverTS.Global connectivity of prefrontal cortex predicts cognitive control and intelligence.J Neurosci.2012328988899922745498
- ColizzaV.FlamminiA.SerranoMA.VespignaniA.Detecting rich-club ordering in complex networks. WatPhys.20062110115
- Zamora-LópezG.ZhouC.KurthsJ.Cortical hubs form a module for multisensory integration on top of the hierarchy of cortical networks.Front Neuroinform.20104120428515
- van den HeuvelMP.SpornsO.Rich-club organization of the human connectome.J Neurosci.201131157751578622049421
- van den HeuvelMP.KahnRS.GoñiJ.SpornsO.A high-cost, high-capacity backbone for global brain communication.Proc Natl Acad Sci U S A.2012109113721137722711833
- van den HeuvelMP.SpornsO.CollinG.et alAbnormal rich club organization and functional brain dynamics in schizophrenia.JAMA Psychiatry.20137078379223739835
- HarrigerL.van den HeuvelM.SpornsO.Rich club organization of macaque cerebral cortex and its role in network communication.PLoS ONE.20127e4649723029538
- ShanahanM.The brain's connective core and its role in animal cognition.Phil Trans R Soc B.20123672704271422927569
- BullmoreE.SpornsO.The economy of brain network organization.Nat Rev Neurosci.20121333634922498897
- RillingJK.GlasserMF.PreussTM.et alThe evolution of the arcuate fasciculus revealed with comparative DTI.Nat Neurosci.20081142642818344993
- BiswalB.YetkinFZ.HaughtonVM.HydeJS.Functional connectivity in the motor cortex of resting human brain using echo-planar MRI.Magn ResonMed. 199534537541
- ShulmanGL.FiezJA.CorbettaM.et alCommon blood flow changes across visual tasks: II.Decreases in cerebral cortex. J Cogn Neurosci.19979648663
- RaichleME.A paradigm shift in functional brain imaging.J Neurosci.200929127291273419828783
- RaichleME.Two views of brain function.Trends Cogn Sci.20101418019020206576
- RaichleME.MacLeodAM.SnyderAZ.PowersWJ.GusnardDA.ShulmanGL.A default mode of brain function. ProcNatl Acad Sci USA.200198676682
- GreiciusMD.KrasnowB.ReissAL.MenonV.Functional connectivity in the resting brain: a network analysis of the default mode hypothesis.Proc Natl Acad Sci U S A.200310025325812506194
- ColeDM.SchneiderW.The cognitive control network: integrated cortical regions with dissociable functions.Neuroimage.20073734336017553704
- DosenbachNU.FairDA.MiezinFM.et alDistinct brain networks for adaptive and stable task control in humans.Proc Natl Acad Sci USA.2007104110731107817576922
- DosenbachNU.FairDA.CohenAL.SchlaggarBL.PetersenSE.A dual-networks architecture of top-down control.Trends Cogn Sci.2008129910518262825
- FoxMD.SnyderAZ.VincentJL.et alThe human brain is intrinsically organized into dynamic, anticorrelated functional networks.Proc Natl Acad Sci U S A.20051029673967815976020
- De LucaM.BeckmannCF.De StefanoN.MatthewsPM.SmithSM.fMRI resting state networks define distinct modes of long-distance interactions in the human brain.Neuroimage.2006291359136716260155
- FoxMD.RaichleM.Spontaneous fluctuations in brain activity observed with functional magnetic resonance imaging.Nat Rev Neurosci.2007870071117704812
- CalhounVD.KiehlKA.PearlsonGD.Modulation of temporally coherent brain networks estimated using ICA at rest and during cognitive tasks.Hum Brain Mapp.20082982883818438867
- YeoBTT.KrienenFM.SepulchreJ.et alThe organization of the human cerebral cortex estimated by functional connectivity.J Neurophysiol.20111061125116521653723
- DoucetG.NaveauM.PetitL.et alBrain activity at rest: a multiscale hierarchical functional organization.J Neurophysiol.20111052753276321430278
- PowerJD.CohenAL.NelsonSM.et alFunctional network organization of the human brain.Neuron.20117266567822099467
- MorcomAM.FletcherPC.Does the brain have a baseline? Why we should be resisting a rest.Neuroimage.20073710731082
- DamoiseauxJS.RomboutsSARB.BarkhofF.et alConsistent resting-state networks across healthy subjects.Proc Natl Acad Sci U S A.2006103138481385316945915
- ShehzadZ.KellyAMC.ReissPT.et alThe resting brain: unconstrained yet reliable.Cereb Cortex.2009192209222919221144
- HoneyCJ.SpornsO.CammounL.et alPredicting human resting-state functional connectivity from structural connectivity.Proc Natl Acad Sci U S A.20091062035204019188601
- BiswalBB.MennesM.ZuoXN.et alToward discovery science of human brain function.Proc Natl Acad Sci U S A.20101074734473920176931
- Larson-PriorLJ.ZempelJM.NolanTS.PriorFW.SnyderAZ.RaichleME.Cortical network functional connectivity in the descent to sleep.Proc Natl Acad Sci U S A.20091064489449419255447
- MhuircheartaighRN.Rosenorn-LanngD.WiseR.JbabdiS.RogersR.TraceyI.Cortical and subcortical connectivity changes during decreasing levels of consciousness in humans:a functional magnetic resonance imaging study using propofol.J Neurosci.2010309095910220610743
- LewisCM.BaldassareA.CommitteriG.RomaniGL.CorbettaM.Learning sculpts the spontaneous activity of the resting human brain.Proc Natl Acad Sci U S A.2009106175581756319805061
- TambiniA.KetzN.DavachiL.Enhanced brain correlations during rest are related to memory for recent experiences.Neuron.20106528029020152133
- VincentJL.PatelGH.FoxMD.et alIntrinsic functional architecture in the anaesthetized monkey brain.Nature.2007447838617476267
- WhiteBR.BauerAQ.SnyderAZ.SchlaggarBL.LeeJM.CulverJP.Imaging of functional connectivity in the mouse brain.PLoS ONE.20116e1632221283729
- HoneyCJ.ThiviergeJP.SpornsO.Can structure predict function in the human brain?Neuroimage.20105276677620116438
- HoneyCJ.KötterR.BreakspearM.SpornsO.Network structure of cerebral cortex shapes functional connectivity on multiple time scales.Proc Natl Acad Sci U S A.2007104102401024517548818
- AdachiY.OsadaT.SpornsO.et alFunctional connectivity between anatomically unconnected areas is shaped by collective network-level effects in the macaque cortex.Cereb Cortex.2012221586159221893683
- ShenK.BezginG.HutchisonRM.et alInformation processing architecture of functionally defined clusters in the macaque cortex.J Neurosci.201232174651747623197737
- SkudlarskiP.JagannathanK.CalhounVD.et alMeasuring brain connectivity: diffusion tensor imaging validates resting state temporal correlations.Neuroimage.20084355456118771736
- Van den HeuvelMP.MandlRCW.KahnRS.Hulshoff PolHE.Functionally linked resting-state networks reflect the underlying structural connectivity architecture of the human brain.Hum Brain Mapp.2009303127314119235882
- GreiciusMD.SupekarK.MenonV.DoughertyRF.Resting state functional connectivity reflects structural connectivity in the default mode network.Cereb Cortex.200919727818403396
- NelsonSM.CohenAL.PowerJD.et alA parcellation scheme for human left lateral parietal cortex.Neuron.20106715617020624599
- SmithSM.FoxPT.MillerKL.et alCorrespondence of the brain's functional architecture during activation and rest.Proc Natl Acad Sci U S A.2009106130401304519620724
- LairdAR.FoxPM.EickhoffSB.et alBehavioral interpretations of intrinsic connectivity networks.J Cogn Neurosci.2011234022403721671731
- GhoshA.RhoY.McintoshAR.KötterR.JirsaVK.Noise during rest enables the exploration of the brain's dynamic repertoire.PLoS Comput Biol.20084e100019618846206
- DecoG.JirsaV.McintoshAR.SpornsO.KötterR.Key role of coupling, delay, and noise in resting brain fluctuations.Proc Natl Acad Sci U S A.2009106103021030719497858
- CabralJ.HuguesE.SpornsO.DecoG.Role of local network oscillations in resting-state functional connectivity.Neuroimage.20115713013921511044
- DecoG.JirsaVK.MclntoshAR.Emerging concepts for the dynamical organization of resting-state activity in the brain.Nat Rev Neurosci.201112435621170073
- DecoG.CorbettaM.The dynamical balance of the brain at rest.Neuroscientist.20111710712321196530
- DecoG.JirsaVK.Ongoing cortical activity at rest: criticality, multistability, and ghost attractors.J Neurosci.2012323366337522399758
- ChangC.GloverGH.Time-frequency dynamics of resting-state brain connectivity measured with fMRI.Neuroimage.201050819820006716
- HutchisonRW.WomelsdorfT.GatiJS.EverlingS.MenonRS.Resting-state networks show dynamic functional connectivity in awake humans and anesthetized macaques.Hum Brain Mapping.2012DOI:10.1002/hbm.22058.
- HandwerkerDA.RoopchansinghV.Gonzalez-CastilloJ.BandettiniPA.Periodic changes in fMRI connectivity.Neuroimage.2012631712171922796990
- KeilholzS.MagnusonME.PanWJ.WillisM.ThompsonG.Dynamic properties of functional connectivity in the rodent.Brain Connectivity.20133314023106103
- JonesDT.VermuriP.MurphyMC.et alNon-stationarity in the “resting brain's” modular architecture.PLoS One.20127e3973122761880
- SmithSM.MillerKL.MoellerS.et alTemporally-independent functional modes of spontaneous brain activity. ProcNatl Acad Sci USA.201210931313136
- AllenEA.DamarajuE.PlisSM.et alTracking whole-brain connectivity dynamics in the resting state.Cereb Cortex.2012doi:10.1093/cercor/bhs352
- ChuCJ.KramerMA.PathmanathanJ.et alEmergence of stable functional networks in long-term human electroencephalography.J Neurosci.2012322703271322357854
- BetzelRF.EricksonMA.AbellM.O'DonnellBF.HetrickWP.SpornsO. Synchronization dynamics and evidence for a repertoire of network states in resting EEG.Front Comput Neurosci.201267423060785
- De PasqualeF.Delia PennaS.SnyderAZ.et alTemporal dynamics of spontaneous MEG activity in brain networks.Proc Natl Acad Sci U S A.20101076040604520304792
- FairDA.CohenAL.PowerJD.et alFunctional brain networks develop from a “local to distributed” organization.PLoS Comput Biol.20095e100038119412534
- SupekarK.MusenM.MenonV.Development of large-scale functional brain networks in children.PLoS Biol.20097e100015719621066
- PowerJD.FairDA.SchlaggarBL.PetersenSE.The development of human functional brain networks.Neuron.20106773574820826306
- HagmannP.SpornsO.MadanN.et alWhite matter maturation reshapes structural connectivity in the late developing human brain. ProcNatl Acad Sci U S A.20101071906719072
- HwangK.HallquistMN.LunaB.Development of hub architecture in the human functional brain network.Cereb Cortex.2012doi:10.1093/cercor/bhs227.
- VaidyaC.GordonEM.Phenotypic variability in resting-state functional connectivity: current status.Brain Connectivity.2013doi:10.1089/brain.2012.0110.
- Van EssenDC.UgurbilK.AuerbachE.et alThe Human Connectome Project: a data acquisition perspective.Neuroimage.2012622222223122366334
- Van EssenDC.UgurbilK.The future of the human connectome.Neuroimage.2012621299131022245355
- BassettDS.BullmoreET.Human brain networks in health and disease.Curr Opin Neurol.20092234034719494774
- BuckholtzJW.Meyer-LindenbergA.Psychopathology and the human connectome: toward a transdiagnostic model of risk for mental illness.Neuron.201274990100422726830
- ltturia-MedinaY.Anatomical brain networks on the prediction of abnormal brain states.Brain Connectivity.2013doi:10.1089/brain.2012.0122
- Hulshoff PolH.BullmoreE.Neural networks in psychiatry.Eur Neuropsychopharmacol.2013231623394870
- TostH.BilekE.Meyer-LindenbergA.Brain connectivity in psychiatric imaging genetics.Neuroimage.2012622250226022100419
- BleulerE.Dementia Praecox or the Group of Schizophrenias. New York, NY: International Universities Press.1950
- Pettersson-YeoW.AllenP.BenettiS.McGuireP.MechelliA.Dysconnectivity in schizophrenia: where are we now?Neurosci Biobehav Rev.2011351110112421115039
- StephanKE.BaldewegT.FristonKJ.Synaptic plasticity and dysconnection in schizophrenia.Biol Psychiatry.20065992993916427028
- CalhounVD.EicheleT.PearlsonG.Functional brain networks in schizophrenia: a review.Front Hum Neurosci.200931719738925
- FornitoA.ZaleskyA.PantelisC.BullmoreET.Schizophrenia, neuroimaging and connectomics.Neuroimage.2012622296231422387165
- Ellison-WrightI.BullmoreE.Meta-analysis of diffusion tensor imaging studies in schizophrenia.Schizophrenia Res.2009108310
- VoineskosAN.LobaughNJ.BouixS.et alDiffusion tensor tractography findings in schizophrenia across the adult lifespan.Brain.20101331494150420237131
- DesernoL.SterzerP.WüstenbergT.HeinzA.SchlagenhaufF.Reduced prefrontal-parietal effective connectivity and working memory deficits in schizophrenia.J Neurosci.201232122022219266
- GarrityAG.PearlsonGD.McKiernanK.LloydD.KiehlKA.CalhounVD.Aberrant “default mode” functional connectivity in schizophrenia.Am J Psychiatry.200716445045717329470
- Whitfield-GabrieliS.ThermenosHW.MilanovicS.et alHyperactivity and hyperconnectivity of the default network in schizophrenia and in first-degree relatives of persons with schizophrenia.Proc Natl Acad Sci U S A.20091061279128419164577
- ColeMW.AnticevicA.RepovsG.BarchD.Variable global dysconnectivity and individual differences in schizophrenia.Biol Psychiatry.201170435021496789
- RepovsG.CsernanskyJG.BarchDM.Brain network connectivity in individuals with schizophrenia and their siblings.Biol Psychiatry.20116996797321193174
- Van den HeuvelMP.MandlRCW.StamCJ.KahnRS.Hulshoff PolHE.Aberrant frontal and temporal complex network structure in schizophrenia: a graph theoretical analysis.J Neurosci.201030159151592621106830
- ZaleskyA.FornitoA.SealML.et alDisrupted axonal fiber connectivity in schizophrenia.Biol Psychiatry.201169808921035793
- Meyer-LindenbergA.WeinbergerDR.Intermediate phenotypes and genetic mechanisms of psychiatric disorders.Nat Rev Neurosci.2006781882716988657
- FornitoA.BullmoreET.Connectomic intermediate phenotypes for psychiatric disorders.Front Psychiatry.201233222529823
- HymanSE.The diagnosis of mental disorders: the problem of reification.Annu Rev Clin Psychol.2010615517917716032
- KendlerKS.AggenSH.KnudsenGP.et alThe structure of genetic and environmental risk factors for syndromal and subsyndromal common DSM-IV axis I and all axis II disorders.Am J Psychiatry.2011168293920952461
- PIominR.HaworthCMA.DavisOSP.Common disorders are quantitative traits.Nat Rev Genetics.20091087287819859063
- PurcellSM.WrayNR.StoneJL.et alCommon polygenic variation contributes to risk of schizophrenia and bipolar disorder.Nature.200946074875219571811
- SpornsO.The human connectome: a complex network.Ann N Y Acad Sci.2011122410912521251014
- SpornsO.The non-random brain: efficiency, economy, and complex dynamics.Front Comput Neurosci.20115521369354
- AlstottJ.BreakspearM.HagmannP.CammounL.SpornsO.Modeling the impact of lesions in the human brain.PLoS Comput Biol.20095e100040819521503
- BullmoreET.FletcherP.JonesPB.Why psychiatry can't afford to be neurophobic.Br J Psychiatry.200919429329519336776