
Abstract
The self-determination theory (SDT) distinguishes between intrinsic and extrinsic aspirations or life goals, which tend to fall into two separate constructs. The pursuit of intrinsic goals, relative to extrinsic ones, is associated with numerous cognitive, affective and behavioural outcomes that are considered to be positive for individuals as well as for society such as, for example, students’ school persistence. Developed by SDT researchers, the Aspiration Index has been widely explored. However, it has not previously been evaluated in Scandinavia. By means of confirmatory factor analysis and correlation analysis, the purpose of the current study was to examine the dimensionality, reliability, and construct validity of the Aspiration Index among health and social care students (N=415). The analysis revealed that a hypothesised second-order, two-factor model fits well with the observed data. The Aspiration Index also showed good reliability and construct validity in the present population of young people.
Introduction
The high dropout rate from upper secondary education, especially from vocational programmes, is considered a major problem in the Norwegian education system (Hagen and Dæhlen Citation2009; Kunnskapsdepartementet Citation2009). Within five years, 28% of vocational students drop out and only 55% complete their education, thereby achieving either general study competence or a trade certificate of apprenticeship. The remaining proportion is still in school or did not pass the exam in one or more subjects (Statistics Norway Citation2012). The high dropout rate affects the individual's life as well as society, which is in great need of skilled workers with a trade certificate of apprenticeship (Kunnskapsdepartementet Citation2012).
Dropout-related challenges appear in many European countries as well as in the USA, Canada and Australia (Organisation for Economic Co-operation and Development (OECD) Citation2012a). Vocational programmes are most exposed (Blöndal and Jónasson Citation2010; Lamb et al. Citation2011; Markussen Citation2010; Rinne and Jarvinen Citation2011; Rumberger Citation2011; Statistics Norway Citation2012). Many reasons are given in an attempt to explain the high dropout rate. Family background (e.g. socio-economic status and family structure), demographic factors (e.g. ethnicity and gender), individual attributes (e.g. health and self-esteem), and experiences in school (e.g. attitudes to school and academic achievements) are highlighted features (Lamb and Markussen Citation2011; Markussen et al. Citation2008; Ou and Reynolds Citation2008; Rumberger and Lim Citation2008; Rumberger Citation2011). For several reasons, many measures have been taken to improve students’ achievements, such as comprehensive reforms (Markussen and Sandberg Citation2011), greater flexibility between schooling and practical placement, and alternative educational pathways (Karlsen Citation2008; Kunnskapsdepartementet Citation2013; Markussen and Sandberg Citation2011).
Despite great efforts, the problem does not seem to have a solution. In Norway, as well as in several European countries, the dropout rate is quite stable at a high level (OECD 2012a; Statistics Norway Citation2012). It thus seems crucial to continue exploring factors that might support or hinder students in completing their education.
Little attention has been paid to the importance of students’ values in relation to the dropout issue (Eccles and Wigfield Citation2002; Rumberger Citation2011). The self-determination theory (SDT) proposes that life goals or aspirations refer to the long-term aims people value and strive for. Life goals are closely linked to values and may be considered as guiding principles of life, organising people's attitudes, emotions and behaviours, and typically endure across time and situations (Kasser Citation2002).
The Aspiration Index (AI) measures the content of people's life goals (Kasser and Ryan Citation1993, Citation1996). Several studies conducted in different countries in the last 20 years indicate that the pursuit of intrinsic aspirations, relative to extrinsic ones, is associated with various cognitive, affective and behavioural outcomes of interest. Examples of these outcomes are enhanced learning, performance, and persistence in the learning situation (Vansteenkiste, Lens and Deci Citation2006; Vansteenkiste et al. Citation2009; Vansteenkiste et al. Citation2008); better psychological health (Kasser and Ryan Citation1996, Citation2001; Niemiec, Ryan and Deci Citation2009); autonomous school motivation and perceived competence (Sheldon et al. Citation2004; Utvær Citation2013a); more voluntary helping behaviour (Sheldon and Kasser Citation1995); and less drug and alcohol use (Kasser and Ryan Citation2001).
Given that intrinsic aspirations have been positively associated with persistence and negatively associated with several indicators of dropout, such as lack of motivation and low coping (Markussen and Seland Citation2012; Rumberger and Lim Citation2008; Vallerand, Fortier and Guay Citation1997), mental health problems (Markussen and Seland Citation2012; OECDb; Rumberger Citation2011), as well as drug and alcohol abuse (Adalbjarndottir and Blöndal Citation2006; Rumberger Citation2011), valuing intrinsic goals might help prevent dropout. Therefore, a valid and reliable measure of students’ aspirations in an adolescent population might be useful for predicting persistence and dropout in upper secondary school.
The Aspiration Index (AI)
Early in the 1990, Ryan and his colleagues developed a mini-theory within the SDT, later termed Goal Content Theory, in order to explain that not all goals are created equal (Ryan et al. Citation1996; Vansteenkiste, Niemiec and Soenens Citation2010). The SDT theory proposes that some goals are related to well-being, whereas other goals are not (Kasser and Ryan Citation1993, Citation1996). This suggestion is based on knowledge of humans’ basic psychological needs for autonomy, relatedness and competence which are nutriments and essential to an individual's psychological growth (Deci and Ryan Citation2000). People need to feel that they freely choose their behaviours (autonomy), that they have close connections with others (relatedness), and that they are effective in the activities they are undertaking (competence). Goals are acquired developmentally through a process related to the satisfaction versus thwarting of those needs (Kasser Citation2002). When the innate needs for autonomy, relatedness and competence have been thwarted over time, people tend to adopt extrinsic goals that will lead to external indicators of worth rather than the internal feelings of worth resulting from need satisfaction. Therefore, extrinsic aspirations seem to be a need substitute providing little or no direct satisfaction of basic needs (Deci and Ryan Citation2008).
Kasser and Ryan (Citation1993, Citation1996) developed the AI and examined seven life goals that could be subsumed within a second-order factor analysis. Three of the life goals (wealth, fame and image) loaded on one factor and were termed extrinsic goals. Wealth assesses aspiration for financial and material success; fame comprises aspiration for social recognition; whilst image measures aspiration for an appealing appearance. These three goals were selected because they represented some of the most salient aspects of popular western cultures focusing on rewards and praise of others (ibid.). The other four life goals (personal growth, affiliation, community involvement, and physical fitness) loaded on another factor and were termed intrinsic goals. Personal growth assesses aspiration for self-acceptance; affiliation assesses aspiration concerning family life and good friends; community involvement includes aspirations for making the world a better place through one's action; and finally health assesses physical fitness. These four goals were chosen because they were congruent with the movement toward self-actualisation and integration (Kasser and Ryan Citation1996). It is worth noting that the AI does not intend to be an all-inclusive measurement of goals. Some goals (e.g. hedonism) are neither used to validate self-worth nor are they inherently growth promoting and cannot be classified as intrinsic or extrinsic (Grouzet et al. Citation2005; Vansteenkiste et al. Citation2010).
Support for the reliability of AI has been found by means of Cronbach's alpha (α). Generally, Cronbach's alpha coefficients around .90 are considered “excellent”, values around .80 are “very good”, and values around .70 are “adequate” (Kline Citation2011). In their first three studies among psychology students (mean age 20) and teenagers (mean age 18), Kasser and Ryan (Citation1993) included four goals; wealth represented extrinsic goals whereas personal growth, affiliation and community involvement represented intrinsic goals. In these studies, alpha ranged from .58 to .82, .71 to .82, and .54 to .71, respectively. In further research (Kasser and Ryan Citation1996), two studies among adults and undergraduates enrolled in a psychology course at a university were reported. Then three more goals were included (fame, image and physical fitness). In these two studies, alpha ranged between .59–.87 and .72–.89, respectively. For both studies, personal growth revealed the lowest alpha whereas community involvement and financial success showed the highest alpha. In a study investigating the factor structure of the AI across 15 cultures in the 1997–2000 period, the mean alpha ranged from .72 to .84. In these studies, the mean age ranged between 18.6–24.7 (Grouzet et al. Citation2005).
Support for construct validity has been found by means of higher-order confirmatory factor analysis (CFA) (Kasser and Ryan Citation1996). These factor-analytic results show a two-factor, higher-order solution and have been replicated using samples from many different countries, such as Germany (Schmuck, Kasser and Ryan 2000), Russia (Ryan et al. Citation1999), South Korea (Kim, Kasser and Lee Citation2003), and China (Tang, Kuang and Yao Citation2008). Using more refined descriptive techniques (viz., multidimensional scaling analysis), Grouzet and colleagues (Citation2005) observed the structure of intrinsic and extrinsic contents in a group of college students from 15 cultures around the world. The intrinsic and extrinsic higher-order factors have been shown to be correlated (r=.20 and r=.23) (Kasser and Ryan Citation1996).
In summary, dropout is a great challenge in several western countries, especially concerning vocational courses and tracks. Goals seem vital in research aiming to explore and explain the high dropout rate in upper secondary education. The SDT maintains that students’ pursuit of goals, closely related to the satisfaction versus thwarting of their innate, basic psychological needs, may explain school-related attitudes, emotions and behaviour (Deci and Ryan Citation2000). Even though the AI is widely explored, it has not previously been validated in Norway, or in Scandinavia. Moreover, the AI has mainly been validated among college students representing late adolescents or adults (Grouzet et al. Citation2005; Kasser and Ryan Citation1996; Tang et al. Citation2008). Studies among adults aged 18–85 have shown that chronological age was associated with relatively stronger intrinsic values (Kasser and Ryan Citation1996; Sheldon and Kasser Citation2001; Sheldon Citation2005). Thus, we found it appropriate to test the factor structure of the AI within a younger population attending a vocational programme. An investigation of the dimensionality, reliability and validity of the AI in this particular population might provide a further insight into the AI's stability and its psychometric properties.
Aims
The aim of the current study was to investigate the factor structure, reliability, and construct validity of the AI in a vocational student population. The research question was twofold: (a) How well does the two-factor second-order model of the AI fit with the observed data? (b) Does the two-factor second-order model reveal good reliability and construct validity?
The research questions focused on evidence based on internal structure and evidence based on relations with other variables according to the Standards for Educational and Psychological Testing (American Educational Research Association [AERA], the American Psychological Association [APA], and the National Council on Measurement in Education [NCME] Citation1999). The first examines the extent to which the internal components of a test match the defined constructs and is most often estimated by confirmatory factor analysis. One of the most commonly used approaches to test the relations with other variables is correlations between scores and external criterion variables obtained simultaneously or at a later date (AERA, APA and NCME Citation1999; Goodwin and Leech Citation2003).
In structuring the article, we distinguish between dimensionality, reliability and validity even though they are all interrelated measurement properties. A measure's dimensionality is concerned with the homogeneity of the items. A measure may be hypothesised as unidimensional, as multidimensional, and/or as a higher-order factor. When items tap more than one dimension or factor, the measure is considered to be multidimensional (Netemeyer, Bearden and Sharma 2003).
Reliability is concerned with that portion of a measurement that is due to permanent effects that persist from sample to sample. One type of reliability is internal consistency – the interrelatedness among items or sets of items on the scale. Cronbach's alpha (α) and composite reliability (ρ) are reliability coefficients for internal consistency (Netemeyer et al. Citation2003).
Construct validity refers to how well a measure actually measures the construct it is intended to measure (Netemeyer et al. Citation2003). According to the Standards for Educational and Psychological Testing (AERA, APA and NCME Citation1999), construct validity evidence is based, among others, on the construct's relationships to other variables (Goodwin and Leech Citation2003).
In this study, selected constructs associated with intrinsic and extrinsic life goals and school persistence were selected for assessing the construct validity. Intrinsic goals comprising personal growth and community involvement tend to be pursued for autonomous reasons whereas extrinsic goals comprising money and popularity tend to be pursued for controlled reasons (Deci and Ryan Citation2000; Sheldon et al. Citation2004). However, the content of and reasons for pursuing goals can be empirically crossed (Ryan, Huta and Deci Citation2008; Vansteenkiste et al. Citation2010). The pursuits of different goals and different types of motivation are, from a SDT view, acquired developmentally through a process related to satisfaction of the innate needs for autonomy, competence and relatedness (Deci and Ryan Citation2000). Thus, intrinsic goals are expected to be positively associated with students’ autonomous motivation and perceived competence, and negatively associated with amotivation, which indicates a lack of intention or motivation (Deci and Ryan Citation2000). How intrinsic goals relate to controlled motivation is left more open. Extrinsic goals, in contrast, are expected to be positively associated with students’ controlled motivation. In addition, extrinsic goals are not expected to have similar positive associations with autonomous motivation and perceived competence as intrinsic goals (Deci and Ryan Citation2000, Citation2008; Utvær Citation2013a, Citation2013b). Moreover, a positive correlation between intrinsic goals and persistence, both in the learning situation (Vansteenkiste, Lens and Deci Citation2006) and in a health and social care track (Utvær Citation2013b) have been found. Intrinsic goals are therefore expected to be positively associated with students’ confidence about the study programme they attend and, as a consequence, they are actually staying in school.
Methods
Participants
The participants in this study were first-year students in the vocational programme for Health and Social Care in upper secondary school. All schools (17 public, 1 private) in one county in mid-Norway participated; five (55% of the students) were urban schools and thirteen (45% of the students) were rural schools. The total sample comprised 467 (92%) of the 510 students in this vocational programme. Following the procedure of listwise deletion, the answers from 415 students were included in the analysis. Among these, 362 students were females (87%) and 53 were males (13%). The mean age of the students was 16.8 years (SD 1.38). Regarding ethnic background, 376 students had one or both parents who were born and grew up in Norway (91%), 11 were Western immigrants (3%), and 28 students were non-Western immigrants (7%).
Data collection
Students’ aspirations were assessed by means of the AI, which formed part of a questionnaire comprising 133 items. A pilot study was carried out in spring 2009 (N=64) while the study itself was conducted during autumn 2009. The students completed the questionnaire during a 45-minute regular class period. Students not present at class that day received a survey from their teacher the next time they came to class. A post-paid envelope was enclosed and the survey was returned to the first author. All participants were volunteers, anonymity was guaranteed, and they received no compensation.
The AI was translated into Norwegian by means of a competent bilingual English teacher at the first author's university. The Norwegian version was tested in the pilot study, representing the same population as the current study. It was important to test whether the translation and questions worked well. The health and social care students were approached with the AI, and asked to respond to the clarity, understandability, and the wording used during a class. Based on the pilot study, the AI measurement was further developed and improved. Some students found certain of the terms used difficult to understand, such as “committed relationships”. As a result, these terms were changed into more familiar expressions in the final version of the AI.
Measures
The Aspiration Index (AI) comprising 35 items was developed by Kasser and Ryan (Citation1993, Citation1996). The index assesses three extrinsic (wealth, fame, image) and four intrinsic (personal growth, community, affiliation, health) aspirations, each represented by five items. Sample items are as follows: Wealth: “To have many expensive possessions” and “To be rich”; Fame: “To be famous” and “To have my name appear frequently in the media”; Image: “To have people comment often about how attractive I look” and “To keep up with fashions in hair and clothing”; Personal growth: “To grow and learn new things” and “To know and accept who I really am”; Affiliation: “To have committed, intimate relationships” and “To feel that there are people who really love me, and whom I love”; Community: “To work for the betterment of society” and “To work to make the world a better place”; and finally Health: “To keep myself healthy and well” and “To have a physically healthy lifestyle”. The participants in the present study were asked to assess each of the 35 aspirations and to respond to the importance of each. Responses were made on a 7-point scale, ranging from 1 (not at all) to 7 (very much) with the number 4 representing a neutral response. The instrument measurement is presented in Appendix 1.
Different types of motivation were assessed using the Academic Motivation Scale (AMS) high school version (Grouzet, Otis and Pelletier 2006; Vallerand and Bissonnette Citation1992). This scale comprises seven sub-scales and assesses three types of intrinsic motivation (knowledge, accomplishment and stimulation), three types of extrinsic motivation (identified, introjected and external), and amotivation. Respondents were asked why they engage in various behaviours (e.g. why do students go to school?) and were provided with a list of reasons that represented the different regulatory styles. Each type of motivation includes four items, all rated on a 7-point scale, ranging from 1 (does not correspond at all) to 7 (corresponds very much). Respondents obtained a score for each type of motivation, which was then combined to form composites. In this article, intrinsic motivation for knowledge and identified regulation represent autonomous motivation, while introjected and external regulation represent controlled motivation. Amotivation represents a lack of motivation. The AMS has demonstrated good reliability and validity in several studies (Grouzet et al. Citation2006) including health and social care students (Utvær Citation2013b).
Perceived Competence was measured by two items: “I master this vocational education well” and “I cope well with the challenges I meet in the classroom”. The responses were indicated on a 7-point scale, ranging from 1 (not at all) to 7 (very much).
Confidence. Three items were designed by the first author to measure the degree to which the students were confident about the study programme they attended. The items were as follows: “I am very sure I have made the right choice for my study programme”, “My choice of programme is in accordance with my future life goals”, and “I am sure I will complete this year of school”. All responses were made on a 7-point scale, ranging from 1 (does not correspond at all) to 7 (corresponds very much).
Persistence. One and a half years after collecting the questionnaire data, the Sør-Trøndelag County Authority gave the first author information about the students’ progress in upper secondary school. Persistence was measured by a dichotomous variable. Students persisting in school were coded 0 (N=371); students dropping out were coded 1 (N=44).
Results
Descriptive and correlational analysis were undertaken by means of SPSS version 20 (IBM) while the CFA was analysed using LISREL 8.8 (Jöreskog and Sörbom Citation1995). CFA is a submodel in structural equation modelling (SEM) that deals specifically with measurement models (Brown Citation2006). CFA is hypotheses-driven in nature, based on past evidence and theory, and might examine the stability (invariance) of the factor model over time or among informants.
The research question was assessed by looking into the estimated parameters, model fit, and construct validity. The statistical significance of each estimated parameter was assessed by its t-value. In general, the higher factor loading the better. A high loading of an item indicates that there is much in common between the factor and the respective item (Sharma Citation1996). Loadings below 0.32 are considered poor, ≥0.45 fair, ≥0.55 good, ≥0.63 very good, and above 0.71 are excellent (Tabachnick and Fidell Citation2007). High-cross loadings were explored by means of modification indices (Jöreskog and Sörbom Citation1995).
In assessing the model fit, different descriptive fit indices are given. The overall model fit can be assessed statistically by the chi-square (χ2) test, the root mean square error of approximation (RMSEA), and the standardised root mean square residual (SRMR). The χ2 test measures the distance between the sample covariance matrix and the fitted covariance matrix. A small χ2 and a non-significant p-value correspond to a good fit. The RMSEA is a measure of discrepancy per degree of freedom and approximate fit in the population. According to the “Rules of thumb cut-off criteria” given by Schermelleh-Engel, Moosbrugger and Muller (Citation2003), values less than .05 indicate a good fit. The SRMR represents the average discrepancy between the observed and the hypothesised covariance matrix, with values less than .05 indicating a good fit, whereas values smaller than .10 may be interpreted as acceptable. For a good model fit, the ratio χ2 /df should be as small as possible; a ratio between 2 and 3 is indicative of a “good” or “acceptable” model fit, respectively (ibid.).
In addition, the following fit indices were used: the normed fit index (NFI), the nonnormed fit index (NNFI), comparative fit index (CFI), the goodness-of-fit index (GFI), and adjusted GFI (AGFI). The usual rule of thumb for NFI and NNFI is that .95 and .97, respectively, indicate a good fit whereas values greater than .90 and .95 indicate an acceptable fit. For CFI, a good fit was set at .97 and greater, while values greater than .95 may be interpreted as an acceptable fit. The GFI for good-fitting models should be greater than .95 (.90 acceptable), whereas for the AGFI, set values of .90 and greater are good (.85 acceptable).
The frequency distribution of the items was examined to assess the deviation from normality. Both skewness and kurtosis were significant (Appendix 1). In correcting for the non-normality, the robust maximum likelihood (RML) was applied in the estimating procedure. The Satorra-Bentler corrected chi-square (χ2) (Satorra and Bentler Citation1994) was used. Moreover, in an attempt to further confirm the reliability and validity, estimates were obtained using the bootstrapping procedure. This procedure is most appropriate for models with non-normal, continuous data: 500 samples are common (Brown Citation2006).
Descriptive statistics
The means (M), standard deviations (SD), and skewness and kurtosis for the AI are provided in Appendix 1. In addition, the mean score for each subscale is given. Considering the intrinsic factors, affiliation showed the highest mean score followed by personal growth, health and community. In relation to the extrinsic factors, wealth showed the highest mean score followed by image and fame. In addition to several significant values for univariate statistics for skewness and kurtosis provided in Appendix 1, the χ2 for multivariate test for skewness and kurtosis was significant (3534.96**). The alpha levels for the AI constructs indicated acceptable inter-item consistency in the measures with Cronbach's alpha coefficients ranging from .70 to .88 (). Cronbach's alpha coefficients for the other factors used were as follows: autonomous motivation .88; controlled motivation .81; amotivation .85; perceived competence .79; and confidence .73.
First-order Factor Model
First, we investigated the first-order factor model's fit to our data (Model 1). Covariances between the factors were desirable since previous research had shown intrinsic and extrinsic goals to be positively correlated (e.g. Kasser and Ryan Citation1996). The CFA gave significant t-values for all estimates (p<0.01). The factor loadings ranged from .32 to .84.
Tabachnick and Fidell (Citation2007) considered loadings ≥0.55 to be good; this was the case of 30 of the 35 items in the current study. One loading might be considered as poor (λ=.32, item A1 “To have good friends that I can count on” and four loadings were close to the threshold of good (λ= .48, .54, .52, and .54 for the items W1 “To be a very wealthy person”, PG2 “At the end of my life, to be able to look back on my life as meaningful and complete”, PG3 “To choose what I do, instead of being pushed along by life”, and PG5 “To gain increasing insight into why I do the things I do”, respectively). Ideally, the standardised factor loadings should be .7 or higher (Hair et al. Citation2010); this was the case for 12 of the 35 items.
Together with the factor loadings, the square of a standardised factor loading (R2) is used to assess the degree to which an item is a good measure of the factor and represents how much variation in an item is explained by the latent factor (Brown Citation2006; Hair et al. Citation2010). In this study, R2 values ranged from .10 to .68. Some authors are stricter than Tabachnick and Fidell (Citation2007) cited above. Both Kline (Citation2011) and Sharma (Citation1996) suggest that the shared variance with the factor should be at least greater than .50. In this regard, 23 of the 35 items in Model 1 did not fulfil this stricter criterion. The factor loadings, t-values and R2 are presented in .
Table 1. Standardised and Unstandardised Factor Loadings, t- Values, and Squared Multiple Correlations (R2) based on RML Estimation and the Bootstrapping Procedure
The correlation matrix for the factors (PHI) showed that the extrinsic goal factors were significantly correlated with each other (.76, .82, and .87): the same pattern emerged for the intrinsic goal factors (.43, .45, .63, .65, 70, and .71) (). In addition, most correlation coefficients between the intrinsic and the extrinsic goal factors were positively significant. However, the correlation coefficients between the intrinsic/extrinsic goal factors were much lower than within the intrinsic/extrinsic goal factors. As hypothesised, this indicated that a second-order factor model could fit the data well.
Table 2. Factors’ Correlations (Model 1)
Moreover, we investigated the overall model fit. Most of the fit indices were within good or acceptable fit (χ2 (1105.77; df=539), χ2 /df=2.05, RMSEA.050, 90% CI= .046 to .055, SRMR .062, CFI .96, NFI .93, and NNFI .96. However, the GFI (.84) and AGFI (.82) did not reveal acceptable values in accordance with Schermelleh-Engel and colleagues (2003). The GFI and AGFI tend to decrease with increasing model complexity (ibid.). The estimates for overall model fit are presented in .
Table 3. Goodness-of-fit measures for Model 1 and Model 2
Further, a substantial body of research has indicated that Cronbach's alpha cannot be generally counted on as an estimation of composite reliability (Raykov Citation2001, Citation2004). Thus, reliability was further investigated within the CFA analysis by means of composite reliability (ρ). A value of 0.6 or more is recommended (Bagozzi and Yi Citation1988). The composite reliability reveals values of between .71 and .88 and thus supports the reliability of the constructs ().
Table 4. The Composite Reliability (ρ)
Second-order Factor Model
Then the hypothesised second-order factor model's fit to our data was tested (Model 2). The standardised factor loadings, square multiple correlation, and t-values were quite similar to Model 1. This also applied to the fit indices. The χ2 (1158.63; df=552), χ2/df=2.10, RMSEA (.052), 90% CI=.047 to .056, SRMR (.068), CFI (.96), NFI (.93), NNFI (.96) indicated an acceptable fit, whereas the GFI (.84) and AGFI (.81) were too low (). In line with Brown (Citation2006), a higher-order solution cannot improve the goodness of fit relative to the first-order solution where the factors are freely intercorrelated. When the higher-order model is over-identified, the nested χ2-test can be used to determine whether the specification produces a significant degradation in fit relative to the first-order solution (ibid.). As expected, using the procedure of nested models, the χ2 for Model 2 compared to Model 1 was increasing. The second-order model produced a significant degradation in fit (χ2 diff (13)=52.86 (1158.63–1105.77, 552–539) relative to the seven-factor solution.
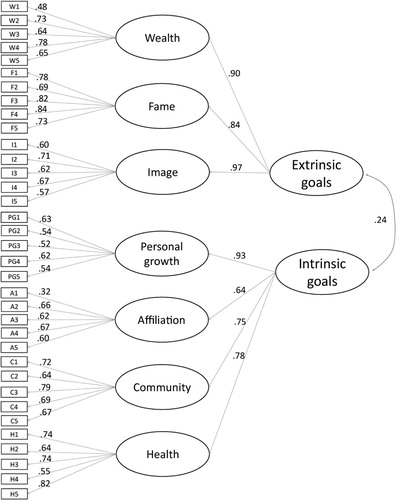
Model 2 gave standardised higher-order factor loadings. The extrinsic factor displayed factor loadings of .90, .84, and .97 with the wealth, fame, and image goal factors, respectively. The intrinsic factor displayed factor loadings of .93, .64, .75, and .78 with personal growth, affiliation, community, and health, respectively (). The correlation coefficient (PHI) between the extrinsic-intrinsic second-order factors was .24. All the estimates were significant. The second-order factor model is portrayed in .
Figure 1. The Second-Order Factor Model (Model 2); Standardised estimates
Several significant residuals ≥1.96 (11.9%) and some high modification indices pointed to some misspecifications. A very high standardised residual (SR) for the items C1 “To work for a better society” and C2 “To assist people who need it, asking nothing in return” appeared (SR=−25.89, inter-item correlation=.63). In addition, the Fame factor revealed five significant residuals from −7.36 to 5.40. The item F4 “To have my name appear frequently in the media” and the item F2 “To be admired by many people” revealed two high standardised residuals for the same items within the Fame factor: the item F3 “To be famous” (SR=5.40 and −6.33, inter-item correlation=.76 and .48, respectively) and item F5 “To be admired by lots of different people” (SR=−7.36 and 5.38, inter-item correlation=.56 and .67 respectively). In addition, a high standardised residual (SR=−6.52, inter-item correlation= .48) revealed between the item F4 and the item F2. In addition, two extreme modification indices (MI) appeared (MI= 96.41 between item PG1 “To grow and learn new things” to the Community factor, MI=98.44 between item A4 “To feel that there are people who really love me, and whom I love” to the Health factor).
To further confirm the reliability, the bootstrapping procedure was applied. Bias-corrected 95 percent CIs, UPE, and z-values are presented in together with the RML estimates for Model 2. The bootstrapping procedure gave almost identical point estimates as the RML estimator and significant t-values for all estimates (p<0.01).
displays a correlation matrix for the different constructs of aspiration to autonomous motivation, controlled motivation, amotivation, perceived competence, confidence, and dropout. For the intrinsic goals, the significant correlations were in the predicted direction with the selected constructs (p<0.05); intrinsic goals were positively associated with students’ autonomous motivation, perceived competence, and confidence, and negatively associated with amotivation and dropout. Concerning the extrinsic goals, they were positively associated with students’ controlled motivation and did not have similar positive effects to autonomous motivation, perceived competence and confidence as intrinsic goals.
Table 5. Aspirations in relation to selected measures: Cronbach's alpha, and correlations coefffiicient
Discussion
The high dropout rate among students in upper secondary school represents a great challenge in many western societies today. This problem especially concerns vocational programmes. In spite of a substantial amount of literature focusing on why students drop out, scarce attention has been given to the significance of students’ values and aspirations. Nevertheless, the SDT theory highlights that an individual's extrinsic and intrinsic goals might explain some vital aspects of dropping out. Therefore, access to a valid and reliable measure assessing students’ extrinsic and intrinsic goals might be of great value in identifying and understanding the issue. Hence, the current study explores the dimensionality, reliability, and construct validity of the AI among health and social care students.
Dimensionality of the Aspiration Index
In accordance with previous research (Kasser 1996; Kim et al. Citation2003; Ryan et al. Citation1999; Schmuck et al. Citation2000; Tang et al. Citation2008), the present results indicated that the intrinsic and the extrinsic goal factors are two separate constructs. Pursuing money, possessions, fashion and striving for popularity, attractiveness, and being admired seem to be something quite different than pursuing self-insight, personal growth, close relationships, human and global aid, and a healthy lifestyle. The seven factors fit quite well in a two-factor second-order CFA model showing an acceptable fit for the χ2 and most of the fit indices. Moreover, the CFA revealed that the three extrinsic factors on average shared more variance with the higher-order extrinsic factor than the four intrinsic factors with the higher-order intrinsic factor. This is in line with previous studies (Kasser and Ryan Citation1996; Schmuck et al. Citation2000). Moreover, the correlation matrix presented in showed high correlations between the extrinsic factors whereas the correlations among the intrinsic factors are somewhat weaker. As such, the distance among the intrinsic and extrinsic factors, respectively, was in accordance with the two dimensional representations of the goals resulting from the multidimensional scaling analysis presented in Grouzet et al. (Citation2005).
Moreover, CFA displayed a significant correlation between the extrinsic and the intrinsic second-order factors (.24, t=3.70**). Accordingly, intrinsic and extrinsic goals were inter-related, showing similar values (.20 and .23, respectively) as previously reported (Kasser and Ryan Citation1996).
Reliability of the Aspiration Index
The factor loadings and the R2 were used to assess the degree to which an item is a good measure of the factor. All the factor loadings in Model 1, except for one item, showed acceptable to good values ranging between .48 and .84. The item “To have good friends that I can count on” disclosed a poor loading (item A1, λ=.32), indicating low reliability. This item did not explain a noteworthy amount of variance in the affiliation factor. Youth studies have demonstrated that peers are of great importance for young people's motivation and well-being (e.g. Ladd, Herald-Brown and Kochel Citation2009). This item is perhaps unsuitable for this young population showing a mean score of 6.89 (scale 1–7), indicating that almost all young vocational students found this goal to be crucial. Thus, this question did not appear to be a good measure in this young population. Moreover, as a consequence of the high mean score, item A1 displayed extreme values for skewness (−4.15**) and kurtosis (19.66**).
Further, the pair of item CI “To work for a better society” and item C2 “To assist people who need it, asking nothing in return” revealed high standardised residuals. The same applies to item F2 “To be admired by many people” and item F5 “To be admired by lots of different people”. Correlated errors might rise from items that are very similarly worded or differentially prone to social desirability (Brown Citation2006), both of which might be an issue in this regard. There is no doubt that “To be admired by many people” (F2) and “To be admired by lots of different people” (F5) are closely worded; the inter-item correlation for these items was .67, indicating that these items measure the same issue. Hence, it is reasonable that they share variance, requesting correlated error terms in the CFA. These items might be revised into phrases to bring about some clearer distinctions. However, all factors in this study revealed good values of Cronbach's alpha and composite reliability, supporting the reliability of the AI.
The MI displayed extremely high values for item PG1 “To grow and learn new things” to the Community factor, and for item A4 “To feel that there are people who really love me, and whom I love” to the Health factor. MI provides important diagnostic information about potential cross-loadings that could exist if specified (Hair et al. Citation2010). The high MI values in this study yielded cross-loadings within the first-order intrinsic goal factors. It seems appropriate that striving for new knowledge and growth may have something in common with valuing community concerns. Moreover, the idea that valuing love has something in common with health is appropriate. The fact that these high cross-loadings appeared for items representing intrinsic goals to different intrinsic goal factors supports the second-order solution. A high MI for items representing extrinsic goals to different intrinsic goal factors, or a high MI for items representing intrinsic goals to different extrinsic goal factors would have impaired the reliability and validity of the index.
Further, reliability was supported by each first-order factor tapping equally strongly into the same higher-order factor. For the first-order factors, six out of seven factors had loadings above .70, showing shared variance with a factor greater than .50.
Taken together, the reliability coefficients, Cronbach's alpha and composite reliability, as well as most of the factor loadings supported the scales’ reliability. However, some signs for improvements were shown.
Construct Validity of the Aspiration Index
Construct validation is a lengthy and on-going process of learning more about the constructs in focus, making new predictions and then testing them. On-going validation studies are needed as our interpretation of the trait changes due to shifting social or cultural conditions (Benson Citation1998). Each study that supports the theoretical construct serves to strengthen the theory.
In this study, construct validity is tested by examining whether the correlations among constructs in a measurement theory make sense. The construct validity was supported by significant correlations in the predicted direction with the selected constructs of autonomous motivation, controlled motivation, amotivation and perceived competence. In addition, the study showed that valuing personal growth, affiliations, community contribution and health were positively associated with students’ confidence related to their educational choice and negatively related to the actual dropout (). This is interesting because far less research has linked students’ values to the dropout rate (Rumberger Citation2011). The intrinsic goals items are closely connected to values described in the Norwegian curriculum for primary and secondary education. Values such as facilitating human growth, caring for the local and global community, having empathy and sensitivity for others, and promoting one's own health as well as the well-being of others are highlighted issues (Utdanningsdirektoratet Citation2007). Thus, focusing on intrinsic goals, for instance in the learning situation, might be highly warranted and promote persistence among health and social care students.
Limitations
This study further confirms the construct validity of the AI. However, some limitations must be considered. First, although the questionnaire was tested through a pilot study and corrected, no back-translation took place. Back-translation should have been taken more seriously in the planning of the study. Second, in this study, the health items clearly shared more variance with the intrinsic factors than the extrinsic ones. In some studies, only six of these seven aspiration factors were used (e.g. Sheldon Citation2005). In this case, the health factor was typically removed. The other six categories fell neatly into two factors, whereas in some studies health turned out to be either extrinsic or intrinsic (Henderson-King and Mitchell Citation2011; Schmuck et al. Citation2000). Since the participants in the current study had chosen a health and social care study programme, they may value physical fitness more than students in other study programmes in upper secondary school. Niemiec, Ryan, Deci and Williams (Citation2009) revealed that physical fitness is important in the domain of health care. Sebire and colleagues (Citation2008) revealed the same in the domain of exercise. Since our sample was relatively homogeneous, further examination of the AI in other young populations in Norway would be beneficial. Previous studies revealed differences between students in general studies and vocational programmes as well as between the different vocational programmes (Blöndal, Jónasson and Tannhauser Citation2011; Markussen et al. Citation2008; Mikiewicz Citation2011).
Third, the actual study programme was composed of 87% females. Other studies showed that females are more intrinsically oriented than males (Kasser and Ryan Citation1996), which might have had an influence on the present results. Finally, when comparing an instrument between different cultures, cultural differences can occur and lead to challenges regarding the construct validity (Harrington Citation2009). This is important to bear in mind when doing psychometric testing of the AI in different cultures. However, our results correspond well with previous results supporting the construct validity.
Conclusion
The SDT distinguishes between intrinsic and extrinsic long-term aspirations or life goals. The CFA supported the hypothesised second-order two-factor structure of intrinsic and extrinsic goals in a Norwegian sample of health and social care students. The correlation analysis supported the hypotheses concerning goals and the selected constructs. These findings join the ranks of previous research supporting the dimensionality as well as the reliability and construct validity of the AI. However, the analyses uncovered one item revealing low reliability and some closely related items within the Fame factor. Thus, some items might be revised for use in such young populations. Nevertheless, further use of this index to measure the content in people's life goals or in the prediction of different outcomes of interest, such as drop out and persistence rates in upper secondary school, seems to be appropriate.
Conflict of interest
The authors have declared no conflicts of interest.
Additional information
Notes on contributors
Britt Karin Støen Utvær
Britt Karin Støen Utvær PhD, Associate Professor, Norwegian University of Science and Technology. Her research focuses on vocational teacher education and the issue of student dropouts. Phone: +47 73590489, Email: [email protected]
Randi Hammervold
Randi Hammervold PhD, Associate Professor, Sør-Trøndelag University College, Trondheim Business School. Her research has concentrated on structural equation modelling using LISREL. Phone: +47 73 55 99 70, Email: [email protected]
Gørill Haugan
Gørill Haugan PhD, Associate Professor, Sør-Trøndelag University College, Faculty of Nursing. Her research has focused on how nursing home patients’ spirituality might contribute to well-being and quality of life. Phone: +47 73 41 21 58, Email: [email protected]
References
- Adalbjarnardottir S., Blöndal K. S. 2006; Social Science Research Institute. Áfengis- og vímuefnaneysla ungmenna í tengslum við námsgengi þeirra: Langtímarannsókn [Youth drug use in relation to their educational attainment]. .
- American Educational Research Association, American Psychological Association, and National Council on Measurement in Education. Standards for educational and psychological testing. 1999; Washington, DC: American Educational Research Association.
- Bagozzi R. P., Yi Y. On the evaluation of structural equation models. Journal of the academy of marketing science. 1988; 16(1): 74–94.
- Benson J. Developing a strong program of construct validation: a test anxiety example. Educational Measurement: Issues and Practice. 1998; 17(1): 10–17.
- Blöndal K. S., Jónasson J. T. Markussen E. Frafall i skolen og tiltak mot frafall på Island: Ulike perspektiver [Dropout and measures in Icelandic school: different perspectives]. Frafall i utdanning for 16-20 åringer i Norden [Dropout in Upper Secondary Education in the Nordic Countries]. 2010; København: Nordisk ministerråd. 63–90.
- Blöndal K. S., Jónasson J. T., Tannhauser A-C. Lamb S., Markussen E., Teese R., Sandberg N., Polesel J. Dropout in a small society: is Iceland case somehow different?. School Dropout and Completion: International Comparative Studies in Theory and Policy. 2011; Dordrecht: Springer. 233–251.
- Brown T. A. Confirmatory factor analysis for applied research. 2006; New York: Guilford Press.
- Deci E. L., Ryan R. M. The ‘what’ and ‘why’ of goal pursuits: human needs and the self-determination of behavior. Psychological Inquiry. 2000; 11(4): 227–268.
- Deci E. L., Ryan R. M. Self-determination theory: a macrotheory of human motivation, development, and health. Canadian Psychology/Psychologie Canadienne. 2008; 49(3): 182–185.
- Eccles J. S., Wigfield A. Motivational beliefs, values, and goals. Annual Review of Psychology. 2002; 53(1): 109–132. [PubMed Abstract].
- Goodwin L. D., Leech N. L. The meaning of validity in the new standards for educational and psychological testing: implications for measurement courses. Measurement and Evaluation in Counseling and Development. 2003; 36(3): 181–191.
- Grouzet F. M. E., Kasser T., Ahuvia A., Dols J. M. F., Kim Y., Lau S., Ryan R. The structure of goal contents across 15 cultures. Journal of Personality and Social Psychology. 2005; 89(5): 800–816. [PubMed Abstract].
- Grouzet F. M. E., Otis N., Pelletier L. G. Longitudinal cross-gender factorial invariance of the Academic Motivation Scale. Structural Equation Modeling. 2006; 13(1): 73–98.
- Hagen A., Dæhlen M. National research report (NNR). CEDEFOP. 2009; European Centre for the Development of Vocational Training.
- Hair J. F., Black W.C., Babin B. J., Anderson R. E. Multivariate data analysis. 2010; Upper Saddle River: Prentice Hall.
- Harrington D. Confirmatory factor analysis. 2009; Oxford: University Press.
- Henderson-King D., Mitchell A. M. Do materialism, intrinsic aspirations, and meaning in life predict students’ meanings of education?. Social Psychology of Education. 2011; 14(1): 119–134.
- Jöreskog K. G., Sörbom D. LISREL 8: structural equation modeling with the SIMPLIS command language. 1995; Chicago: Scientific Software International.
- Karlsen R. J. Fagopplæring for framtida [Vocational education for the future] (Vol. NOU 2008:18). 2008. Oslo: Statens forvaltningstjeneste. Informasjonsforvaltning.
- Kasser T. Deci E. L., Ryan R. M. Sketches for a self-determination theory of values. Handbook of Self-Determination Research. 2002; Rochester, N.Y.: University of Rochester Press. 123–140.
- Kasser T., Ryan R. M. A dark side of the American dream: correlates of financial success as a central life aspiration. Journal of Personality and Social Psychology. 1993; 65(2): 410–422. [PubMed Abstract].
- Kasser T., Ryan R. M. Further examining the American dream: differential correlates of intrinsic and extrinsic goals. Personality and Social Psychology Bulletin. 1996; 22(3): 280–287.
- Kasser T., Ryan R. M. Smuck P., Sheldon K. M. Be careful what you wish for: optimal functioning and the relative attainment of intrinsic and extrinsic goals. Life Goals and Well-being: Towards a Positive Psychology of Human Striving. 2001; Gøttingen: Hogrefe & Huber Publishers. 116–131.
- Kim Y., Kasser T., Lee H. Self-concept, aspirations, and well-being in South Korea and the United States. The Journal of Social Psychology. 2003; 143(3): 277–290. [PubMed Abstract].
- Kline R. B. Principles and practice of structural equation modeling. 2011; New York: Guilford Press.
- Kunnskapsdepartementet. Utdanningslinja [Education strategy] (Vol. no. 44 (2008–2009)). 2009; Oslo: Regjeringen.
- Kunnskapsdepartementet. Utdanning for velferd: samspill i praksis [Education for welfare: interaction as key]. 2012; Oslo: Regjeringen.
- Kunnskapsdepartementet. På rett vei: kvalitet og mangfold i fellesskolen [On the right track: quality and diversity in public school] (Vol. 20 (2012–2013)). 2013; Oslo: Regjeringen.
- Ladd G. W., Herald-Brown S. L., Kochel K. Wigfield A., Wentzel K. R. Peers and motivation. Handbook of Motivation at School. 2009; New York: Routledge. 323–348.
- Lamb S., Markussen E., Teese R., Sandberg N., Polesel J. School dropout and completion: international comparative studies in theory and policy. 2011; Dordrecht: Springer.
- Lamb S., Markussen E. Lamb S., Markussen E., Teese R., Sandberg N., Polesel J. School dropout and completion: an international perspective. School Dropout and Completion: International Comparative Studies in Theory and Policy. 2011; Dordrecht: Springer. 1–18.
- Markussen E. Frafall i utdanning for 16-20 åringer i Norden [Dropout between 16-20 years old in Norden] (Vol. 517/10). 2010; København: København.
- Markussen E., Sandberg N., Lødding B., Frøseth M. W. Bortvalg og kompetanse: gjennomføring, bortvalg og kompetanseoppnåelse i videregående opplæring blant 9749 ungdommer som gikk ut av grunnskolen på Østlandet våren 2002: hovedfunn, konklusjoner og implikasjoner fem år etter [Early leaving, non-completion or completion? On early leaving, non-completion or completion in upper secondary education among 9,749 young people who left lower secondary in the spring of 2002]. Report no, 13. 2008; Oslo: NIFU STEP.
- Markussen E., Sandberg N. Lamb S., Markussen E., Teese R., Sandberg N., Polesel J. Policies to reduce school dropout and increase completion. School Dropout and Completion: International Comparative Studies in Theory and Policy. 2011; Dordrecht: Springer. 391–406.
- Markussen E., Seland I. Å redusere bortvalg - bare skolenes ansvar? En undersøkelse av bortvalg ved de videregående skolene i Akershus fylkeskommune skoleåret 2010–2011 [To reduce dropout – only the responsibility of the school? A survey of dropout in upper secondary schools in Akershus County in 2010–2011] (Vol. 6/2012). 2012; Oslo: NIFU.
- Mikiewicz P. Lamb S., Markussen E., Teese R., Sandberg N., Polesel J. School dropout in secondary education: the case of Poland. School Dropout and Completion: International Comparative Studies in Theory and Policy. 2011; Dordrecht: Springer. 173–190.
- Netemeyer R. G., Bearden W. O., Sharma S. Scaling procedures: issues and applications. 2003; Thousand Oaks, Calif.: Sage Publications.
- Niemiec C. P., Ryan R. M., Deci E. L. The path taken: consequences of attaining intrinsic and extrinsic aspirations in post-college life. Journal of Research in Personality. 2009; 43(3): 291–306.
- Niemiec C. P., Ryan R. M., Deci E. L., Williams G. C. Aspiring to physical health: the role of aspirations for physical health in facilitating long-term tobacco abstinence. Patient Education and Counseling. 2009; 74(2): 250–257. [PubMed Abstract] [PubMed CentralFull Text].
- OECD. Education at a glance. 2012a. Retrieved from: http://www.oecd.org/edu/eag2012 (eng)--Ebook (FINAL 11 09 2012).pdf.
- OECD. Sick on the job? Myths and realities about mental health and work. 2012b; Paris: OECD.
- Ou S-R., Reynolds A. J. Predictors of educational attainment in the Chicago Longitudinal Study. School Psychology Quarterly. 2008; 23(2): 199–229.
- Raykov T. Estimation of congeneric scale reliability using covariance structure analysis with nonlinear constraints. British Journal of Mathematical and Statistical Psychology. 2001; 54(2): 315–323. [PubMed Abstract].
- Raykov T. Behavioral scale reliability and measurement invariance evaluation using latent variable modeling. Behavior Therapy. 2004; 35(2): 299–331.
- Rinne R., Jarvinen T. Lamb S., Markussen E., Teese R., Sandberg N., Polesel J. Dropout and completion in upper secondary education in Finland. School Dropout and Completion: International Comparative Studies in Theory and Policy. 2011; Dordrecht: Springer. 215–232.
- Rumberger R. W. Dropping out: why students drop out of high school and what can be done about it. 2011; Cambridge, Mass.: Harvard University Press.
- Rumberger R. W., Lim S. A. Why students drop out of school: a review of 25 years of research. California Dropout Research Report #15. 2008. University of California, Santa Barbara.
- Ryan R. M., Chirkov V. I., Little T. D., Sheldon K. M., Timoshina E., Deci E. L. The American dream in Russia: extrinsic aspirations and well-being in two cultures. Personality and Social Psychology Bulletin. 1999; 25(12): 1509–1524.
- Ryan R. M., Huta V., Deci E. L. Living well: a self-determination theory perspective on eudaimonia. Journal of Happiness Studies. 2008; 9(1): 139–170.
- Ryan R. M., Sheldon K. M., Kasser T., Deci E. L. Gollwitzer P. M., Bargh J. A. All goals are not created equal: an organismic perspective on the nature of goals and their regulation. The Psychology of Action: Linking Cognition and Motivation to Behavior. 1996; New York: Guilford Press. 7–26.
- Satorra A., Bentler P. Eye A. V., Clogg C. C. Corrections to test statistics and standard errors in covariance structure analysis. Latent Variables Analysis: Applications for Developmental Research. 1994; Thousand Oaks, Calif.: Sage. 399–419.
- Schermelleh-Engel K., Moosbrugger H., Muller H. Evaluating the fit of structural equation models: tests of significance and descriptive goodness-of-fit measures. Methods of Psychological Research. 2003; 8(2): 23–74.
- Schmuck P., Kasser T., Ryan R. M. Intrinsic and extrinsic goals: their structure and relationship to well-being in German and U. S. college students. Social Indicators Research. 2000; 50(2): 225–241.
- Sebire S. J., Standage M., Vansteenkiste M. Development and validation of the Goal Content for Exercise Questionnaire. Journal of Sport and Exercise Psychology. 2008; 30(4): 353–377. [PubMed Abstract].
- Sharma S. Applied multivariate techniques. 1996; New York: Wiley.
- Sheldon K. M. Positive value change during college: normative trends and individual differences. Journal of Research in Personality. 2005; 39(2): 209–223.
- Sheldon K. M., Kasser T. Coherence and congruence: two aspects of personality integration. Journal of Personality and Social Psychology. 1995; 68(3): 531–543. [PubMed Abstract].
- Sheldon K. M., Kasser T. Getting older, getting better? Personal strivings and psychological maturity across the life span. Developmental Psychology. 2001; 37(4): 491–501. [PubMed Abstract].
- Sheldon K. M., Ryan R. M., Deci E. L., Kasser T. The independent effects of goal contents and motives on well-being: it's both what you pursue and why you pursue it. Personality and Social Psychology Bulletin. 2004; 30(4): 475–486. [PubMed Abstract].
- Statistics Norway. Pupils who started an upper secondary level 1 for the first time in 2006, by completed upper secondary education within five years, education programs and gender. 2012. Retrieved from: http://www.ssb.no/english/subjects/04/02/30/vgogjen_en/tab-2012-05-30-02-en.html (10.06.12)..
- Tabachnick B. G., Fidell L. S. Using multivariate statistics. 2007; Boston: Pearson/Allyn and Bacon.
- Tang H., Kuang C., Yao S. The Chinese version of Aspiration Index: reliability and validity. Chinese Journal of Clinical Psychology. 2008; 16(1): 15–17.
- Utdanningsdirektoratet. Kunnskapsløftet [Knowledge Pronomotion]. 2007. Retrieved from: http://www.udir.no/Stottemeny/English/Curriculum-in-English/_english/Knowledge-promotion---Kunnskapsloftet/. (30.01.12)..
- Utvær B. K. S. Explaining health and social care students’ experiences of meaningfulness in vocational education: the importance of life goals, learning support, perceived competence, and autonomous motivation. 2013a. Scandinavian Journal of Educational Research.
- Utvær B. K. S. Staying in or dropping out? A study of factors and critical incidents of importance for health and social care students in upper secondary school in Norway (Doctoral thesis). 2013b; Trondheim: NTNU.
- Vallerand R. J., Bissonnette R. Intrinsic, extrinsic, and amotivational styles as predictors of behavior: a prospective study. Journal of Personality. 1992; 60(3): 599–620.
- Vallerand R. J., Fortier M. S., Guay F. Self-determination and persistence in a real-life setting: toward a motivational model of high school dropout. Journal of Personality and Social Psychology. 1997; 72(5): 1161–1176. [PubMed Abstract].
- Vansteenkiste M., Lens W., Deci E. L. Intrinsic versus extrinsic goal contents in self-determination theory: another look at the quality of academic motivation. Educational Psychologist. 2006; 41(1): 19–31.
- Vansteenkiste M., Niemiec C., Soenens B. The development of the five mini-theories of self-determination theory: an historical overview, emerging trends, and future directions. Advances in Motivation and Achievement. 2010; 16: 105–166.
- Vansteenkiste M., Soenens B., Verstuyf J., Lens W. What is the usefulness of your schoolwork? The differential effects of the intrinsic and extrinsic goal framing on optimal learning. Theory and Research in Education. 2009; 7(2): 155–163.
- Vansteenkiste M., Timmermans T., Lens W., Soenens B., Van den Broeck A. Does extrinsic goal framing enhance extrinsic goal-oriented individuals’ learning and performance? An experimental test of the match perspective versus self-determination theory. Journal of Educational Psychology. 2008; 100(2): 387–397.
Appendix
Measurement Instrument, Aspiration Index (AI) Mean Score, Standard Deviation, Skewness, and Kurtosis