Abstract
Background: Health effects induced by climate, weather and climatic change may act directly or indirectly on human physiology. The future total burden of global warming is uncertain, but in some areas and for specific outcomes, mortality and morbidity are likely to increase. One likely effect of global warming is an increasing number of extreme weather events, such as floods, storms and heat waves. The excess numbers of specific health outcomes attributable to climate-induced events can be estimated. This paper compares approaches for estimating excess numbers of outcomes associated with climate extremes, exemplified by a case study of hospital admissions during the extremely warm summer of 2006 in southern Sweden.
Materials and methods: Daily hospital admission data were obtained from the Swedish National Board of Health and Welfare for six hospitals in the Skåne region of southern Sweden for the period 1998 to 2006. Daily temperature data for the region were obtained from the meteorological station in the city of Malmö. We used four established approaches for estimating the daily excess numbers associated with extreme heat. Time series of daily event rates were assumed to follow a Poisson distribution. Excess event rates were compared by using several approaches, such as standardised event ratios and generalised additive models to estimate the health risks attributable to the extreme climate event.
Results: The four approaches yielded vastly different results. The estimates of excess were considerably biased when not accounting for time trends in previous years’ data. Three of four approaches showed a significant increase in excess hospitalisation rates attributable to the heat episode in Skåne in 2006. However, modelling the effect of temperature failed to describe the risks induced by the extreme heat.
Conclusion: Estimates of excess events depend greatly on the approach used. Further research is needed to identify which method yielded the most accurate estimates. However, one of the approaches used generally performed better than the others in estimating the excess rates associated with the heat episode. Further on, estimating relative risks of temperature or other determinants of disease may fail to incorporate the unique characteristics of particular weather events, such as the effect caused by very persistent heat exposure. Unless this can be incorporated into predictive models, such models may be less appropriate to use when predicting the future burden of heat waves on human health.
Establishing associations between weather, climate and different health outcomes are fundamental to better understandings of the complex associations between human wellbeing and a changing climate. Weather and climate can affect health on different timescales, by different pathways, and associations can be roughly divided into direct or indirect effects according to whether an extreme weather event acts directly on human physiology (e.g. cardiovascular effects of heat waves, cold spells and extreme weather events) or indirectly via pathogens, allergens or vectors (e.g. vector and water-borne diseases, mould and pollens) Citation1. The links between weather, climate and health are still largely unexplored, but in some areas researchers have established various associations between heat events and health outcomes, such as patterns of cholera transmission Citation2, tick-borne disease Citation3 and heat-induced mortality Citation4Citation5.
According to the fourth assessment report by the Intergovernmental Panel of Climate Change (IPCC), climate and health experts expect the global burden of disease to increase due to extreme climatic events, such as floods, heat waves and storms Citation1. Health outcomes during such events are in some cases monitored by surveillance centres, with excess risks or frequencies being estimated routinely or subsequently characterised in more detailed and specific scientific publications. Often risks of an outcome during an extreme event are compared with the expected risks for the same outcome; for example, in heat wave observational studies this may correspond to the observed number subtracted (O–E) or divided by (O/E) the expected number, where the expected is based on the mean frequency in preceding years Citation4Citation6Citation7Citation8Citation9. Another frequently applied study design compares observed frequencies with those predicted (expected) from previous years in time series regression models including trends and possibly taking into account calendar time Citation10Citation11Citation12Citation13. Both approaches mentioned above are common in observational studies and offer a fast and comprehensive way to augment scientific knowledge of climate induced hazards. A third approach used in studies of temperature and health is the incorporation of parametric or non-parametric spline functions (smooth functions) in time series regression models Citation14. Such functions estimate the excess health outcomes (O–E) during the extreme events, taking into account calendar time variables, such as seasonality, time trend, weekday patterns and national holiday patterns plus additional potential confounders, e.g. air pollution levels during an heat wave Citation15. With such a study design the excess ratio (O/E), estimated by the smooth function, is directly related to the levels expected during the same time period as the event given by covariates of the model. A fourth approach frequently used when establishing a direct relation between temperature and mortality, and morbidity is modelling the variability of daily deaths as dependent on the variability in daily and previous days’ temperatures, adjusting for a range of determinant factors, such as calendar time patterns and time trends Citation14.
1 The direct effect of heat on morbidity and mortality
Heat-related health events are likely to increase with global warming unless adaptation occurs. Studies of heat impacts on human physiology have a longstanding history Citation5. The largest proportion of heat effects are not reported cases of hyperthermia, but mainly increases in cardiovascular and respiratory hospitalisations or deaths Citation5. Cardiovascular events are mainly a consequence of increased heart rate due to regulation of body temperature by sweating, which in turn leads to a reduction in blood volume Citation6. The mechanisms for respiratory deaths are less clear. Recent studies have identified several high risk groups, such as living on top floors, living in institutions, engaging in outdoor activities involving exertion, being very young or very old and being in populations not adapted to heat Citation5Citation7Citation16Citation17Citation18Citation19Citation20. Heat waves are also often associated with increased incidence of dehydration, renal failure and electrolyte disorders, as well as increases in neurological disorders Citation5Citation7Citation18.
The number of papers on heat events and mortality has grown rapidly, but the number of studies assessing heat effects on morbidity, for example, the number of hospitalisations, are fewer Citation9Citation21Citation22Citation23Citation24Citation25. Many studies estimate the general effect of high temperature during summer, utilising distributed lag models on a daily basis, but not the specific effect of extreme heat where there is little or no relief from the heat during the event period. Such events do not necessarily correspond to the same increase in relative risk. The risks are often much higher during heat waves. This was, for example, illustrated by the large excess mortality in France during the heat wave of 2003 Citation15. In developed countries, where most research on this subject has been undertaken, the effect of heat has been more severe among the very elderly in the population. The opposite pattern has been observed in regions with poorer health conditions, where heat has been shown to be a more important predictor of childhood mortality, for example, in India where infectious diseases dominate causes of mortality. Moreover, the overall effects of high temperatures on hospitalisations have shown different patterns in heat waves Citation9Citation21 compared to general summer temperatures Citation21Citation22. However, few papers have investigated the excess morbidity both during extreme heat events and during summers in general, to show the difference between such exposures.
2 Established associations, climate and the extreme nature of the 2006 Swedish heat event
The climate in Sweden is rather moderate during the summer. Nonetheless, we have previously established associations between high temperatures, relative humidities and respiratory, cardiovascular and total mortality (excluding external causes), as well as increasing susceptibility over time in Stockholm Citation27Citation28. However, no particular heat extreme or heat wave has been studied. During the summer of 2006, several meteorological stations in the south of Sweden recorded the highest summer mean and July mean temperature since measurements started in the middle of the nineteenth century. At the meteorological station in Lund the mean temperature for July was 21.7°C, against a reference level for the period 1961–1990 of 16.7°C and corresponding standard deviation 1.3 (Personal communication: Markku Rummukainen & Erik Kjellström, Rossby Center, SMHI). In the wider context, the temperature in Lund for July 2006 was 3.8 standard deviations from the reference mean level and was therefore less extreme in comparison with the 2003 European heat wave, when levels reached almost six standard deviations from the reference mean level Citation29.
3 Objective
In this paper we aim to estimate the excess number of daily hospital admissions (all causes excluding external; respiratory and cardiovascular causes) caused by the heat event in 2006 in Skåne, Sweden, by employing four different approaches commonly used in the literature to estimate the impact of heat events on mortality and morbidity:
standardised event ratios assuming the same frequencies as the mean of the two previous years;
time series Poisson regression approach predicting the expected excess numbers from trends and calendar patterns;
time series Poisson regression approach estimating excess numbers with a smooth function; and
time series Poisson regression approach incorporating predictors of temperature effect in lag strata.
4 Population and data
We collected cause-specific data on acute (unplanned) hospitalisations at the hospitals in Malmö, Lund, Helsingborg, Trelleborg, Ystad and Landskrona from the National Board of Health and Welfare during the period 1998–2006. Data were aggregated at the daily level by counts of total (excl. external) causes, cardiovascular causes [ICD10:I] and respiratory causes [ICD10:J] for all ages.
Data on daily mean temperatures during the period 1998–2006 were collected from Malmö meteorological station maintained by the Swedish Meteorological and Hydrological Institute.
5 Methods
Extreme temperatures during 2006 ranged over the whole summer period, so we defined the heat event as the months June–August, to incorporate a potential early summer heat effect due to lack of acclimatisation and lag effects in the later part of the summer.
In the first approach we calculated differences (O–E) and ratios (O/E) of observed and expected counts during the heat event in the study region according to the cause-specific groups studied. The expected count in 2006 was calculated as the mean of the observed counts for the same time period as the heat event during the two preceding years. The observed and the expected counts in 2006 were summed by week, starting June 1st and ending August 30th (total 13 weeks) as were the standardised event ratios. Confidence intervals (CI; 95%) were calculated for the total number of excess admissions with variance derived from the Poisson distribution for weekly mean frequencies during the reference period (for Poisson distributed events the variance equals the mean) and assuming normal properties for the sum of frequencies.
For the three following approaches we estimated the excess numbers and ratios during the heat event in 2006 by establishing Poisson regression models incorporating smooth functions of between-year and within-year trends (seasonality), and factors describing weekday patterns and national holidays.
Additionally in the second approach we established a generalised additive Poisson model and predicted the expected frequencies during summer 2006 according to time trends, weekday and holiday patterns estimated from the two preceding years. The smooth functions for within-year and between-year trends were allowed a restrictive fixed degree of freedom (df) of 2 and 7, respectively.
Additionally in the third approach we established generalised additive Poisson regression models for the period 1998–2006 and incorporated a smooth function over time (from July 1st until August 30th in 2006) to model the excess risks during the heat event period, as well as a smooth function for within-year and between-year trends. The two latter functions were allowed a fixed df of 12 and 9, respectively. The smooth function for the excess risks during summer 2006 was allowed 9 df as a maximum and was penalised for wiggliness. CIs (95%) for the total excess numbers were derived from the regression models.
The fourth and final approach undertaken was modelling the effect of mean daily temperature on hospitalisation in a time series generalised additive Poisson regression model using smooth functions of moving average temperature lag strata 0–1, 2–6 and 7–13. These functions were penalised if too wiggly and maximally allowed 7 df. In this model we controlled for seasonality, 7 df, and between year time trends, 9 df, by smooth functions with fixed degree of freedom. The smooth functions were less relaxed this time to avoid the control for seasonality affecting the estimates for the daily effect of temperatures. Additional variables included were factors for weekday and holiday patterns. The fourth approach was based on data from the period 1998–2006. A 95% CI for the total excess frequency was derived from standard deviations from the regression model.
The analysis was done in R30 using the mgcv package. The generalised cross-validation criteria were used to fit the best model. The assumption on the flexibility of the smooth function for excess risks (approach III) was relaxed allowing more degrees of freedom. However, this resulted only in minor changes in the estimated excess effects. The smooth functions for within-year trends as well as the smooth functions for excess risk during the heat event 2006 were based on cyclic spline functions; the other smooth functions were based on cubic splines. The adjusted R-squared was between 50 and 75% in all the models, with the highest R-squared in models of all-cause morbidity. In all models fitted we allowed for over-dispersion. Model diagnostics, such as heteroskedacity, normality and response vs. fitted values were graphically examined.
All calculations were based on daily data. However, to simplify interpretation we aggregated some of the results to a weekly basis.
6 Results
The 95th percentile of daily temperatures in Malmö was 19.4°C over the study period. During the extremely warm summer of 2006 the daily mean temperatures in Malmö were generally above 20°C from July 2nd to August 1st. The maximum daily mean temperature was above the 90th percentile of summer temperature during July, with exception of the period July 12th–15th when the temperatures were just below the 90th percentile. The summer mean temperature in Malmö, 2006, was about 2°C warmer compared to the two preceding years (see ).
Table 1. Descriptive statistics for daily summer temperatures in Malmö 2004–2006
In , weekly comparison of hospitalisations in all-cause excl. external, respiratory and cardiovascular causes from the first approach are presented as excess numbers (O–E) and standardised admission ratios (O/E) during summer 2006 compared with the two previous summers (2004–2005). The weekly mean temperatures during summer 2006 (dot-dashed) and the mean of the two preceding years (dashed) are also contrasted. According to this approach, the excess number of admissions was generally greatly higher during the whole summer with the largest increase after the warmest period at the end of July and the beginning of August. The relative increase was largest for respiratory admissions where the risks were up to twice those during the reference period. Generally, during the whole summer, risks of admission were higher than during the two preceding years. The total number of excess admissions during summer 2006 was estimated as 1,406 (95% CI: 1,280–1,532), 476 (95% CI: 410–541) and 931 (95% CI: 822–1,039) in groups of total, respiratory and cardiovascular causes, respectively (see ). The increased risk of cardiovascular admissions was unexpectedly high at the beginning of summer. However, not accounting for an increasing trend in admissions during the study period is likely to bias the estimates from the first approach.
Figure 1. To the left; excess admissions in summer 2006 derived from observed numbers in summer 2006 minus observed numbers during the two preceding summers. To the right; corresponding ratios of observed to expected numbers. The dot-dashed lines correspond to weekly mean temperatures during summer 2006 and the dashed lines to the weekly mean temperatures during the two preceding summers.
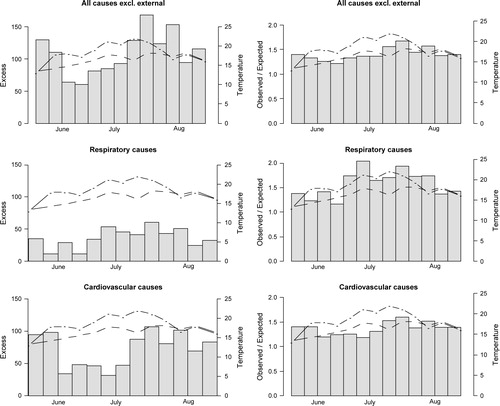
Table 2. The heat event attributable excess admissions in all and cause-specific groups corresponding to the different approaches of estimating excess frequencies with 95% confidence intervals ( )
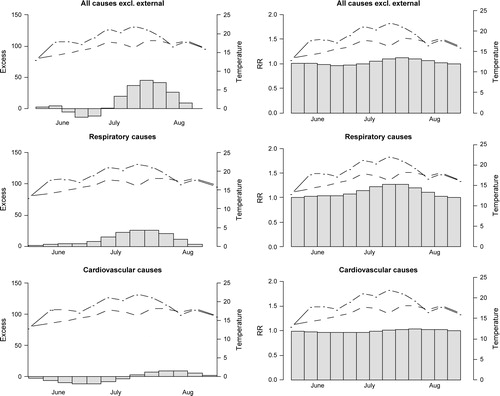
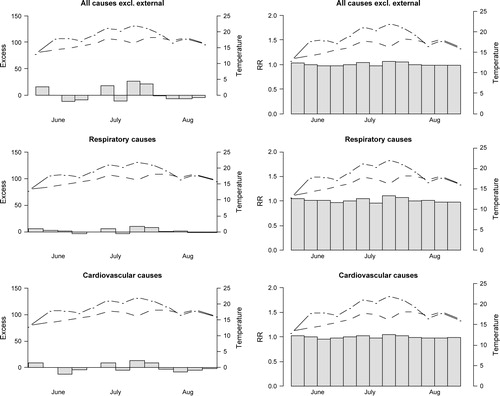
In , the excess numbers and ratios of observed and expected from the second approach are presented for the three groups of hospital admissions. Here the frequencies increased during the warmest part of the summer, but for cardiovascular causes, also at the beginning of summer. The relative risk estimates were normalised to increase from approximately one. The total number of excess admissions during summer 2006 was estimated as 753 (95% CI: 715–790), 305 (95% CI: 287–323) and 403 (95% CI: 370–436) in groups of total, respiratory and cardiovascular causes, respectively (see ). In , the excess numbers and ratios associated with the heat event from the third approach corresponding to the smooth functions of the risks in 2006 are presented. The relative increase was largest for respiratory admissions. Both the group of respiratory admissions and the group of all-causes showed statistically significant increases which were probably due to the heat event. This effect was less apparent in the cardiovascular event group.
Figure 2. To the left; excess admissions during summer 2006 as observed minus expected, and to the right; ratios of observed to expected, with expected as predicted from a regression model based on patterns during the two preceding years. The dot-dashed lines correspond to weekly mean temperatures during summer 2006 and the dashed lines to the weekly mean temperatures during the two preceding summers.
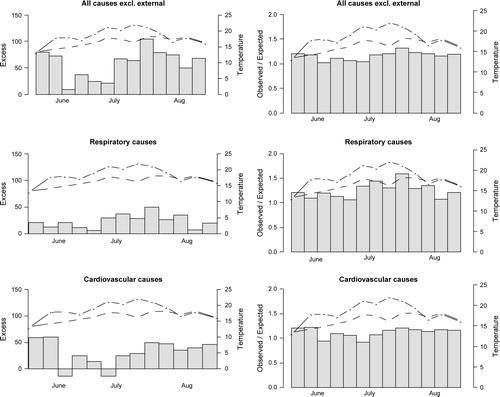
Figure 3. To the left; excess admissions in summer 2006 derived from a regression model incorporating a smooth function of time of the heat event to capture associated risks, and to the right; corresponding ratios of modelled frequencies (RR) associated with the heat event divided by expected frequencies if no heat event. The dot-dashed lines correspond to weekly mean temperatures during summer 2006 and the dashed lines to the weekly mean temperatures during the two preceding summers.
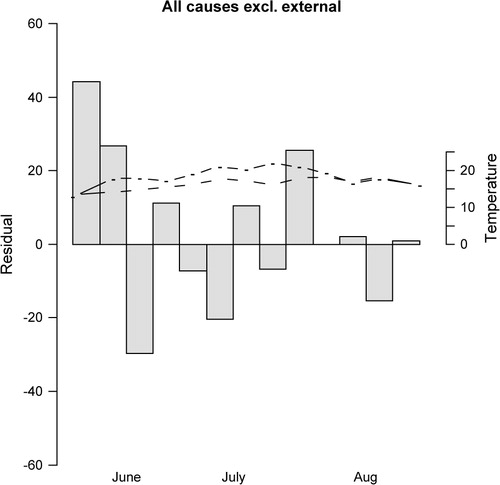
In , the smooth functions from this model are presented with 95% CIs in grey. In , the weekly residuals of the model of all-causes are plotted. As can be seen, there were small residual patterns after having fitted the model. However, there were a few disturbing peaks, one of them at the time of the highest temperature levels, that was not accounted for by this function. The total number of excess admissions during the summer of 2006 was estimated as 157 (95% CI: 122–193), 146 (95% CI: 128–164) and –15 (95% CI: –36–8) for all cause, respiratory and cardiovascular admissions, respectively (see ).
Figure 4. Smooth functions of excess risk for hospitalisation during the record breaking warm summer of 2006 in cause-specific groups. The shaded region is the 95% confidence intervals.
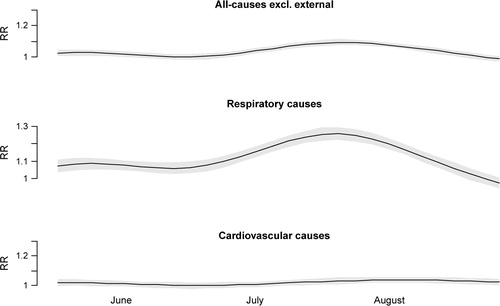
Figure 5. The observed weekly count of hospital admissions in summer 2006 subtracted from the predicted count from the time series regression model with smooth functions describing excess risks during the heat event, also corresponding to the model residuals during summer 2006. The dot-dashed line corresponds to weekly mean temperatures during summer 2006 and the dashed line to the weekly mean temperatures during the two preceding summers.
In , the fourth approach was applied and the predicted excess attributable to the summer 2006 temperatures was compared with the expected levels of admissions predicted from the mean daily temperature during the two preceding years (all other covariates being the same as 2006). Here, the frequencies increased very little compared with estimates from previous approaches. The total number of excess admissions during summer 2006 was estimated as 32 (95% CI: 6–58), 26 (95% CI: 14–38) and –2 (95% CI: –24–20) for all cause, respiratory and cardiovascular admissions, respectively (see ).
Figure 6. To the left; weekly admissions in summer 2006 attributed to daily variation of temperature compared with mean temperature levels in 2004 and 2005. The model incorporates smooth functions of temperature effect in lag strata 0–1, 2–6 and 7–13, and to the right; corresponding risks relative to the risk attributed to mean daily temperatures of 2004–2005. The dot-dashed lines correspond to weekly mean temperatures during summer 2006 and the dashed lines to the weekly mean temperatures during the two preceding summers.
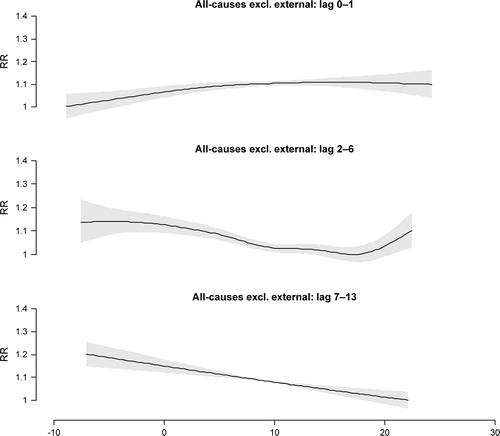
In , the smooth function of the effect of temperature in each lag strata for all causes is presented as risk relative to the minimum point at the curve, with its 95% CI. Generally, all of these functions were significant at the 95% level, except the lag 0–1 function for respiratory causes. For all causes, the effect of temperature on admission rates was rather weak in the lag strata 0–1, v-shaped in the lag strata 2–6 (increasing with both low and high temperatures) and increased with decreasing temperature in the lag strata of 7–13. It should be noted, however, that these effects of temperature have not been controlled for the influence of influenza, but instead the trend functions were more relaxed to incorporate such effects.
Figure 7. The risks of hospital admission as a function of temperature in lag strata of 0–1, 2–6 and 7–13. The shaded areas are 95% confidence intervals.
7 Discussion
We used four different approaches to study the effects of a climatic extreme on hospital admissions, taking the case of a record-breaking warm summer. The results from the four approaches differed to a very large extent, and uncertainties in the effect estimates (CIs) should be of little concern compared to the differences induced by the study methodologies. The largest excess numbers were estimated in the first approach, not incorporating the increasing frequency of admissions with time. The estimates of the first approach were therefore likely to overestimate excess numbers and risk ratios associated with the heat event. The second approach, which is commonly used, also yielded quite large estimates of excess in all disease groups studied. However, here the ratios were more accurately normalised to the baseline levels of 2006 due to the modelling of the time trend. In the third approach, the excess frequencies due to heat in 2006 were rather low, and may have fallen victim to natural constraints for smooth functions (being restricted to be smooth and not sufficiently well incorporating peaks). It is therefore likely that such a function may have underestimated the effects of the extremely warm summer on hospitalisation rates. This suspicion was augmented after having plotted the residuals of the model for summer 2006. The fourth approach predicted the rates in 2006 based on modelling the lagged relationship between temperature and hospitalisations during the period 1998–2006. However, this approach (which is well established in studies of heat on mortality) failed to predict any increases in the frequencies of hospitalisation at all. The explanation for this is probably that the approach did not incorporate effects of persistent exposure, which is a unique characteristic in this data only occurring during heat waves, but rather described the short-term variation in admissions due to short-term variability in temperature in general. Previous heat waves have indicated the risks during such extreme conditions may increase much more than predicted from temperature–mortality studies Citation5Citation15. All models showed increased risks during the end of July and start of August, the period when the temperature had been at an extremely high level for about two weeks. According to the second approach, which probably yielded the best estimates, the admissions rates during the last week in July were about 30% higher than normal for this time of year. The time lag between heat and peaking event rates was also a fact during the 2003 heat wave in France Citation15.
The most obvious difference between the estimates from the second and the third approach was that the second approach estimated high excess levels during the start of June 2006 mainly in cardiovascular disease, while the third did not. These effects could be due to early summer warm weather, when the population was not acclimatised to high temperatures, but it could also be a pattern caused by something else that started before June 1st and which is therefore not estimated by the smooth function for excess, since this function assumed the excess started on or after June 1st.
In the fourth approach the effect of high temperatures was estimated to be mainly in the lag strata of 2–6, showing a more delayed effect of heat for hospitalisation than for mortality in Sweden Citation27. Looking at other lag strata we can confirm the contrasting patterns of admissions and temperature found previously Citation21Citation24. We can also confirm the stronger relationship between respiratory admissions and high temperatures previously established Citation22. This was also the case for mortality and high temperatures in Sweden Citation27. This, together with the fact that many cardiovascular disease events may have occurred outside of hospitals, may indicate a shortcoming in the health system; a very rapid development of disease states or fatigue/disorientation that made people less likely to seek help and therefore die at home Citation24. However, the fewer cardiovascular causes may still represent a larger proportion of attributed cases because the incidence rate of cardiovascular disease is about four times greater than the attributed cases of respiratory diseases.
To judge which of these approaches is preferable, based on these data, is hard, but future simulation results may predict the more favourable approach to use. So far, it seems the second approach performed better than the others according to trends and predictions and taking into account the residual peaks of the third approach. It is clear, however, that confidence limits based on a single approach indicate little of the uncertainty that we should show around estimates of excess.
An additional but rarely used method applied to hospital admission rates during heat waves is to define the reference period as a period before the event and a period after the event Citation23. This approach resembles the third approach used in this study (with a smooth function estimating the excess rates), but avoids the problem with the smooth function not being flexible enough to including spikes caused by the exposure. However, if the heat event episode runs over a longer period of time (as in this case) a seasonal confounding may bias such estimates. Because of this, we did not incorporate that approach into this study.
In the future, climate is likely to show increased frequencies of extreme events. Methodologies for studying health outcomes associated with weather, climate and climate change incorporating time are also necessary when estimating the efficacy of climate change intervention measures. We need to study and reduce such effects as much as possible, not only with a regional but also with a global perspective which targets interventions to areas most affected by climatic change, especially with respect to younger age groups. The effects of climate change on health are complex and a general preparedness should be reached in all countries, irrespective of the scenarios and outcomes, since these may be very different from future impacts. However, when studying the effects of extreme climate on health we need to choose methodological approaches carefully.
8 Conclusion
Different approaches for studying the effects of an extreme climate event on health can result in highly variable estimates. Further research is needed to identify methods yielding the most accurate estimates. However, one of the approaches used here (the second) seems to have performed better than the others in estimating the excess rates associated with this heat episode. The three first approaches foretold a significant increase in hospital admissions related to the heat episode. However, estimating relative risks of temperature or other determinants of disease may fail to incorporate the specific characteristics of the particular weather event, such as the duration. This means such estimates may be less appropriate for using in predicting the future burden of such events on human health, and in particular the burden of future heat waves.
9 Conflict of interest and funding
The authors have not received any funding or benefits from industry to conduct this study.
Acknowledgements
This work was supported by the Climatools Research Program at Naturvårdsverket (The Swedish EPA).
Related Research Data
References
- Confalonieri U, Menne B, Akhtar R, Ebi KL, Hauengue M, Kovats RS, et al.Human health. Climate change 2007: impacts, adaptation and vulnerability. Contribution of Working Group II to the fourth assessment report of the Intergovernmental Panel on Climate Change. Parry ML, Canziani OF, Palutikof JP, van der Linden PJ, Hanson CECambridge University Press. Cambridge, 2007; 391–431.
- Koelle K, Rodo X, Pascual M, Yunus M, Mostafa G. Refractory periods and climate forcing in cholera dynamics. Nature. 2005; 463: 696–700.
- Lindgren E, Gustafson R. Tick-borne encephalitis in Sweden and climate change. Lancet. 2001; 358: 1731–2.
- Kovats S, Hajat S. Heat stress and public health. Annu Rev Public Health. 2008; 29: 41–55.
- Basu R, Samet JR. Relation between elevated ambient temperature and mortality: a review of the epidemiologic evidence. J Epidemol Rev. 2002; 24: 190–202.
- Michelozzi P, De'Donato F, Bisanti L, Russo A, Cadum E, DeMaria M, et al.. The impact of the summer 2003 heat waves on mortality in four Italian cities. Euro Surveill. 2005; 10: 161–5.
- Johnson H, Kovats RS, McGregor G, Stedman J, Gibbs M, Walton H. The impact of the 2003 heat wave on daily mortality in England and Wales and the use of rapid weekly mortality estimates. Euro Surveill. 2005; 10: pii = 558.
- Conti S, Meli P, Minelli G, Solimini R, Toccaceli V, Vichi M, et al.. Epidemiologic study of mortality during the summer 2003 heat wave in Italy. Environ Res. 2005; 98: 390–99.
- Semenza JC, McCollough JE, Flanders D, McGeehin MA, Lumpkin JR. Excess hospital admissions during the July 1995 Heat Wave in Chicago. Am J Prev Med. 1999; 16: 269–77.
- Whitman S, Good G, Donoghue ER, Benbow N, Shou W, Mou S. Mortality in Chicago attributed to the July 1995 Heat Wave. Am J Public Health. 1997; 87: 1515–8.
- Garssen J, Harmsen C, De Beer J. The effect of the 2003 heat wave on mortality in the Netherlands. Euro Surveill. 2005; 10: 165–8.
- Grize L, Huss A, Thommen O, Schindler C, Braun-Fahrländer C. Heat wave 2003 and mortality in Switzerland. Swiss Med Wkly. 2005; 135: 200–5.
- Rey G, Jougla E, Fouillet A, Pavillon G, Bessemoulin P, Frayssinet P, et al.. The impact of major heat waves on all-cause and cause-specific mortality in France from 1971 to 2003. Int Arch Occup Environ Health. 2007; 80: 615–26.
- Armstrong B. Models for the relationship between ambient temperature and daily mortality. Epidemiology. 2006; 17: 624–31.
- Le Tertre A, Le Franc A, Eilstein D, Declercq C, Medina S, Blanchard M, et al.. Impact of the 2003 heat wave on all-cause mortality in 9 French cities. Epidemiology. 2006; 17: 75–9.
- Parsons K. Human thermal environment. The effects of hot, moderate and cold temperatures on human health, comfort and performance2nd ed. CRC. New York, 2003
- Kovats RS, Ebi KL. Heatwaves and public health in Europe. Eur J Public Health. 16: 592–99.
- Fouillet A, Rey G, Laurent F, Pavillon G, Bellec S, Guihennuec-Jouyaux C, et al.. Excess mortality related to the August 2003 heat wave in France. Int Arch Occup Environ Health. 2006; 80: 16–24.
- Vandetorren S, Bretin P, Zeghnoun A, Mandereau-Bruno L, Croisier A, Cochet C, et al.. August 2003 heat wave in France: risk factors for death of elderly people living at home. Eur J Public Health. 2006; 16: 583–91.
- Pirard P, Vandentorren S, Pascal M, Laaidi K, Le Tertre A, Cassadou S, et al.. Summary of the mortality impact assessment of the 2003 heat wave in France. Euro Surveill. 2005; 10: 153–6.
- Kovats RS, Hajat S, Wilkinson P. Contrasting patterns of mortality and hospital admissions during hot weather and heat waves in Greater London, UK. Occup Environ Med. 2004; 61: 893–8.
- Michelozzi P, Accetta G, De Sario M, D'Ippoliti D, Marino C, Baccini M, et al.. High temperature and hospitalization for cardiovascular and respiratory causes in 12 European cities. Am J Respir Crit Care Med. 2009; 179: 383–9.
- Knowlton K, Rotkin-Ellman M, King G, Margolis HG, Smith D, Solomon G, et al.. The 2006 California heat wave: impacts on hospitalizations and emergency department visits. Environ Health Perspect. 2009; 117: 61–7.
- Matsrangelo G, Hajat S, Fadda E, Buja A, Fedeli U, Spolaore P. Contrasting patterns of hospital admissions and mortality during heat waves: are deaths from circulatory disease a real excess or an artifact. Med Hypotheses. 2006; 66: 1025–8.
- Hansen AL, Peng B, Ryan P, Nischke M, Pisaniello, Tucker G. The effect of heat waves on hospital admissions for renal disease in a temperate city of Australia. Int J Epidemiol. 2008; 37: 1359–65.
- Hajat S, Armstrong BG, Gouveia N, Wilkinson P. Mortality displacement of heat-related deaths – a comparison of Delhi, São Paulo, and London. Epidemiology. 2005; 16: 613–20.
- Rocklöv J, Forsberg B. The effect of temperature on mortality in Stockholm 1998–2003: a study of lag structures and heat wave effects. Scand J Public Health. 2008; 36: 516–23.
- Rocklöv J, Forsberg B, Meister K. Winter mortality modifies the heat-mortality association the following summer. Eur Respir J. 2009; 33: 245–51.
- Schär C, Luigi Vidale P, Luthi D, et al.. The role of increasing temperature variability in European summer heat waves. Nature. 2004; 427: 332–6.
- R development core team. R: a language and environment for statistical computing. R foundation for statistical computing. Vienna, Austria. Available from: http://www.R-project.org; 2007.