Abstract
Background: Availability of longitudinal data on hypertension and blood pressure levels are important to assess changes over time at the population level. Moreover, detailed information in different population sub-groups is important to understand inequity and social determinants of blood pressure distribution in the population.
Objectives: The objectives of this study are to: (1) describe the trends of population blood pressure levels in men and women between different educational levels and geographic areas in Sweden during 1990–2010; (2) identify prevalences of hypertension, awareness, treatment, and control in the population; and (3) assess the 10-year risk of developing hypertension among individuals with normal and high normal blood pressures.
Methods: This study is based on data from the Västerbotten Intervention Program (VIP) in Västerbotten County, Sweden. The cross-sectional analysis includes 133,082 VIP health examinations among individuals aged 30, 40, 50, and 60 years from 1990 to 2010. The panel analysis includes 34,868 individuals who were re-examined 10 years after the baseline examination. Individuals completed a self-administered health questionnaire that covers demographic and socio-economic information, self-reported health, and lifestyle behaviours. Blood pressure measurement was obtained prior to the questionnaire. In the cross-sectional analysis, trends of blood pressure by sex, and between educational groups and geographic areas are presented. In the panel analysis, the 10-year risk of developing hypertension is estimated using the predicted probability from logistic regression analysis for each sex, controlling for age and educational level.
Results: The prevalence of hypertension decreased from 1990 to 2010; from 43.8 to 36.0% (p < 0.001) among men, and 37.6 to 27.5% among women (p < 0.001). Individuals with basic education had a significantly higher prevalence of hypertension compared to those with medium or high education. Although the decreases were observed in all geographic areas, individuals in rural inland areas had a much higher prevalence compared to those who lived in Umeå City. The proportion of hypertensive women who were aware of their hypertension (61.7%) was significantly higher than men (51.6%). About 34% of men and 42% of women with hypertension reported taking blood pressure medication. Over time, awareness and control of hypertension improved (from 46.5% in 1990 to 69% in 2010 and from 30 to 65%, respectively). The gaps between educational groups diminished. This study shows a significantly higher risk of developing hypertension for men and women with high normal blood pressure compared to those with normal blood pressure at baseline in all age cohorts and educational groups. The average risks of developing hypertension among men with high normal blood pressure were 21.5, 45.8, and 56.3% in the 30, 40, and 50-year cohorts, respectively. Corresponding numbers for women were 22.6, 47.4, and 57.9%.
Conclusions: Levels of blood pressure and hypertension decreased significantly among the Västerbotten population in the last 21 years. Hypertension management has improved and there is increased awareness, treatment, and control of blood pressure. Despite these achievements, the persisting social gaps in blood pressure levels and management demand further investigation and action from policy makers. Future research should attempt to identify and address the root causes of these health inequities to ensure better and equal health for the whole population.
Hypertension is an established, classical risk factor of chronic non-communicable disease. In 2000, hypertension was estimated to affect 26.4% of the global adult population. This prevalence is predicted to increase to 29.2% by 2025. About 66% of the hypertensive population lives in developing countries Citation1 where the burdens of hypertension are not well-known or well-acknowledged. In their review of the global hypertension burden, Kearney et al. analysed hypertension prevalence data from 25 countries. These countries were primarily the US, Europe, Australia and Japan, and only a few were from low or middle income countries such as China, India, and sub-Saharan Africa Citation1. The WHO Global Infobase on chronic diseases and their risk factors presents global blood pressure data, however there are few data available from low or middle income countries Citation2.
Availability of longitudinal data on hypertension and blood pressure levels is important to assess changes over time at the population level. Moreover, detailed information in different population sub-groups is important to understand inequity and social determinants of blood pressure distribution in the population. The WHO MONICA data show a decrease in the prevalence of hypertension in most of the MONICA populations during the 1980s to 1990s Citation3. In the Northern Sweden MONICA population, a significantly larger decrease of blood pressure was observed in women aged 25–64 years between 1986 and 2009 than in men (a decrease of systolic and diastolic blood pressures by 4.9/3.9 mmHg in women and 1.8/1.5 mmHg in men). A significantly larger decrease of 12.6/6.1 mmHg was observed in men and women aged 65–74 years old between 1986 and 2009. This might be explained by the increased use of blood pressure medications in this age group during the same period Citation4. In an earlier Northern Sweden MONICA report of 1986–1999, the population with lower educational levels had higher systolic blood pressure than those with university degrees, but no differences in diastolic blood pressure were observed between the population with different educational levels Citation5. The US National Health and Nutrition Examination Survey (NHANES) showed a 3.7% increase in hypertension prevalence during 1988–2000. The survey indicated that over 58 million (one third of the adult US population) had hypertension in 1999–2000, with a higher prevalence among non-Hispanic blacks and women Citation6.
Despite the importance of the population left shift in blood pressure distribution, management and treatment of established hypertension are also important. Pereira et al. recently reviewed available evidence on global hypertension management, and showed that there are no differences in prevalence, awareness, treatment, or control of hypertension between developed and developing countries Citation7. The US NHANES pointed out that hypertension control is much lower among women, Mexican Americans, and adults 60 years or older Citation6. The WHO MONICA study reported increases in prevalence of awareness and treatment among hypertensive patients in 75% of male and 66% of female populations during the 10-year period Citation3. Only 7% of the Northern Sweden MONICA population were taking blood pressure medications, and among those treated, only 40% had a blood pressure lower than 160/95 mmHg. These levels did not change from 1986 to 1999 Citation5. In an updated report, the proportions of men and women aged 25–64 years in the Northern Sweden MONICA who reported using blood pressure medication in 2009 were 12.6 and 8.8%, respectively. The corresponding numbers for men and women aged 65–74 years old were 43.1 and 47.6% Citation4. In a cross-sectional study within the Northern Sweden MONICA cohorts and the Västerbotten Intervention Program during 1990–1999, Weinehall et al. reported that among the 32% of hypertensive patients, only 3% were treated adequately, 6% were poorly treated, and 7% were untreated. The population with poorly controlled blood pressure had a higher risk of stroke, and this study demonstrated the importance of hypertension management Citation8.
Research shows a strong association between socio-economic conditions and health, even in economically advantaged welfare societies. Understanding the health gaps between different population groups and identifying social determinants related to the gaps provides evidence to develop public health program to counteract the health inequality Citation9. A consistent, strong association between socio-economic status and hypertension has also been reported, although the underlying mechanisms are poorly understood Citation10–Citation12. In a multi-site survey of hypertension in Latin America, India, and China, Prince et al. reported lower levels of hypertension among populations with high education in urban and more developed sites. In contrast, higher levels of hypertension were observed among populations with high education in rural and less developed sites. These illustrate how the associations are modified by different stages of the health transition in low and middle income countries Citation13. In a 30-year follow-up of Framingham offspring in the US, Loucks et al. reported an inverse association between education and systolic blood pressure. The effect was stronger in women with low education, even after adjustment for baseline blood pressure levels. Though weaker than for systolic blood pressure, a same pattern was observed for diastolic blood pressure Citation10. Socioeconomic status not only influences the incidence of hypertension and its complications, such as incident coronary heart disease Citation14, but it may also influence hypertension management and control Citation12 Citation13.
In many high income countries, such as in Sweden, availability of longitudinal data on chronic disease risk factors such blood pressure at population level provides opportunity to assess how the risk factors and their management and control change over time. Such analyses will provide hard evidence on how the health system has responded to the changing burden of risk factors and its impact in the population level. The objectives of this study are, therefore, to:
describe the trends of population blood pressure levels in men and women between different educational levels and geographic areas in Västerbotten County, Sweden, during 1990–2010;
identify prevalences of hypertension, awareness, treatment, and control; and
assess the 10-year risk of developing hypertension among individuals with normal and high normal blood pressures.
Methods
Study area
This study utilizes data from the Västerbotten Intervention Program (VIP) conducted in Västerbotten County in the northern part of Sweden. The Västerbotten County has one of the highest mortality from myocardial infarction in Sweden in the 1970s–80s. A small pilot community study was later initiated in small municipality of Norsjö in 1985 to address the issue. The study has subsequently been up-scaled to the whole Västerbotten County as the VIP to reduce morbidity and mortality from CVD and diabetes. The life expectancy has increased from 73.3 years in early 80s to 79.3 years in late 2000 among men, and from 78.5 to 83.3 among women. The mean age of the population was 41.4 years in 2011, slightly higher than the national average of 41.1 years.
Participants
Since 1990, the VIP has gradually been integrated as routine health examinations performed at all primary health care centres in Västerbotten County. Individuals who turn 30, 40, 50, and 60 are invited to the examination at their local health care centre. During 1990 and 2010, 133,082 examinations were conducted. In the cross-sectional analysis, 9,136 individuals aged 30 are excluded as only a few health centres continued to invite this age group after 1995. A total of 34,868 individuals were examined twice, including 1,042 who participated three times (in 1990, 2000, and 2010). We created a panel dataset that includes all individuals who participated twice and excluded the third examination observations. Individuals aged 30 who were examined during 1990–1995 are included in the panel data analysis.
Measurements
Upon consent, each individual completed the self-administrated health questionnaire that covers demographic and socio-economic information, self-reported health, and lifestyle behaviours. The questionnaire was completed after blood pressure measurement and blood sampling were done. Blood pressure was taken in a recumbent position using a manual sphygmomanometer on the right mid-arm at the level of heart. Respondents were asked to rest for at least 5 min before blood pressure measurements. Two blood pressure measurements were taken, and the average systolic and diastolic blood pressures were recorded. Since 1 September 2009, all blood pressure measurements were taken in sitting position. Hence, the data collected since that date are calibrated to make them comparable to previous data taken in a recumbent position. Details about the calibration can be found in . Respondents were asked if they took any blood pressure lowering medication in the previous 14 days. The WHO definition of hypertension as systolic blood pressure (SBP) ≥140 mmHg or diastolic blood pressure (DBP) ≥90 mmHg, or taking blood pressure lowering medication in the last 14 days, was used to define hypertension Citation15. Awareness of hypertension was defined as a self-reported diagnosis of hypertension by a health professional. Treatment of hypertension was defined as self-reported use of an antihypertensive drug in the last 14 days. Control of hypertension was defined as having an averaged SBP <140 mmHg and DBP <90 mmHg.
Based on their highest education achievement, the respondents were categorized as those with basic education (those who completed 9 years of compulsory education), medium education (those who completed 12 years of education), or high education (those who graduated from university). Based on area of residence, we categorized participants into Umeå City, Skellefteå town, rural inland areas (including the communities of Åsele, Bjurholm, Dorotea, Malå, Norsjö, Sorsele, Storuman, Vilhelmina, and Lycksele town), or rural coastland areas (communities of Nordmaling, Robertsfors, Vännas, and Vindeln).
The results of the questionnaire, physical measurements and blood examinations were discussed with the participant at the time of the examination. Detailed descriptions of the study methods are presented elsewhere Citation16.
Statistics
Mean systolic and diastolic blood pressure levels and prevalences of hypertension were adjusted for age, and are presented graphically by sex, age group and educational level. The prevalence of hypertension was adjusted for age and educational level and presented graphically by geographic area. Time trends were graphed with 2-year moving averages using the graph function in Microsoft Excel. Hypertension prevalences were adjusted for age and presented with 99% confidence intervals (CI). Prevalences of hypertension, proportion of hypertensive patients aware of their hypertension status, proportion of those who were aware and under treatment, and proportion of those who were under treatment and had controlled blood pressure are presented.
The 10-year risks of developing hypertension were calculated for each age cohort using the predicted probability from the logistic regression analysis for each sex, controlling for age and educational level. Risk was calculated separately for those with normal baseline blood pressure (SBP <130 and DBP <85) and those with high normal baseline blood pressure (130 ≤SBP <140 or 85 ≤DBP <90) Citation15. All statistical analyses were conducted in STATA Version 11. Due to the large sample size, a p-value of 0.01 was used to signify statistical significance rather than the conventional p-value of 0.05.
Results
During 1990–2010, 123,946 individuals aged 40, 50, and 60 participated in the VIP. The response rate improved from around 56% in 1995 to 69% in 2010. Missing blood pressure or educational level data led to the exclusion of 2,224 observations. Hence, 121,722 individuals had data available for analysis (33% were 40 years old, 35% were 50 years old, and 32% were 60 years old). About 32% of 40 year olds had high education, compared to 20% in the 60-year-old cohort. Similarly, 42% of the 60-year-old cohort had basic education, compared to 11% of the 40-year-old cohort (). We intentionally grouped observations from the last three years period separately, in order to ensure comparability of six year intervals during 1990–2007 used in other papers in this VIP series Citation17–Citation20.
Table 1. Distributions of the participants in the Västerbotten Intervention Programme from 1990 to 2007
Age, educational and geographic differentials in blood pressure
Biologic differences
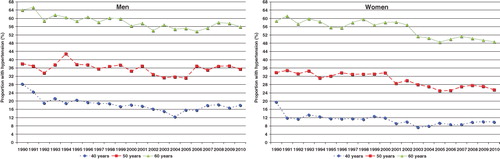
The population age-adjusted mean systolic blood pressure in men decreased steadily from 132.2 mmHg in 1990 to 127.4 mmHg in 2010. Among women, the corresponding numbers were 128.8 mmHg in 1990 and 121.1 mmHg in 2010. The population decrease in systolic blood pressure level was more prominent among men and women aged 60 years old compared to younger cohorts. The diastolic blood pressure decreased among all age-cohorts during 1990–2003, then it reversed and has subsequently increased steadily (data not shown). The dynamic of population systolic and diastolic blood pressure levels resulted in decreasing population age-adjusted levels of pulse pressure from 50.3 mmHg in 1990 to 45.9 mmHg in 2010 among men, and from 49.6 to 44.0 mmHg among women. These changes were significantly more prominent among the oldest cohort (data not shown). The prevalence of hypertension decreased significantly during these 21 years, from 43.8% in 1990 to 36.0% in 2010 among men and from 37.6 to 27.5% among women (p < 0.001). Overall, the decreasing trends in levels of hypertension were more prominent among women than men ().
Fig. 1. Prevalence of hypertension (%) among adults aged 40, 50, and 60 years in the Västerbotten Intervention Programme,1990_2010.
Gaps between educational groups
Individuals with basic education had higher levels of systolic blood pressure compared to those with medium or high education. These gaps in systolic blood pressure levels among individuals in different educational groups were more prominent in women than men. Even so, decreasing trends of systolic blood pressure were observed in all educational groups, and the gap between educational groups was slightly less in 2010 than 1990. Diastolic blood pressure levels were stable in the early periods, decreased during 1998–2002, but increased steadily since 2003. Trends in diastolic blood pressure levels between educational groups have been consistent over time (). When stratified by educational group, the prevalence of hypertension increased during 2006–2010 among men with basic education. This trend was in contradictory to other groups. Hypertension prevalence during 2008–2010 was not significantly different from 1990–1995, except among women with basic or medium education. The prevalence of hypertension among women with basic education decreased from 47.4 to 38.3%, and from 29 to 25.6% among women with medium education (data not shown).
Fig. 2. Levels of (a) systolic blood pressure (mmHg); (b) diastolic blood pressure (mmHg); and (c) prevalence of hypertension (%) among adults across educational groups in the Västerbotten Intervention Programme, 1990–2010. Levels are adjusted for age.

Geographic differences
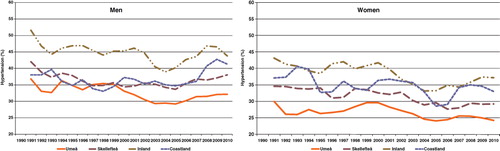
Geographic differences in the population level of hypertension over time also exist. Hypertension prevalences decreased over time in all geographic areas in the county. The 2010 levels of hypertension averaged 5% lower than those observed in 1990 in men and women in all geographic regions, except among men in the rural coastland areas. There, a significant increase in hypertension prevalence was observed during 2007–2010. The prevelances of hypertension increased in the last 5 years among the populations in rural inland and coastland, and they were quite plateau in the cities. Both men and women who lived in Umeå City had lower prevalences of hypertension over time. This was in contrast to the rural inland population who had higher prevalences, especially among men. Prevalences among men who lived in Skellefteå town and rural coastland areas were similar during 1990–2006 ().
Fig. 3. Prevalence of hypertension (%) in the Västerbotten Intervention Programme, 1990–2010, between geographic areas. The levels are adjusted for age and educational level. The graphs represent two-year moving averages.
Awareness and management of hypertension in Västerbotten County during 1990–2010
Awareness
Overall, the prevalence of hypertension in men (34.4%) was significantly higher than in women (28.7%) in Västerbotten County (p < 0.001). The proportion of hypertensive women who were aware of their hypertensive status (61.7%) was significantly higher than among men (51.6%, p < 0.001). There were no differences in the proportion of women in different age groups who were aware of their hypertension. However, there were significantly fewer men in the 40-year-old cohort who were aware compared to older male cohorts. Fewer men and women with basic education were aware of their hypertension compared to individuals with high educational levels (). The proportion of hypertensive men and women who were aware of their hypertensive status increased from 46.5% in 1990 to 69% in 2010, adjusted for age and education levels (data not shown).
Table 2. Mean prevalence, awareness, treatment, and control of hypertension among adults in the Västerbotten Intervention Programme. The values are adjusted by age and year of examination
Treatment
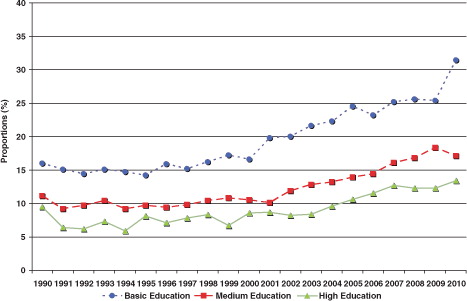
About 34% of men and 42% of women with hypertension reported taking blood pressure medication. A total of 64.5% of men and 67.2% of women who were aware of their hypertension status were taking medication. Only 36% of men and 43% of women in the 40-year-old cohorts who were aware of their hypertension reported taking medication. This is in contrast to about three-quarters of men and women in 60-year-old cohorts who were aware and treated. There were significantly higher proportions of men and women with basic education who were aware of their hypertension and being treated with blood-pressure lowering medication (). The proportion of individuals who reporting taking blood pressure lowering medication increased from 11.3% in 1990 to 18.6% in 2010. The increases were particularly prominent among men and women with basic education, among whom the proportion reporting medication use increased from 16% in 1990 to 32% in 2010 ().
Fig. 4. Proportions of individuals who reported taking blood pressure-lowering treatment in the Västerbotten Intervention Programme, 1990–2010. Proportions are adjusted for age and sex.
Control
Among treated women, 43.5% achieved treatment goals, as did 34.6% of men. Despite a larger proportion of men and women with basic education in the 60-year-old cohorts who reported medication use, a smaller proportion of them achieved the treatment goal compared to younger age-cohorts and those with high educational levels (). The proportion of men and women who received treatment and reached the treatment goal increased over time from about 30% in 1990 to around 65% in 2010. The gaps between educational groups diminished over time (). Slightly fewer hypertensive individuals with basic education were not on medication compared to other educational groups (data not shown).
Fig. 5. Proportions of men and women who reported use of blood pressure lowering treatment and reached treatment goals in the Västerbotten Intervention Program, 1990–2010. Proportions are adjusted for age and sex.

Risk of developing hypertension
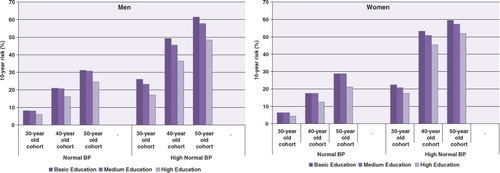
shows the 10-year risk of developing hypertension among VIP participants with normal or high normal blood pressure at the baseline examination. As expected, the risk of developing hypertension was higher among older men and women regardless of their baseline blood pressure. There is clearly a significantly higher risk of developing hypertension for men and women with high normal blood pressure compared to those with normal blood pressure at baseline in all age-cohorts and educational groups. There were no differences in risk of developing hypertension between individuals with basic or medium education in any age-cohort with normal baseline blood pressures. Both men and women in the 40- and 50-year-old cohorts with basic or medium education had significantly higher 10-yr risks of developing hypertension compared to those with high education. The gaps are more prominent in men and women with high normal blood pressure at baseline (). The average risks of developing hypertension among men with high normal blood pressure were 21.5, 45.8, and 56.3% in the 30-, 40-, and 50-year-old cohorts, respectively. The corresponding numbers among women were 22.6, 47.4, and 57.9%. The age-adjusted risks of developing hypertension among individuals with high normal blood pressure were significantly higher in men and women with basic education compared to those with high education [men with basic education 50.4% (99% CI 46.7–54.2%); men with high education 37.4% (33.5–41.4%); women with basic education 53.5% (49.4–57.5%); women with high education 45.7% (41.8–49.6%)].
Fig. 6. Ten-year risk of developing hypertension among participants in the Västerbotten Intervention Programme. Risk is presented as a function of age at the start of the 10-year period and education, stratified by baseline blood pressure.
Discussion
This study provides trends in adult population-based blood pressures from a well-established intervention program on cardiovascular disease that has been integrated into routine primary health care in Västerbotten County, Sweden, since 1990. The availability of longitudinal data, collected on all individuals who turn 40, 50 and 60 and recruited in VIP annually, allows reliable estimates of prevalence of hypertension at population level. The panel data, collected from the same individuals 10-year after the baseline, allow measurement of the 10-year incidence of hypertension and estimates of risk of developing hypertension in different population sub-groups. Several key findings need to be pointed out, discussed, and provided to health authorities at county and municipality levels.
First, systolic and diastolic blood pressure levels and hypertension among the Västerbotten population in Northern Sweden decreased from 1990 to 2010. The prevalence of hypertension increased among men with basic education during 2006–2010, in contrast to women and men in other educational groups. This finding may be in agreement with previous findings that the number of sedentary people increases in this particular group and but not in any of the other groups Citation20. Similar decreases in hypertension prevalence are observed among the Southern Sweden population Citation21, developed countries such as in Finland Citation22, Denmark Citation23, England Citation24, and the US Citation25, and low-income countries such as India Citation26. The decreasing trends of blood pressure in Sweden were observed concurrently with decreasing burdens of cardiovascular diseases and stroke. The Northern Sweden MONICA project, which covers the populations in Norrbotten and Västerbotten counties, reported declining stroke incidence in both non-diabetic and diabetes individuals from 1985 to 2003, except for diabetic men and non-diabetic women who had their with first stroke. Case-fatality and stroke mortality decreased in both sexes except among diabetic women Citation27. During the same period, myocardial infarction events and mortality decreased significantly. In men, the incidence of myocardial infarction decreased by 45%, from 550 to 300 per 100,000 population from 1985 to 2000–2002. The incidence ratio between men and women decreased from 5.5:1 during 1985–1987 to 3:1 during 2003–2004. Case-fatality rates from first myocardial infarction were reduced by 50% in both sexes. From 1985–2004, myocardial infarction mortality decreased in the 55–64-year-old age-groups by 75% in men and 50% in women Citation28. In Southern Sweden, improvements in cardiovascular disease risk factors such as decreasing levels of blood pressure and serum total cholesterol, and a declining prevalence of smoking might have resulted in the greater than 50% decline in acute myocardial infarctions Citation21.
Second, awareness and control of hypertension improves over time in the Västerbotten population. The proportions of individuals who are aware of their hypertension status, receive treatment, and meet treatment goals increases over time. Women report more frequent awareness of their hypertension status, a higher proportion of women are under treatment, and they have better blood pressure control when measured as meeting the treatment goal. This gender difference is consistently seen in all educational groups. The proportion of individuals under treatment who met the treatment goal increased from 34.3% in 1990 to 66% in 2010. This improvement is observed in all educational groups. In our study, the improvement among the older population is more prominent than in the other two younger age-cohorts. Better hypertension control, especially among elderly people, might provide the benefit of reducing the pace of other degenerative processes Citation29. Similar improvements in hypertension management and control that are demonstrated in this study have been shown in other settings such as in the UK Citation30 and Finland Citation31. The improvements are not only observed in developed settings. Awareness, treatment, and control of hypertension in many developing countries are at the same levels as those in developed countries. Unfortunately, hypertension prevalence in low-income settings are approaching those in high-income settings Citation7.
Despite the many observed improvements in hypertension management and control in the last two decades, the proportion of hypertension patients who achieved the treatment goals in our study is still less than 20%. Similar observations are reported from studies in Southern Sweden Citation32 Citation33. Treatment discontinuation, as shown by a national study based on the Swedish Prescribed Drug Register, is about 50% of the Swedish population who receive any hypertension drugs. This might contribute to poor hypertension control Citation34. Johnell et al. identified low social participation as potential contributing factor contributing to low adherence with antihypertensive medication among the population in a southern county of Sweden. This association differed between different municipalities in the study area, and illustrates the importance of population-level determinants on individual blood pressures Citation33. More studies are needed in Västerbotten County to identify individual compliance with antihypertensive treatment and factors associated with non-adherence Citation35. Public health interventions to promote adherence to antihypertensive treatments are crucial to achieve optimal results in the population.
Third, individuals with high normal blood pressure have a significantly higher 10-year risk of developing hypertension compared to those with normal blood pressure. Once identified as high normal Citation15 or borderline high Citation36, blood pressure levels of 130–139/85–89 are precursors of the future development of hypertension and cardiovascular morbidity and mortality Citation37–Citation39. The JNC VII report recommends lifestyle modifications that include weight reduction, physical activity, salt reduction, and fruit and vegetable consumption for individuals with borderline blood pressure Citation40. The results from this study, showing significant 10-year risk of progression to hypertension, even in the 30-year-old cohort, might strengthen calls for changes in hypertension treatment guidelines for individuals categorized as having high normal blood pressure. This emphasizes the importance of shifting the entire population blood pressure distribution through non-pharmacological interventions. Such a shift might lead to a smaller proportion of the population being at risk of developing hypertension Citation41. Health promotion efforts should be focussed on reducing common lifestyle related risk factors that are associated with high blood pressure in the population. In many resource constrained settings, tobacco control and salt reduction are identified as cost-effective interventions to curb potential non-communicable diseases Citation42. As data on salt consumption is not collected in the VIP, we cannot assess whether the changing patterns of blood pressure in our study population coincide with the level of salt consumption. Though the overall smoking prevalence has decreased significantly in Sweden during the last few decades, the VIP data showed a remaining high prevalence of smoking and snus use among population with basic education Citation18. Lifestyle modifications should be the first line treatment for patients with high normal blood pressure, and blood pressure should be monitored regularly to assess the effectiveness of lifestyle changes in reducing blood pressure Citation40.
Fourth, this study shows that differences in blood pressure levels, trends, and control between different educational levels have narrowed. Along with the overall decrease in population blood pressure level, gaps between different educational groups and geographic areas also narrowed. The levels of blood pressure and hypertension are consistently higher among adults with basic education than among those with high educational levels. Even though more individuals with basic education reported treatment for hypertension than those with high educational levels, the proportion of individuals with basic education who achieved the treatment goal was lower. Similar social gaps were observed for other risk factors in this population Citation17–Citation20. Future studies should aim to identify the root causes of inequity in blood pressure patterns observed between population sub-groups and geographic areas in order to alleviate negative social determinants of health and achieve healthy life for the entire population Citation43.
This study is built on a quality database of chronic disease risk factors in a Northern Sweden population that has been maintained since the early 1990s. In 1995, the Västerbotten Intervention Program was integrated into routine health care, allowing it to reach everyone in the target population. Some study limitations need to be mentioned. Because the data are integrated into the routines of the health care system, different health care personnel participate in the data collection at the primary health care centres in Västerbotten County. However, all staff who participate in the intervention program attend regular training process, and standardized questionnaires and measurement techniques have been used during the entire study period. The blood pressure measurement protocol changed in 2009 and we have calibrated to adjust blood pressures measured in recumbent and seated positions. Although this type of adjustment involves greater uncertainty, especially in the outer edges of the distribution, we believe the correction method used is reasonable in this kind of large study. The changes in national treatment guidelines for hypertension in early 1990s are not expected to affect the overall results.
In conclusion, despite the overall decrease in blood pressure levels and improvements in hypertension management and control observed among Västerbotten population over the last 20 years, persisting social gaps in blood pressure levels and management demand further investigation and action from policy makers. Future research should attempt to identify and address the root causes of these health inequities to ensure better and equal health for the whole population.
Conflict of interest and funding
The authors have not received any funding or benefits from industry to conduct this study.
Acknowledgement
This research was supported by the Umeå Centre for Global Health Research with support from FAS, the Swedish Council for Working Life and Social Research (grant no. 2006-1512).
Related Research Data
References
- Kearney PM, Whelton M, Reynolds K, Muntner P, Whelton PK, He J. Global burden of hypertension: analysis of worldwide data. Lancet. 2005; 365: 217–23.
- World Health Organization. WHO Global NCD Infobase. 2012; Available from: http://www.who.int/ncd_surveillance/infobase/en/ [cited 10 January 2012].
- Antikainen RL, Moltchanov VA, Chukwuma CSr., Kuulasmaa KA, Marques-Vidal PM, Sans S, et al.. Trends in the prevalence, awareness, treatment and control of hypertension: the WHO MONICA Project. Eur J Cardiovasc Prev Rehabil. 2006; 13: 13–29. 10.3402/gha.v5i0.18195.
- Eriksson M, Holmgren L, Janlert U, Jansson JH, Lundblad D, Stegmayr B, et al.. Large improvements in major cardiovascular risk factors in the population of northern Sweden: the MONICA study 1986–2009. J Intern Med. 2011; 269: 219–31. 10.3402/gha.v5i0.18195.
- Jansson J-H, Boman K, Messner T. Trends in blood pressure, lipids, lipoproteins and glucose metabolism in the Northern Sweden MONICA project 1986–99. Scand J Public Health. 2003; 31(Suppl 61): 43–50. 10.3402/gha.v5i0.18195.
- Hajjar I, Kotchen TA. Trends in prevalence, awareness, treatment, and control of hypertension in the United States, 1988–2000. JAMA. 2003; 290: 199–206. 10.3402/gha.v5i0.18195.
- Pereira M, Lunet N, Azevedo A, Barros H. Differences in prevalence, awareness, treatment and control of hypertension between developing and developed countries. J Hypertens. 2009; 27: 963–75. 10.3402/gha.v5i0.18195.
- Weinehall L, Ohgren B, Persson M, Stegmayr B, Boman K, Hallmans G, et al.. High remaining risk in poorly treated hypertension: the‘rule of halves’ still exists. J Hypertens. 2002; 20: 2081–8. 10.3402/gha.v5i0.18195.
- Friel S, Marmot MG. Action on the social determinants of health and health inequities goes global. Annu Rev Public Health. 2011; 32: 225–36. 10.3402/gha.v5i0.18195.
- Loucks EB, Abrahamowicz M, Xiao Y, Lynch JW. Associations of education with 30-year life course blood pressure trajectories: Framingham Offspring Study. BMC Public Health. 2011; 11: 139.10.3402/gha.v5i0.18195.
- Grotto I, Huerta M, Sharabi Y. Hypertension and socioeconomic status. Curr Opin Cardiol. 2008; 23: 335–9. 10.3402/gha.v5i0.18195.
- Minor D, Wofford M, Wyatt SB. Does socioeconomic status affect blood pressure goal achievement?. Curr Hypertens Rep. 2008; 10: 390–7. 10.3402/gha.v5i0.18195.
- Prince MJ, Ebrahim S, Acosta D, Ferri CP, Guerra M, Huang Y, et al.. Hypertension prevalence, awareness, treatment and control among older people in Latin America, India and China: a 10/66 cross-sectional population-based survey. J Hypertens. 2012; 30: 177–87. 10.3402/gha.v5i0.18195.
- Loucks EB, Lynch JW, Pilote L, Fuhrer R, Almeida ND, Richard H, et al.. Life-course socioeconomic position and incidence of coronary heart disease: the Framingham Offspring Study. Am J Epidemiol. 2009; 169: 829–36. 10.3402/gha.v5i0.18195.
- World Health Organization. International Society of Hypertension guidelines for the management of hypertension. Guidelines Sub-Committee. Blood Press Suppl. 1999; 1: 9–43.
- Norberg M, Wall S, Boman K, Weinehall L. The Västerbotten Intervention Programme: background, design and implications. Glob Health Action. 2010; 3. DOI: 10.3402/gha.v5i0.18195.
- Norberg M, Lindvall K, Stenlund H, Lindahl B. The obesity epidemic slows among the middle-aged population in Sweden while the socioeconomic gap widens. Glob Health Action. 2010; 3. DOI:10.3402/gha.v5i0.18195.
- Norberg M, Lundqvist G, Nilsson M, Gilljam H, Weinehall L. Changing patterns of tobacco use in a middle-aged population: the role of snus, gender, age, and education. Glob Health Action. 2011; 4. DOI: 10.3402/gha.v5i0.18195.
- Lindahl B, Stenlund H,Norberg M. Increasing glucose concentrations and prevalence of diabetes mellitus in northern Sweden, 1990–2007. Glob Health Action. 2010; 3. DOI: 10.3402/gha.v5i0.18195.
- Ng N, Soderman K, Norberg M, Ohman A. Increasing physical activity, but persisting social gaps among middle-aged people: trends in Northern Sweden from 1990 to 2007. Glob Health Action. 2011; 4. DOI: 10.3402/gha.v5i0.18195.
- Wilhelmsen L, Welin L, Svardsudd K, Wedel H, Eriksson H, Hansson PO, et al.. Secular changes in cardiovascular risk factors and attack rate of myocardial infarction among men aged 50 in Gothenburg, Sweden. Accurate prediction using risk models. J Intern Med. 2008; 263: 636–43. 10.3402/gha.v5i0.18195.
- Vartiainen E, Laatikainen T, Peltonen M, Juolevi A, Mannisto S, Sundvall J, et al.. Thirty-five-year trends in cardiovascular risk factors in Finland. Int J Epidemiol. 2010; 39: 504–18. 10.3402/gha.v5i0.18195.
- Andersen UO, Jensen GB. Trends and determinant factors for population blood pressure with 25 years of follow-up: results from the Copenhagen City Heart Study. Eur J Cardiovasc Prev Rehabil. 2010; 17: 655–9. 10.3402/gha.v5i0.18195.
- Unal B, Critchley JA, Capewell S. Modelling the decline in coronary heart disease deaths in England and Wales, 1981–2000: comparing contributions from primary prevention and secondary prevention. BMJ. 2005; 331: 614.10.3402/gha.v5i0.18195.
- Kanjilal S, Gregg EW, Cheng YJ, Zhang P, Nelson DE, Mensah G, et al.. Socioeconomic status and trends in disparities in 4 major risk factors for cardiovascular disease among US adults, 1971–2002. Arch Intern Med. 2006; 166: 2348–55. 10.3402/gha.v5i0.18195.
- Gupta R, Guptha S, Gupta VP, Agrawal A, Gaur K, Deedwania PC. Twenty-year trends in cardiovascular risk factors in India and influence of educational status. Eur J Cardiovasc Prev Rehabil. 2011. DOI: 10.3402/gha.v5i0.18195.
- Rautio A, Eliasson M, Stegmayr B. Favorable trends in the incidence and outcome in stroke in nondiabetic and diabetic subjects: findings from the Northern Sweden MONICA Stroke Registry in 1985 to 2003. Stroke. 2008; 39: 3137–44. 10.3402/gha.v5i0.18195.
- Lundblad D, Holmgren L, Jansson JH, Naslund U, Eliasson M. Gender differences in trends of acute myocardial infarction events: the Northern Sweden MONICA study 1985–2004. BMC Cardiovasc Disord. 2008; 8: 17.10.3402/gha.v5i0.18195.
- Carlberg B, Nilsson PM. Hypertension in the elderly: what is the goal blood pressure target and how can this be attained?. Curr Hypertens Rep. 2010; 12: 331–4. 10.3402/gha.v5i0.18195.
- Falaschetti E, Chaudhury M, Mindell J, Poulter N. Continued improvement in hypertension management in England: results from the health survey for England 2006. Hypertension. 2009; 53: 480–6. 10.3402/gha.v5i0.18195.
- Antikainen RL, Kastarinen MJ, Jousilahti P, Peltonen M, Laatikainen T, Beckett N, et al.. Despite evidence-based guidelines, systolic blood pressure remains inadequately controlled in older hypertensive adults. J Human Hypertens. 2010; 24: 439–46. 10.3402/gha.v5i0.18195.
- Hedblad B, Nerbrand C, Ekesbo R, Johansson L, Midlov P, Brunkstedt I, et al.. High blood pressure despite treatment: results from a cross-sectional primary healthcare-based study in southern Sweden. Scand J Prim Health Care. 2006; 24: 224–30. 10.3402/gha.v5i0.18195.
- Johnell K, Rastam L, Lithman T, Sundquist J, Merlo J. Low adherence with antihypertensives in actual practice: the association with social participation – a multilevel analysis. BMC Public Health. 2005; 5: 17.10.3402/gha.v5i0.18195.
- Nicotra F, Wettermark B, Sturkenboom MC, Parodi A, Bellocco R, Ekbom A, et al.. Management of antihypertensive drugs in three European countries. J Hypertens. 2009; 27: 1917–22. 10.3402/gha.v5i0.18195.
- Elliott WJ. Improving outcomes in hypertensive patients: focus on adherence and persistence with antihypertensive therapy. J Clin Hypertens (Greenwich). 2009; 11: 376–82. 10.3402/gha.v5i0.18195.
- Joint National Committee on prevention, detection, evaluation, and treatment of high blood pressure. Arch Intern Med. 1997; 157: 2413–46. 10.3402/gha.v5i0.18195.
- Suri MF, Qureshi AI. Prehypertension as a risk factor for cardiovascular diseases. J Cardiovasc Nurs. 2006; 21: 478–82.; quiz83–4. 10.3402/gha.v5i0.18195.
- Mainous AG3rd ,Everett CJ, Liszka H, King DE, Egan BM. Prehypertension and mortality in a nationally representative cohort. Am J Cardiol. 2004; 94: 1496–500. 10.3402/gha.v5i0.18195.
- Gu Q, Burt VL, Paulose-Ram R, Yoon S, Gillum RF. High blood pressure and cardiovascular disease mortality risk among U.S. adults: the third National Health and Nutrition Examination Survey mortality follow-up study. Ann Epidemiol. 2008; 18: 302–9. 10.3402/gha.v5i0.18195.
- Chobanian AV, Bakris GL, Black HR, Cushman WC, Green LA, Izzo JLJr, et al.. The seventh report of the Joint National Committee on prevention, detection, evaluation, and treatment of high blood pressure: the JNC 7 report. JAMA. 2003; 289: 2560–72. 10.3402/gha.v5i0.18195.
- Rose G. Sick individuals and sick populations. Int J Epidemiol. 2001; 30: 427–32. 10.3402/gha.v5i0.18195.
- Beaglehole R, Bonita R, Horton R, Adams C, Alleyne G, Asaria P, et al.. Priority actions for the non-communicable disease crisis. Lancet. 2011; 377: 1438–47. 10.3402/gha.v5i0.18195.
- Irwin A, Valentine N, Brown C, Loewenson R, Solar O, Brown H, et al.. The commission on social determinants of health: tackling the social roots of health inequities. PLoS Med. 2006; 3: e106.10.3402/gha.v5i0.18195.
Appendix 1. Calibration for conversion of sitting to recumbent blood pressure values and vice versa.
In the Västerbotten Intervention Programme (VIP), blood pressures were measured with participants in a recumbent position until 1 September 2009. After that date, measurements were taken with participants in a seated position. The calibration process was done separately for men and women in each age-cohort. A total of 648 participants were selected from 25 of the 40 primary health care centres, represent the whole county and included both urban and rural areas. Two blood pressure measurements were taken in each recumbent and seated position. The first measurement was done after 5 min rest, and the second 5 min after the first one. The reading was done at the nearest 2 mmHg. The mean value of the two readings in each position was used for the validation. Readings with a difference between the values exceeding 30 mmHg in systolic blood pressure and 25 in diastolic pressure were excluded.
