
Abstract
Background
Projected increases in weather variability due to climate change will have severe consequences on human health, increasing mortality, and disease rates. Among these, cardiovascular diseases (CVD), highly prevalent among the elderly, have been shown to be sensitive to extreme temperatures and heat waves.
Objectives
This study aimed to find out the relationship between daily temperature (and other weather parameters) and daily CVD hospital admissions among the elderly population in Thai Nguyen province, a northern province of Vietnam.
Methods
Retrospective data of CVD cases were obtained from a data base of four hospitals in Thai Nguyen province for a period of 5 years from 2008 to 2012. CVD hospital admissions were aggregated by day and merged with daily weather data from this period. Distributed lag non-linear model (DLNM) was used to derive specific estimates of the effect of weather parameters on CVD hospital admissions of up to 30 days, adjusted for time trends using b-splines, day of the week, and public holidays.
Results
This study shows that the average point of minimum CVD admissions was at 26°C. Above and below this threshold, the cumulative CVD admission risk over 30 lag days tended to increase with both lower and higher temperatures. The cold effect was found to occur 4–15 days following exposure, peaking at a week's delay. The cumulative effect of cold exposure on CVD admissions was statistically significant with a relative risk of 1.12 (95% confidence interval: 1.01–1.25) for 1°C decrease below the threshold. The cumulative effect of hot temperature on CVD admissions was found to be non-significant and was estimated to be at a relative risk of 1.17 (95% confidence interval: 0.90–1.52) for 1°C increase in the temperature. No significant association was found between CVD admissions and the other weather variables.
Conclusion
Exposure to cold temperature is associated with increasing CVD admission risk among the elderly population.
This paper is part of the Special Issue: Climate Change and Health in Vietnam. More papers from this issue can be found at http://www.globalhealthaction.net
The changing of the climate system is well documented and complex. It includes changes in the variability and average temperature, humidity, precipitation, and sea level. Global climate change is part of human-induced global environmental changes caused by greenhouse emissions aggravated by deforestation and ocean saturation (Citation1).
The impact of climate change is likely to be crucial in water resources, agriculture, forestry, fishery, energy, transportation, and health sectors (Citation1–Citation4). Indirect health impacts are also caused by changing microbial ecology (Citation1, Citation5), which increases risk of infectious diseases such as malaria and dengue fever (Citation6, Citation7), and diarrheal diseases (Citation8). Direct human health impacts include increased mortality and morbidity as results of heat waves, extreme weather events, and temperature-enhanced levels of urban air pollutants. The impacts of heat and cold temperatures have been documented in international studies (Citation9, Citation10) and studies carried on in North America (Citation11–Citation13), Europe (Citation14, Citation15), Asia (Citation16, Citation17), and Australia (Citation18–Citation20), with a significant effect of heat waves on mortality and morbidity being described. In developed countries, there have been several studies on the specific effects of extreme temperatures on stroke and cardiovascular events (Citation11, Citation21–Citation23). There have been pathophysiologic explanations of these effects. Low temperature causes blood vessels to narrow, which increases blood pressure and the risk of stroke and other cardiovascular events (Citation24) while high temperature causes blood vessels to dilate, which increases cardiac output and risk of decompensate heart failure (Citation25, Citation26). Both low and high temperatures put stress on the cardiovascular system, especially among the elderly with limited adaptive responses, and increase the risk of coronary heart disease (Citation27, Citation28).
Impacts of climate change will likely affect poor nations (Citation3, Citation4) and poor people the most (Citation25). However, in developing countries, studies on direct impacts of climate change on human health, which help to develop policy to mitigate the problems, are scanty. We have not found any quantitative publication on the impact of extreme temperatures on cardiovascular morbidity in Vietnam.
Vietnam has historically been a poor country, but has lately experienced a rapid economic, demographic, and epidemiological transition (Citation29). Vietnam has been traditionally a country with mainly communicable diseases, but recently a mixed pattern of communicable (including classical and emerging infectious diseases) and non-communicable diseases (e.g. cardiovascular disease, cancer, diabetes, mental illness) are characterizing the current epidemiological health profile of the population (Citation30). Geographically, Vietnam is situated in a tropical and monsoon area of the Southeast Asia peninsula. It lies in the tropic inner belt of the Northern hemisphere and is profoundly impacted by the Sea of East Vietnam. Sun elevation angle at noon time is lesser and length of day light is more varied, thus the radiation balance is lower and more varied in the North of Vietnam than in the South of Vietnam. Therefore, the temperature in winter is lower and the seasonal variation in temperature is higher in the North than in the South (Citation31). For example, in Ho Chi Minh city, the average high temperature in May is 33°C and the average low temperature in December is 22°C, whereas in Thai Nguyen, the average high temperature in June is 32°C and the average low temperature in January is 11°C (Citation32). Annual average precipitation commonly is within the range of 1,400–2,400 mm (Citation31).
In this study, we aim to find out the relationship between weather variables such as hours of sunshine, relative humidity, temperature, evaporation, rainfall, and CVD hospital admissions among the elderly in Thai Nguyen province by analyzing the medical records of daily hospitalizations over the period 2008 to 2012.
Methods
This study was conducted in Thai Nguyen, a northern province of Vietnam with a total population of 1,131,300. Thai Nguyen includes a city as the center of the province and eight rural districts. The population density is 318 km2. This density is higher than that of the whole country which is 259. The number of males per 100 females was 97.6. Nine percent of the population was aged 60 or above (Citation33).
Daily weather data were obtained for the Thai Nguyen province over the period 2008 to 2012 from Vietnam National Climate and Weather Center, Hanoi. Selected weather data include daily high temperature, daily low temperature, daily average temperature (degrees celsius), daily average air pressure (mbar), daily average humidity (%), daily evaporation (mm), daily precipitation (mm), and daily sunshine time (hours). The daily weather parameters were averaged over all weather stations in the province to produce a geographically representative exposure measure.
All hospital admissions due to cardiovascular diseases (CVD) over the 5-year period were included in the study. The hospital admissions were collected from four national and provincial hospitals of Thai Nguyen. There is one national hospital in this province named Thai Nguyen National General Hospital (TNGH), and three provincial hospitals referred to as hospital A, hospital C, and hospital of Corporation of Iron and Steel. Hospital admission data were extracted from computerized patient database by Departments of Planning and Informative Center. Data include patients’ age, sex, date of admission, and final diagnosis (as made by attending physicians at discharge). CVD cases included acute myocardial infarction, angina pectoris, congestive heart failure, hypertension, and stroke. All CVD hospital admissions were recorded, and from this all 18,975 elderly (>60 years) patient cases were used in data analysis. In our study, we defined elderly cases as people aged 60 or above. This definition is consistent with that stipulated in The Law of Elderly of Vietnam (Citation34).
Statistical analysis was done using R software version 3.0.1. Descriptive statistics for the weather variables and number of CVD admissions are presented in Table and 2 . Spearman's correlation coefficients was used for exploring the monotonic relation between daily admissions and weather variables. Pearson correlation coefficients between the weather variables was used for interpreting if daily admissions are associated with two or more weather variables. Distributed lag non-linear models (DLNMs) were used to estimate the association between CVD hospital admissions and lags of weather variables, adjusted for time trends using natural cubic splines, day of the week, and public holidays with the R package dlnm (Citation35, Citation36). To account for possible delayed associations, we examined the impact of weather up to 30 days before the admissions. To derive specific estimates of heat and cold slopes, the DLNM was applied with either a ‘V’- or ‘U’-shaped piecewise linear exposure–response relationship. This relationship involved specifying a single or double threshold for temperature and then estimating a log-linear change in risk of admissions above (or below) the hot (or cold) threshold(s).
Table 1 Description of daily weather and CVD hospitalized cases during 2008–2012 in Thai Nguyen province
Table 2 Percentage and number () of CVD hospital admissions and number of elderly CVD hospital admissions during the years, 2008–2012
Results
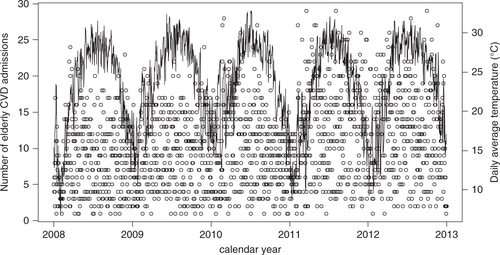
presents the elderly CVD admissions (hollow circles) and daily average temperature (solid line) during the 5-year period and shows the seasonal variation of daily average temperature and the erratic variation of elderly CVD admissions. Therefore, the relationship between these two variables is not clear in this graph.
Fig. 1 Daily average temperature (line) and number of daily elderly admissions (hollow circles).
Using Pearson's correlation coefficients, the daily average temperature was strongly inversely correlated with daily average air pressure (r=−0.8561, p<0.001), and was moderately or weakly positively correlated with daily sunshine hours, daily average humidity, daily evaporation, and daily precipitation with correlation coefficients amounting to 0.4948, 0.2538, 0.2314, 0.1360, respectively (p<0.001 for all four above correlations coefficients). Spearman's rank correlation coefficients were used to measure the crude relationship of each pair of temperature, air pressure, evaporation, humidity, precipitation, and hospital admitted cases allowing for potential non-linearities. The correlation coefficients are presented in and show a positive correlation of the temperature and negative correlation of daily average air pressure to the elderly CVD admissions. All of these correlations were significant with p-values less than 0.001. Daily evaporation, daily average humidity, and daily precipitation did not show a significant correlation with elderly CVD admissions.
Table 3 Spearman's rank correlation between the numbers of elderly CVD admissions and daily weather variability in Thai Nguyen province
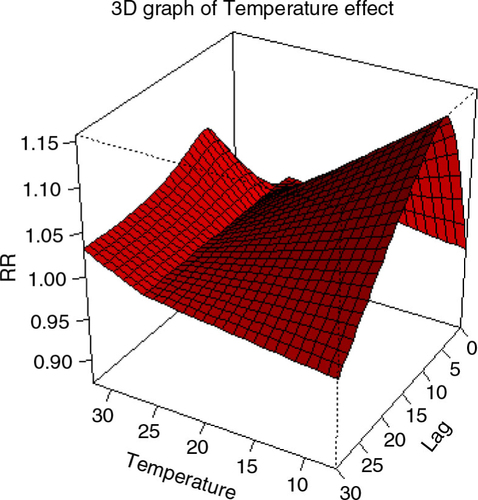
By using a DLNM with a linear threshold model for temperature, it was found that the exposure–response relationship for CVD admissions was described by a ‘V’ shape with a threshold temperature (of minimum CVD admissions) of 26°C. This relationship was adjusted for other time-varying factors ().
Fig. 2 The estimated covariate adjusted effect (relative risk, RR) of daily average temperature on elderly cardiovascular admissions (adjusted to time trends with natural cubic splines, day of the week, and public holidays). The graph shows that the average point of minimum cardiovascular diseases (CVD) admissions was at 26°C. Above and below this temperature, cumulative CVD admission risk over 30 lag days tended to increase.
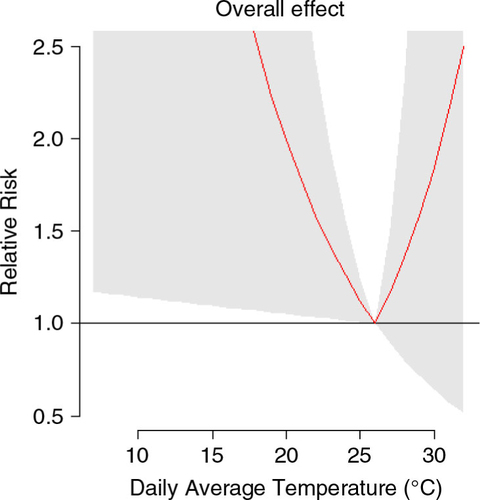
The cold effect was found significant while the heat effect was found to be non-significant. The overall effect of cold exposure on CVD admissions over lag 0–30 was estimated at a relative risk of 1.12 (95% confident interval: 1.01–1.25) for 1°C decrease below the threshold. The overall effect of heat exposure on CVD admissions was estimated at a non-significant relative risk of 1.17 (95% confidence interval: 0.90–1.52) for 1°C increase above the threshold ().
Fig. 3 The 30 days’ cumulative relative risk of cardiovascular diseases admission at different daily average temperature. Reference at 26°C. The 95% confident intervals are reported as shaded areas.
In , the left graphs from top present the relative risk by temperature at selected lags 0, 4, 7, 14, and 30 (the relationship for all lags modeled are presented in ). Low temperature did not have a clear effect at lag 0 but significantly increased CVD admission risk at lag 4, lag 7 (most significant), and lag 14, whereas high temperature reduced CVD admission risk at lag 0 and increased the risk of CVD admission at lag 4, lag 7, and lag 14 (but not significant). The effects of both low temperature and high temperature on CVD admissions became negligible at lag 30.
Fig. 4 Relative risk (RR) of cardiovascular diseases (CVD) admissions by temperature, which is denoted as Var, and lag using cross-basis smoothing. Left from top: RR by temperature at selected lags 0, 4, 7, 14, and 30°C. Right from top: RR by lag at selected temperatures 13, 20, 28, and 30°C. Risk of CVD admission is scaled to be relative to that at 26°C, the temperature that is sustained so that the CVD admission would be the lowest. Reference at 26°C. The 95% confident intervals are reported as shaded areas.
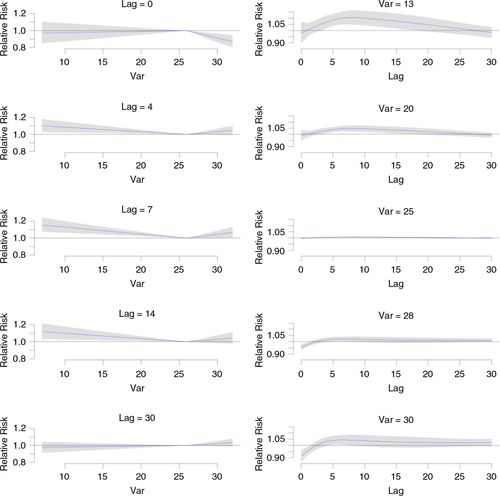
In , the right graphs from top present the relative risk by lag at selected temperatures 13, 20, 28, and 30°C. From these graphs, one can see that the effect of low temperature varies by lag time. Cold effect was found to generally occur 4–15 days following exposure, peaking at a week's delay. However, it is clear that overall, low temperatures increase the risk of CVD. The effect of the more extreme temperature (13°C) was more pronounced on CVD admissions than that of less extreme temperature (20°C). The effect of temperature at 25°C on CVD admissions is almost identical to that at 26°C, which is the reference temperature. The effect of temperature of 30°C which is higher than the reference temperature reduced the risk of CVD admissions at lag 0 and increased the risk of CVD admissions from lag 5 to lag 10. However, the overall effect of high temperature is not as pronounced as that of low temperature. The right graphs of also show that the effects of both low temperature and high temperature on CVD admissions became negligible at lag 30.
Using DLNM, we could not find any association of daily sunshine time, precipitation, or humidity on the elderly CVD admissions (results not shown).
We observed a significant effect of day of the week and public holidays in the elderly CVD admissions. During public holidays, the elderly CVD admissions is reduced by 50%. Weekday patterns revealed that compared to Friday, the admissions on Saturday and Sunday decreased but the admissions on Monday, Tuesday, Wednesday, and Thursday increased.
Discussions
The goal of this study was to estimate the effects of the weather parameter during the years 2008 to 2012 on elderly CVD hospital admissions in the Thai Nguyen province. This study shows that the average point of minimum CVD admissions was at 26°C. Above and below this threshold, cumulative CVD admission risk over 30 lag days tended to increase with both lower and higher temperatures. Cold effect was found to generally occur 4–15 days following exposure, peaking at a week's delay. The cumulative effect of cold exposure on CVD admission was statistically significant at a relative risk of 1.12 (95% confidence interval: 1.01–1.25) for every 1°C decrease below the threshold of 26°C. The cumulative effect of hot temperature on CVD admission was found to be non-significant and estimating a relative risk of 1.17 (95% confidence interval: 0.90–1.52) for 1°C increase in temperature. No significant association was found between CVD admissions and the other weather variables.
The effect of low temperature on CVD events can be explained by pathophysiology and have been well documented by several studies. At low temperature, the blood vessels become narrow and the blood pressure increase. Cold temperature could lead to thrombosis, and physical activity during cold weather can increase the risk of stable angina and acute coronary syndrome (Citation11, Citation24). Several studies have also shown that cold temperature increases the risk of CVD events (Citation9, Citation10) (Citation20, Citation24) (Citation36). However, the effect of low temperature on CVD admissions found in this study occurs at higher temperature thresholds and are of greater magnitude than the effect found in other studies. This supports the hypothesis that cold effect in a warmer climate, where people usually do not have good houses to protect them from the cold weather, appears to be severe than that in a colder climate (Citation10, Citation12). The cold effect found in this study generally occurred 4–15 days following exposure, peaking at a week's delay, and is consistent with the results of delayed cold effect found in other studies (Citation17, Citation36) (Citation37).
In this study, we could not find a significant cumulative heat effect on CVD admission as in some other studies (Citation11, Citation22). These results are, however, derived for admission and the situation may look different for mortality. For admissions, we observed a potentially large cumulative estimate amounting to 17% increase in mortality per degree increase in heat exposure on warm days. The less strong signal of high temperature on elderly in Thai Nguyen province suggests that the adaptation of people living in warmer climates, through physical adaptation, special housing characteristics or behavioral patterns, may make them less affected by effects of warm temperature. This finding is consistent with the finding from a study based on populations in a hot desert climate (Citation21), and in general when comparing cities with a warmer climate to cities with a cooler climate it appears the heat association is weaker in climatologically warmer areas (Citation9). Another explanation is that, in this study, hypertension is the most common cause of CVD admissions, and cold temperatures increase the blood pressure, whereas the effect of hot temperatures reduces the blood pressure.
Although the cumulative effect of high temperature increases the risk of CVD admissions, one intriguing result in this study is that high temperatures reduced the CVD admissions at lag 0. This reduction counters studies on the effects of hot temperature on mortality (Citation12, Citation18) (Citation28, Citation36) and on hospital admission (Citation11), where the effect of increasing risk starts at lag 0. Therefore, this result has to be confirmed or refuted by more studies carried out in developing, tropical countries. However, this may be explained by the fact that a high proportion of CVD admissions are for hypertensive disorders, whereas at high temperatures, the blood pressure will be reduced by decreased sympathetic tone and by dilated blood vessels (Citation38, Citation39). Non-significant increase in hospital admissions at lag 5 may be due to the harvesting effect (Citation25). The results also indicate a presumed behavioral adaptation to the prevailing weather conditions with respect to health-seeking behavior. Likewise, higher mortality rates in Europe during extreme heat waves are suggested to be partly due to people avoiding the bad weather and staying indoors instead of seeking medical care (Citation2, Citation40). It is important to study mortality rates in relationship to admissions to examine if the decrease in admissions further increases the associated mortality rates.
In conclusion, the relationship between daily average temperature and elderly CVD admissions found in this study can be described as a ‘V’ shape with an optimal temperature (the average point of minimum CVD admissions) of 26°C, which is higher than the threshold found in studies in temperate climate. This pattern is consistent with the adaptation hypothesis.
Conflict of interest and funding
There is no conflict of interest in this study. This research was partly supported by The Swedish International Development Cooperation Agency (grant no. 54000111), the Umeå Centre for Global Health Research with support from The Swedish Council for Working Life and Social Research (grant no. 2006-1512), and the Swedish Research Councils Swedish Research Links Program (grant no. 348-2013-6692).
Acknowledgements
We thank the project ‘Public health preparedness and response to critical global health issues in Vietnam and Sweden’ for financial and technical support, and we are grateful for the collaboration of four the Thai Nguyen hospitals’ leaders and managers. We also thank Assoc. Prof. Hoang Van Minh for his great support in the research as well in writing this paper.
Notes
This paper is part of the Special Issue: Climate Change and Health in Vietnam. More papers from this issue can be found at http://www.globalhealthaction.net
Related Research Data
References
- McMichael AJ. Globalization, climate change, and human health. N Engl J Med. 2013; 368: 1335–43. [PubMed Abstract].
- Rocklöv J, Forsberg B. Comparing approaches for studying the effects of climate extremes – a case study of hospital admissions in Sweden during an extremely warm summer. Glob Health Action. 2009; 2
- Richardson K, Steffen W, Schellnhuber HJ, Alcamo J, Barker T, Kammen DM, etal. Synthesis report on climate change: global risks, challenges and decisions. 2009; Copenhagen: University of Copenhagen.
- Stern N. The economics of climate change – the stern review. 2007; Cambridge: Cambridge University Press.
- Shuman EK. Global climate change and infectious diseases. Perspective. N Engl J Med. 2010; 368(12): 1061–3.
- Aström C, Rocklöv J, Hales S, Béguin A, Louis V, Sauerborn R. Potential distribution of dengue fever under scenarios of climate change and economic development. Ecohealth. 2012; 9: 448–54.
- Lyons C, Coetzee M, Chown S. Stable and fluctuating temperature effects on the development rate and survival of two malaria vectors, Anopheles arabiensis and Anopheles funestus. Parasit Vectors. 2013; 6: 104. [PubMed Abstract] [PubMed CentralFull Text].
- Morand S, Owers KA, Waret-Szkuta A, McIntyre KM, Baylis M. Climate variability and outbreaks of infectious diseases in Europe. Sci Rep. 2013; 3: 1774. [PubMed Abstract] [PubMed CentralFull Text].
- McMichael AJ, Wilkinson P, Kovats RS, Pattenden S, Hajat S, Armstrong B, etal. International study of temperature, heat and urban mortality: the ‘ISOTHURM’ project. Int J Epidemiol. 2008; 37: 1121–31. [PubMed Abstract].
- Barnett AG, Dobson AJ, McElduff P, Salomaa V, Kuulasmaa K, Sans S. Cold periods and coronary events: an analysis of populations worldwide. J Epidemiol Community Health. 2005; 59: 551–7. [PubMed Abstract] [PubMed CentralFull Text].
- Schwartz J, Samet JM, Patz JA. Hospital admissions for heart disease the effects of temperature and humidity. Epidemiology. 2004; 15: 755–61. [PubMed Abstract].
- Anderson BG, Bell ML. Weather-related mortality: how heat, cold, and heat waves affect mortality in the United States. Epidemiology. 2009; 20: 205–13. [PubMed Abstract] [PubMed CentralFull Text].
- Goldberg MS, Gasparrini A, Armstrong B, Valois MF. The short-term influence of temperature on daily mortality in the temperate climate of Montreal, Canada. Environ Res. 2011; 111: 853–60. [PubMed Abstract].
- Mastrangelo G, Fedeli U, Visentin C, Milan G, Fadda E, Spolaore P. Pattern and determinants of hospitalization during heat waves: an ecologic study. BMC Public Health. 2007; 7: 200. [PubMed Abstract] [PubMed CentralFull Text].
- Belmin J, Auffray J-C, Berbezier C, Boirin P, Mercier S, Revier Bed, etal. Level of dependency: a simple marker associated with mortality during the 2003 heatwave among French dependent elderly people living in the community or in institutions. Age Ageing. 2007; 36: 298–303. [PubMed Abstract].
- Huang W, Kan H, Kovats S. The impact of the 2003 heat wave on mortality in Shanghai, China. Sci Total Environ. 2010; 408: 2418–20. [PubMed Abstract].
- Goggins WB, Chan EY, Yang C, Chong M. Associations between mortality and meteorological and pollutant variables during the cool season in two Asian cities with sub-tropical climates: Hong Kong and Taipei. Environ Health. 2013; 12: 59. [PubMed Abstract] [PubMed CentralFull Text].
- Nitschke M, Tucker GR, Bi P. Morbidity and mortality during heatwaves in metropolitan Adelaide. Med J Aust. 2007; 187: 662–5. [PubMed Abstract].
- Wang XY, Barnett AG, Yu W, FitzGerald G, Tippett V, Aitken P, etal. The impact of heatwaves on mortality and emergency hospital admissions from non-external causes in Brisbane, Australia. Occup Environ Med. 2011; 69: 163–9. [PubMed Abstract].
- Turner LR, Connell D, Tong S. Exposure to hot and cold temperatures and ambulance attendances in Brisbane, Australia: a time-series study. BMJ Open. 2010; 2: e001074.
- Farajzadeh M, Darand M. Analyzing the influence of air temperature on cardiovascular, respiratory and stroke mortality in Tehran, Iran. J Environ Health Sci Eng. 2009; 6: 261–70.
- Ebi K, Exuzides K, Lau E, Kelsh M, Barnston A. Weather changes associated with hospitalizations for cardiovascular diseases and stroke in California, 1983–1998. Int J Biometeorol. 2004; 49: 48–58. [PubMed Abstract].
- Ohshige K, Hori Y, Tochikubo O, Sugiyama M. Influence of weather on emergency transport events coded as stroke: population-based study in Japan. Int J Biometeorol. 2006; 50: 305–11. [PubMed Abstract].
- The Eurowinter Group. Cold exposure and winter mortality from ischaemic heart disease, cerebrovascular disease, respiratory disease, and all causes in warm and cold regions of Europe. The Eurowinter Group. Lancet. 1997; 349: 1341–6.
- Greenberg JH, Bromberg J, Reed CM, Gustafson TL, Beauchamp RA. The epidemiology of heat-related deaths, Texas–1950, 1970–79, and 1980. Am J Public Health. 1983; 73: 805–7. [PubMed Abstract] [PubMed CentralFull Text].
- Rowell LB. Human cardiovascular adjustments to exercise and thermal stress. Physiol Rev. 1974; 54: 75–159. [PubMed Abstract].
- Kenney WL, Munce TA. Invited review: aging and human temperature regulation. J Appl Physiol (1985). 2003; 95: 2598–603.
- Basu R, Samet JM. Relation between elevated ambient temperature and mortality: a review of the epidemiologic evidence. Epidemiol Rev. 2002; 24: 190–202. [PubMed Abstract].
- Vietnam Consultative Group Meeting. Vietnam development report: Market economy for a middle-income Vietnam . 2011. Hanoi: Joint Donor Report.
- Tu NTH, Huong NTL, Diep NB. Globalization and its effects on health care and occupational health in Vietnam. 2004. Geneva: United Nations Research Institute for Social Development.
- Institute of Strategy and Policy on Natural Resources and Environment. Vietnam assessment report on climate change. 2009; Hanoi: Institute of Strategy and Policy on Natural Resources and Environment.
- Canty and Associates LLC. 2014; Weatherbase: Thai Nguyen, Vietnam. Available from: http://www.weatherbase.com/weather/weather.php3?s=13884&cityname=Thai-Nguyen-Thai-Nguyen-Vietnam [cited 24 April 2014].
- General Statistics Organization of Vietnam. Main results of National Census in 2009. 2009; Hanoi: General Statistics Organization of Vietnam.
- Vietnam Assembly. The Ordinance of Elderly of Vietnam No 23/2000/PL-UBTVQH dated 28/04/2000. 2000. Hanoi: Socialist Republic of Vietnam.
- Gasparrini A. Distributed Lag Linear and Non-Linear Models in R: The Package dlnm. J Stat Softw. 2011; 43: 1–20. [PubMed Abstract] [PubMed CentralFull Text].
- Armstrong B. Models for the relationship between ambient temperature and daily mortality. Epidemiology. 2006; 17: 624–31. [PubMed Abstract].
- Gasparrini A, Armstrong B. Reducing and meta-analysing estimates from distributed lag non-linear models. BMC Med Res Methodol. 2013; 13: 1. [PubMed Abstract] [PubMed CentralFull Text].
- Jansen PM, Leineweber MJ, Thien T. The effect of a change in ambient temperature on blood pressure in normotensives. J Hum Hypertens. 2001; 15: 113–17. [PubMed Abstract].
- Kunutsor SK, Powles JW. The effect of ambient temperature on blood pressure in a rural West African adult population: a cross-sectional study. Cardiovasc J Afr. 2010; 21: 17–20. [PubMed Abstract] [PubMed CentralFull Text].
- Kovats RS, Hajat S, Wilkinson P. Contrasting patterns of mortality and hospital admissions during hot weather and heat waves in Greater London, UK. Occup Environ Med. 2004; 61: 893–8. [PubMed Abstract] [PubMed CentralFull Text].