
Abstract
Background
Rift Valley fever (RVF) is a vector-borne zoonotic disease that has an impact on human health and animal productivity. Here, we explore the use of vector presence modelling to predict the distribution of RVF vector species under climate change scenario to demonstrate the potential for geographic spread of Rift Valley fever virus (RVFV).
Objectives
To evaluate the effect of climate change on RVF vector distribution in Baringo County, Kenya, with an aim of developing a risk map for spatial prediction of RVF outbreaks.
Methodology
The study used data on vector presence and ecological niche modelling (MaxEnt) algorithm to predict the effect of climatic change on habitat suitability and the spatial distribution of RVF vectors in Baringo County. Data on species occurrence were obtained from longitudinal sampling of adult mosquitoes and larvae in the study area. We used present (2000) and future (2050) Bioclim climate databases to model the vector distribution.
Results
Model results predicted potential suitable areas with high success rates for Culex quinquefasciatus, Culex univitattus, Mansonia africana, and Mansonia uniformis. Under the present climatic conditions, the lowlands were found to be highly suitable for all the species. Future climatic conditions indicate an increase in the spatial distribution of Cx. quinquefasciatus and M. africana. Model performance was statistically significant.
Conclusion
Soil types, precipitation in the driest quarter, precipitation seasonality, and isothermality showed the highest predictive potential for the four species.
Climate change refers to statistically identifiable changes in the mean and/or variability of climate properties that persists over an extended period of time, typically over decades or longer (Citation1). These changes are due to both natural variability and anthropogenic activities. Observed climatic changes include changes in temperature and precipitation resulting in changes in soil moisture, increases in sea level, and a higher frequency of extreme weather events like floods and droughts (Citation2, Citation3). Climate change can directly affect disease transmission through shifting vector geographic range, changing the reproductive and biting rates, or shortening of pathogen's incubation period (Citation4). Many prevalent human diseases are linked to climate fluctuations through flooding, heat waves, altered transmission of infectious diseases, and malnutrition from crop failures (Citation5).
Rift Valley fever (RVF) is a vector-borne zoonotic disease caused by the Rift Valley fever virus (RVFV), of the family Bunyaviridae, genus Phlebovirus (Citation6). Several RVF outbreaks have been reported in Africa and the Arabian Peninsula (Citation7). In animals, it causes high mortality in newborns and abortion in pregnant animals. In humans, it takes various forms ranging from ‘dengue-like’ illness with moderate fever, joint pains and headache, haemorrhagic fever, to encephalitis or ocular disease with significant death rates (Citation8).
Over 30 species of Aedes and Culex mosquitoes have been reported as vectors of RVF. Culex poicilipes, Culex quinquefasciatus, Culex univitattus, Mansonia africana, and Mansonia uniformis have been confirmed to transmit RVFV in Baringo County (Citation9). Adult Aedes mosquitoes are responsible for the transovarial maintenance of the virus in desiccated eggs during the dry season. Floods that follow heavy rainfall lead to hatching of infected Aedes mosquitoes that primarily transmit the virus to livestock. Although Culex and Mansonia mosquitoes do not transmit RVFV transovarially, they secondarily amplify the virus infection in livestock (Citation10). RVFV is transmitted either through direct transmission from an infected ruminant to healthy ruminants or humans or through bites of infected mosquito vectors. The latter is assumed to be the main infection mechanism during inter-epizootic periods (Citation11).
Climate change could play an important role in the outbreak of RVF since factors such as rainfall drive the emergence of the mosquito vectors. Apart from rainfall, other key climatic and environmental factors affecting vector emergence are temperature, vegetation assessed using normalized difference vegetation index (NDVI), soil type, and soil moisture. RVF predictions and risk maps have been developed based on changes in eastern equatorial Pacific Ocean and the western equatorial Indian Ocean sea surface temperatures, and changes in rainfall and satellite-derived NDVI data (Citation12). In East Africa, above normal rainfall associated with the warm phase of the El Niño/Southern Oscillation phenomenon has been associated with RVF outbreaks (Citation12, Citation13).
The geographic distribution of RVF vectors can be predicted based on the environmental conditions of sites where known occurrences of RVF have been observed. In scenarios where both species presence and absence data are available, general purpose statistical methods can be used to make the predictions (Citation14). In some cases, only species presence data are used (Citation15). These predictions make the basis of species distribution models (SDM) which produce prediction maps based on a combination of geographically referenced climatic and environmental data (Citation16, Citation17).
This study modelled the spatial distribution of four RVF vector species using entomological survey data and current and projected Bioclim variables in order to assess the effect of climate change on the spatial distribution RVF vectors.
Methodology
The study area
The study was carried out in the central parts of Baringo County, Kenya, between longitudes 35.596°E and 36.233°E, and latitudes 0.121°N and 0.855°N. The study area included parts of Baringo Central, Marigat, Tiaty, and Mogotio sub-counties (a). The study area was divided into four zones on the basis of hydrology, altitude, vegetation cover, soil types, and precipitation. The four zones from East to West were a low-altitude zone surrounding the permanent water bodies (the lowland zone, <1,000 m above sea level), a mid-altitude area (the midland zone, 1,000–1,500 m above sea level), the high-altitude areas (the highland zone, 1,500–2,300 m above sea level), and a riverine zone bordering the Kerio River (1,100–1,200 m above sea level) (b).
Fig. 1 (a) Map of the study area showing the location of Baringo County, (b) the sub-county administrative units within Baringo County with the study area shaded out green, and (c) the ecological zones within the study area, sampling sites and the 2006/2007 RVF outbreak points.
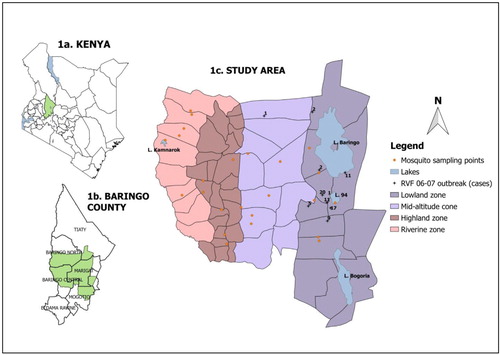
Permanent water bodies in the lowland zone are Lake Baringo, Lake 94, and Lake Bogoria (b). This area receives an annual rainfall of about 600 mm and has a slope of less than 4% with poorly drained soils, making it prone to seasonal flooding. The mid-altitude area is interspaced with dry riverbeds (lagas) that flow only after the heavy seasonal rains in the Tugen Hills. The slope here is between 20 and 30% and the main vegetation cover is Acacia and Commiphora bushes. The highland area comprises of the Tugen Hills. This area has very well drained soils that support indigenous forests as well as planted exotic forests which grow on the generally steep terrain that has a slope range of 30–40%. Rainfall ranges between 1,000 and 1,500 mm per annum. The riverine zone borders the Kerio River and has several oxbow lakes, the prominent one being Lake Kamnarok. This zone is prone to flooding because the elevation of slope is less than 6%.
Mosquito collection and identification
Mosquito samples were collected by larval and adult trapping. A longitudinal study design was employed where sampling was done monthly from 24 sites within the study area (six sites per zone) between June 2014 and February 2016 for larvae and between July 2015 and February 2016 for adult mosquitoes.
Sampling sites were determined by generating 100 random points per stratum using the random points tool in Quantum GIS. The random points were converted to a KML file and exported into Google Earth where only points close to water bodies and accessible by road were chosen.
The sampling sites were selected based on suitability of mosquito breeding, they were located near water bodies like lakes, springs, rivers, pan dams and irrigation canals. The larvae were collected from each site using 250ml standardized scoops. Adult mosquitoes were collected indoors from houses near the breeding sites using pyrethrum spray catches (PSC) (10 ml pyrethrin dissolved in 5 litres kerosene). Spraying was done in the morning between 06:00 and 08:00 h. White sheets were spread inside the house before spraying. Ten minutes after spraying, dead and immobilized mosquitoes were collected from the sheets. Consent was sought from the house owners before the spraying exercises commenced. Outdoor collections were done using CDC light traps set in the evenings prior to the indoor collection, between 18:00 and 06:00 h the next morning. The collected mosquitoes (adult and larvae) were brought back to the field laboratory for identification using dichotomous taxonomic keys (Citation18, Citation19).
Predictor variables and SDM
The variables used as predictors were both climatic and topographic. We used Bioclim variables (Citation20) available at http://www.worldclim.org at 30 arc seconds resolution. A table explaining the Bioclim variables has been added as Supplementary File. Bioclim variables are generated from an interpolation of average monthly climate data from stations around the world. To simulate the effect of climate change on the spatial distribution of RVF vectors, the study used current and future Bioclim variables. The current Bioclim variables were derived from climatic variables averaged between the years 1950 and 2000 while the future variables were averages of the projected climatic variables between the years 2041 and 2060. The future data sets used in the study were the National Oceanic and Atmospheric Administration's Geophysical Fluids Dynamics Laboratory Climate Model 3 (NOAA GFDL-CM3) under the RCP 4.5 scenario. These data sets had 19 Bioclim variables derived from temperature and rainfall. Other predictor variables used were soil types obtained from the FAO digital soil map of the world available for download from FAO and digital elevation map (DEM) downloaded from the Global Multi-resolution Terrain Elevation Data 2010 (GMTED 2010). The DEM was used to make new predictor variables, DEM slope and DEM aspect, using Quantum GIS 2.6. The DEM slope gives the steepness of the terrain while DEM aspect gives the direction that the slope faces. In total, there were 22 predictor variables available for this study.
Variable processing
These 22 predictor variables were processed using a suite of open source software included in OSGeolive 8.5 (Citation21). The processing steps included clipping raster data to the extent of the study site and re-sampling all the predictors to the same resolution and file types.
Maximum Entropy (MaxEnt) models were developed for four RVF vector species namely Culex quinquefasciatus, Culex univitattus, Mansonia africana, and Mansonia uniformis. These four species have been confirmed as vectors of RVF in the study area (Citation9). MaxEnt software v. 3.3.3 k was used to model the ecological niche of the four vector species over the study area using vector occurrence records and bioclimatic attributes to predict habitat suitability. The software was configured to the ‘Auto Features’, the logistic output format, and ASCII output file type. All models were run in cross validation mode with the number of replicates set to the number of occurrence records.
For each vector species, a model was run with all the 22 predictor variables. This gave an indication of each variable's contribution to the models. Two other models for each species were run using: 1) current Bioclim variables only and 2) future Bioclim variables. Current Bioclim variables gave an indication of the effect of prevailing climatic conditions on the distribution of vector species while the future Bioclim variables gave an indication of the possible effect of projected climatic conditions on the distribution of vector species.
The MaxEnt models were validated using the jackknife technique (Citation22) because the occurrence records for each species were few, making it impossible to partition the data for training and test purposes. For each species, a p-value corresponding to its jackknife validation was determined (Citation22) using the minimum training presence test omission and the minimum training presence area.
Species distribution maps from the three models were compared using the SigDiff function of SDMTools package in R to determine if there were significant changes in vector ranges between the models.
Results
RVF vector species
A total of 3,323 mosquito larvae and 8,247 adult mosquitoes were collected from the study area, of which 974 larvae and 890 adults belonged to four species that were previously confirmed as RVF vectors (Citation9). These are Culex quinquefasciatus (974 larvae), Culex univitattus (470 adults), Mansonia africana (71 adults), and Mansonia uniformis (349 adults).
Variable contribution to the MaxEnt models
The first model indicated that soil type contributed most to the predictions of Cx. univitattus, M. africana, and M. uniformis, while precipitation in the driest quarter (BIO 17) contributed most to the prediction of Cx. quinquefasciatus ().
Table 1 Variable contribution to the models showing the five most influential variables for each model
The second model indicated that precipitation seasonality (BIO 15) contributed the most to the prediction of Cx. univitattus, M. africana, and M. uniformis, while precipitation in the driest quarter (BIO 17) contributed most to the prediction of Cx. quinquefasciatus (Table 1).
The final model indicated that precipitation in the driest quarter (BIO 17) contributed the most to the prediction of Cx. quinquefasciatus, precipitation seasonality (BIO 15) contributed most to the prediction of Cx. univitattus and M. uniformis while isothermality (BIO 3) contributed the most to the prediction of M. africana (). M. africana was therefore the only species whose prediction was affected by the projected climate change; its most influential predictor variable changed from precipitation seasonality to isothermality.
Statistical evaluation of the models indicated that all the three models provided useful predictions, all of which were statistically significant at p<0.01 () and provided useful prediction maps for the vectors.
Table 2 The prediction of success rates and statistical significance of the MaxEnt Models
Species distribution maps
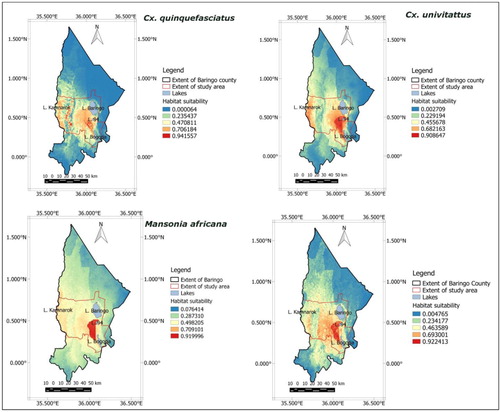
Prediction maps developed from the first model combining current climatic conditions and landscape variables indicated that the highest probability of occurrence for Cx. univitattus, M. africana, and M. uniformis was in the lowlands between Lake Baringo and Lake Bogoria. The riverine zone was also suitable for Cx. univitattus. Cx. quinquefasciatus occurred throughout the study area with the lowlands and riverine zones being moderately suitable and the highlands having few spots that are highly suitable for this species ().
Fig. 2 Prediction maps generated using current Bioclim variables and landscape variables indicating that soil type is the most influential variable. The highest habitat suitability for the RVF vectors is in the lowland area between Lake Baringo and Lake Bogoria.
Prediction maps based on the second model (current Bioclim variables only) indicated that the lowlands had the highest habitat suitability for the vectors (a).
Fig. 3 Prediction maps generated using (a) current and (b) projected (year 2050) Bioclim variables. Current Bioclim variables indicate that the most suitable habitat is in the lowland zone. Projections based on future climatic conditions show changes in range and suitability of habitats.
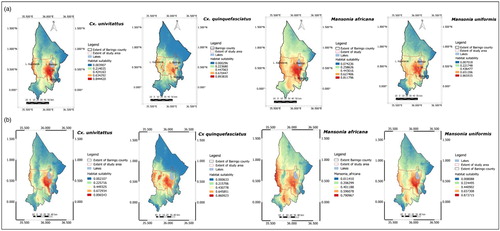
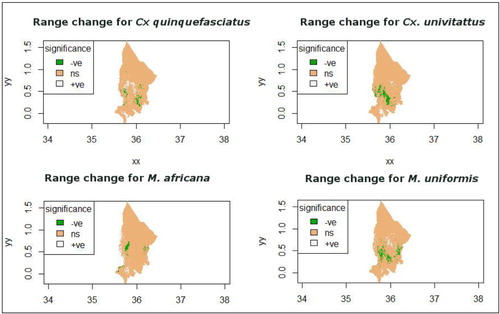
The third model based on projected climate for the year 2050 indicated an increase in habitat suitability for M. africana and a decrease in habitat suitability for Cx. quinquefasciatus (b). M. africana is expected to expand its realized niche to the riverine zone while Cx. quinquefasciatus’ realized niche is expected to shrink due to reduction in habitat suitability in the mid-altitude zone. The realized niche for Cx. univitattus and M. uniformis is expected to shrink, the reduction being in the highland and mid-altitude zones (b). The changes in the spatial extent of the suitable habitats for all the species is evidenced by the comparison between models two and three using the SigDiff function of SDM Tool package in R ().
Fig. 4 Changes in vector range as indicated by significant differences comparison between current and projected climatic conditions. Green colour indicates a reduction in habitat suitability, white indicates an increase in habitat suitability, and brown indicates no change in habitat suitability.
Discussion
Advances in spatial epidemiology have improved the understanding of the effects of climatic and environmental factors on the risk of human and animal health (Citation23). Spatial risk maps have been successfully developed for many diseases including Japanese encephalitis (Citation24), leishmaniasis (Citation25) West Nile virus (Citation26), RVF (Citation27, Citation28), and mosquito vectors in general (Citation29–Citation31). This study contributes to the growing success of using spatial distribution maps in the prediction of disease risk that may assist in prioritization of vector and disease control.
The predictive maps of the current study indicate that the lowland zone is the most suitable habitat for RVF vectors confirming the findings by other studies that showed this region as the epicentre of RVF outbreaks (Citation9, Citation32) and as being endemic due to the persistence of low level circulation of the virus during inter-epidemic periods (Citation33). The results also indicated that climate change can affect the spatial extent of the vector ranges. Vector range changes due to climate change has been reported in other studies, for example, for Aedes albopictus in north-eastern USA (Citation29), Lutzomyia flaviscutellata in South America (Citation34), and Anopheles arabiensis in Africa (Citation35).
The northwards shift in the range of Cx. quinquefasciatus () within the highland and the mid-altitude zones was in response to climate change. The most influential predictors for Cx. quinquefasciatus were rainfall derivatives: precipitation in the driest quarter and precipitation in the wettest quarter. Although precipitation in the driest quarter remained the most influential predictor, its influence reduced from 45.6 to 29.1%. The influence of precipitation in the coldest quarter increased from 4.6 to 19.9%. These changes are due to an increase in precipitation during driest quarter and a reduction in precipitation during the wettest quarter and they can affect the availability of breeding sites, thus determining the spatial distribution and emergence of vectors.
The species distribution map based on projected climate change indicates a shrink in the spatial range of Cx. univitattus and M. uniformis in the midland and highland zones (). The most influential predictor variable for these species is precipitation seasonality (BIO 15) which remained constant in the current and future climate projections. For M. uniformis, temperature in the driest quarter (BIO 9) was the second most influential factor. Its influence was negative in that a reduction in temperature during the driest quarter resulted in a reduction in the range size of M. uniformis.
Using current climatic conditions, precipitation seasonality (BIO 15) was the most influential predictor of M. africana occurrence. However, using projected climatic variables, isothermality (BIO 3) became the most influential predictor. A comparison between current and projected isothermality indicates a decrease from 86.04 to 82.42%. This decrease in isothermality means that there is more variation between monthly and annual temperature ranges which affects M. africana development.
The MaxEnt models developed in this study reported difference in the most influential predictor variables for the mosquito species. Such variations have been reported by other studies that used MaxEnt (Citation36, Citation37). This is because although the mosquito species share similar habitats, their ecological requirements may show significant variation in terms of water quality (Citation38, Citation39) and vegetation type (Citation40). Other studies have also indicated that temperature and rainfall derivatives are the most influential predictors of mosquito distribution (Citation24, Citation27) (Citation41).
The projected increase in precipitation seasonality in the study area can lead to flooding in poorly drained soils in the study area, leading to the emergence of RVF vectors and amplification of the RVFV which is present in livestock at low levels.
Although RVF cases were only reported in the lowland area during the previous outbreak in 2006/2007, risk maps based on the future climatic conditions indicate a shift in the range of two RVF vectors into the riverine zone and the northern parts of highland and mid-altitude zones. This shift increases the risk of RVF infection to human and animal populations that were previously under no threat. An outbreak of RVF in these regions would expose approximately 200,000 people (Citation42) to infection. This finding is important for planning intervention measures by health and veterinary personnel. RVF intervention strategies that previously focused in the lowlands should be expanded to the riverine and northern parts of the highland and mid-altitude zones.
Although very low suitability is predicted for the northern part of Baringo County, no sampling was conducted in this region and there may be a need to conduct more entomological surveillance to validate our models.
Conclusion
Climate change can have an impact on the spatial distribution of RVF vectors in Baringo County by expanding the range of their realized niche, thus putting more populations at risk to disease. The use of spatial epidemiology techniques can help in understanding the forecasting the risk of RVFV infection associated with climate change. These findings can be used by policy makers, government agencies, and medical and veterinary personnel in prevention and management of climate-sensitive vector-borne disease outbreaks.
Conflict of interest and funding
The authors declare no conflict of interest. This research was funded by WHO/TDR-IDRC initiative on ‘Population Health Vulnerabilities to Vector-Borne Diseases: Increasing Resilience under Climate Change Conditions in Africa’, Project ID: B20278. The funders had no role in study design, data collection and analysis, decision to publish, or preparation of the publication.
Acknowledgements
The authors are grateful to the following individuals and institutions: the project field staff for their role in data collection, Ministry of Health and Department of Veterinary Services in Baringo County for their support during this study, and the local community in Baringo for allowing us to undertake the vector sampling studies in their houses.
References
- IPCC. Climate change 2007: synthesis report. Contribution of Working Groups I, II and III to the Fourth Assessment Report of the Intergovernmental Panel on Climate Cchange. 2007; Geneva, Switzerland: IPCC. Core Writing Team, Pachauri RK, Reisinger A, eds.
- Mboera LE, Mayala BK, Kweka EJ, Mazigo HD. Impact of climate change on human health and health systems in Tanzania: a review. Tanzan J Health Res. 2011; 13(Suppl 1): 407–26.
- IPCC. Change 2014: synthesis report. Contribution of Working Groups I, II and III to the Fifth Assessment Report of the Intergovernmental Panel on Climate Change. 2014; Geneva, Switzerland: IPCC.
- Githeko AK, Lindsay SW, Confalonieri UE, Patz JA. Climate change and vector-borne diseases: a regional analysis. Bull World Health Organ. 2000; 78: 1136–47.
- Patz JA, Campbell-Lendrum D, Holloway T, Foley JA. Impact of regional climate change on human health. Nature. 2005; 438: 310–17.
- Pepin M, Bouloy M, Bird BH, Kemp A, Paweska J. Rift Valley fever virus (Bunyaviridae: Phlebovirus): an update on pathogenesis, molecular epidemiology, vectors, diagnostics and prevention. Vet Res. 2010; 41: 61.
- Nanyingi MO, Munyua P, Kiama SG, Muchemi GM, Thumbi SM, Bitek AO, etal. A systematic review of Rift Valley fever epidemiology 1931–2014. Infect Ecol Epidemiol. 2015; 5: 28024. doi: http://dx.doi.org/10.3402/iee.v5.28024.
- Gerdes GH. Rift Valley fever. Vet Clin North Am Food Anim Pract. 2002; 18: 549–55.
- Sang R, Kioko E, Lutomiah J, Warigia M, Ochieng C, O'Guinn M, etal. Rift Valley fever virus epidemic in Kenya, 2006/2007: the entomologic investigations. Am J Trop Med Hyg. 2010; 83(Suppl 2): 28–37.
- Logan T, Linthicum K, Davies F, Binepal Y, Roberts C. Isolation of Rift Valley fever virus from mosquitoes (Diptera: Culicidae) collected during an outbreak in domestic animals in Kenya. J Med Entomol. 1991; 28: 293–5.
- Anyamba A, Linthicum KJ, Small J, Britch SC, Pak E, de La Rocque S, etal. Prediction, assessment of the Rift Valley fever activity in East and Southern Africa 2006–2008 and possible vector control strategies. Am J Trop Med Hyg. 2010; 83(Suppl 2): 43–51.
- Anyamba A, Chretien JP, Small J, Tucker CJ, Formenty PB, Richardson JH, etal. Prediction of a Rift Valley fever outbreak. Proc Natl Acad Sci U S A. 2009; 106: 955–9.
- Anyamba A, Linthicum KJ, Tucker CJ. Climate-disease connections: rift valley fever in Kenya. Cad Saude Publica. 2001; 17 Suppl: 133–40.
- Guisan A, Zimmermann NE. Predictive habitat distribution models in ecology. Ecol Model. 2000; 135: 147–86.
- Graham CH, Ferrier S, Huettman F, Moritz C, Peterson AT. New developments in museum-based informatics and applications in biodiversity analysis. Trends Ecol Evol. 2004; 19: 497–503.
- Elith J, Graham CH, Anderson RP, Dudi′k M, Ferrier S, Guisan A, etal. Novel methods improve prediction of species’ distributions from occurrence data. Ecography. 2006; 29: 129–51.
- Phillips SJ, Anderson RP, Schapire RE. Maximum entropy modeling of species geographic distributions. Ecol Model. 2006; 190: 231–59.
- Edwards FW. Mosquitoes of the Ethiopian region. 1941; London: British Museum (Natural History). Vol. 3. Culicine adults and pupae viii, 499p.
- Hopkins GHE. Mosquitoes of the Ethiopian region. Larval bionomics of mosquitoes and taxonomy of culicine larvae. 1936; London: British Museum (Natural History). 250p. Vol. 1.
- Hijmans RJ, Cameron SE, Parra JL, Jones PG, Jarvis A. Very high resolution interpolated climate surfaces for global land areas. Int J Climatol. 2005; 25: 1965–78.
- Amatulli G, Casalegno S, D'Annunzio R, Haapanen R, Kempeneers P, Lindquist E, etal. Teaching spatio-temporal analysis and efficient data processing in open source environment. 2014; Espoo, Finland: The 3rd Open Source Geospatial Research and Education Symposium.
- Pearson RG, Raxworthy CJ, Nakamura M, Townsend Peterson A. Predicting species distributions from small numbers of occurrence records: a test case using cryptic geckos in Madagascar. J Biogeogr. 2007; 34: 102–17.
- Bergquist R, Rinaldi L. Health research based on geospatial tools: a timely approach in a changing environment. J Helminthol. 2010; 84: 1–11.
- Masuoka P, Klein TA, Kim H-C, Claborn DM, Achee N, Andre R, etal. Modeling the distribution of Culex tritaeniorhynchus to predict Japanese encephalitis distribution in the Republic of Korea. Geospat Health. 2010; 5: 45–57.
- Salomon OD, Quintana MG, Mastrangelo AV, Fernandez MS. Leishmaniasis and climate change-case study: Argentina. J Trop Med. 2012; 2012: 601242.
- Larson SR, Degroot JP, Bartholomay LC, Sugumaran R. Ecological niche modeling of potential West Nile virus vector mosquito species in Iowa. J Insect Sci. 2010; 10: 110.
- Sallam MF, Al Ahmed AM, Abdel-Dayem MS, Abdullah MA. Ecological niche modeling and land cover risk areas for Rift Valley fever vector, Culex tritaeniorhynchus giles in Jazan, Saudi Arabia. PLoS One. 2013; 8: e65786.
- Mweya CN, Kimera SI, Kija JB, Mboera LE. Predicting distribution of Aedes aegypti and Culex pipiens complex, potential vectors of Rift Valley fever virus in relation to disease epidemics in East Africa. Infect Ecol Epidemiol. 2013; 3: 21748. doi: http://dx.doi.org/10.3402/iee.v3.21748.
- Rochlin I, Ninivaggi DV, Hutchinson ML, Farajollahi A. Climate change and range expansion of the Asian tiger mosquito (Aedes albopictus) in Northeastern USA: implications for public health practitioners. PLoS One. 2013; 8: e60874.
- Laporta GZ, Ribeiro MC, Ramos DG, Sallum MAM. Spatial distribution of arboviral mosquito vectors (Diptera, Culicidae) in Vale do Ribeira in the South-eastern Brazilian Atlantic Forest. Cad. Saude Publica. 2012; 28: 229–38.
- Arboleda S, Jaramillo ON, Peterson AT. Spatial and temporal dynamics of Aedes aegypti larval sites in Bello, Colombia. J Vector Ecol. 2012; 37: 37–48.
- Munyua P, Murithi RM, Wainwright S, Githinji J, Hightower A, Mutonga D, etal. Rift Valley fever outbreak in livestock in Kenya, 2006–2007. Am J Trop Med Hyg. 2010; 83(Suppl 2): 58–64.
- Tigoi C, Lwande O, Orindi B, Irura Z, Ongus J, Sang R. Seroepidemiology of selected arboviruses in febrile patients visiting selected health facilities in the lake/river basin areas of Lake Baringo, Lake Naivasha, and Tana River, Kenya. Vector Borne Zoonotic Dis. 2015; 15: 124–32.
- Carvalho BM, Rangel EF, Ready PD, Vale MM. Ecological niche modelling predicts southward expansion of Lutzomyia (Nyssomyia) flaviscutellata (Diptera: Psychodidae: Phlebotominae), Vector of Leishmania (Leishmania) amazonensis in South America, under Climate Change. PLoS One. 2015; 10: e0143282.
- Drake JM, Beier JC. Ecological niche and potential distribution of Anopheles arabiensis in Africa in 2050. Malar J. 2014; 13: 213.
- Sallam MF, Xue RD, Pereira RM, Koehler PG. Ecological niche modeling of mosquito vectors of West Nile virus in St. John's County, Florida, USA. Parasit Vectors. 2016; 9: 371.
- Mughini-Gras L, Mulatti P, Severini F, Boccolini D, Romi R, Bongiorno G, etal. Ecological niche modelling of potential West Nile virus vector mosquito species and their geographical association with equine epizootics in Italy. EcoHealth. 2014; 11: 120–32.
- Noori N, Lockaby BG, Kalin L. Larval development of Culex quinquefasciatus in water with low to moderate. J Vector Ecol. 2015; 40: 208–20.
- Sheela AM, Sarun S, Justus J, Vineetha P, Sheeja RV. Assessment of changes of vector borne diseases with wetland characteristics using multivariate analysis. Environ Geochem Health. 2015; 37: 391–410.
- Arum SO, Weldon CW, Orindi B, Tigoi C, Musili F, Landmann T, etal. Plant resting site preferences and parity rates among the vectors of Rift Valley Fever in northeastern Kenya. Parasit Vectors. 2016; 9: 310.
- Miller RH, Masuoka P, Klein TA, Kim HC, Somer T, Grieco J. Ecological niche modeling to estimate the distribution of Japanese encephalitis virus in Asia. PLoS Negl Trop Dis. 2012; 6: e1678.
- KNBS. The 2009 Kenya population and housing census. 2010; Nairobi: KNBS.