
Abstract
Small non-coding RNAs have been significantly recognized as the key modulators in many biological processes, and are emerging as promising biomarkers for several diseases. These RNA species are transcribed in cells and can be packaged in extracellular vesicles, which are small vesicles released from many biotypes, and are involved in intercellular communication. Currently, the advent of next-generation sequencing (NGS) technology for high-throughput profiling has further advanced the biological insights of non-coding RNA on a genome-wide scale and has become the preferred approach for the discovery and quantification of non-coding RNA species. Despite the routine practice of NGS, the processing of large data sets poses difficulty for analysis before conducting downstream experiments. Often, the current analysis tools are designed for specific RNA species, such as microRNA, and are limited in flexibility for modifying parameters for optimization. An analysis tool that allows for maximum control of different software is essential for drawing concrete conclusions for differentially expressed transcripts. Here, we developed a one-touch integrated small RNA analysis pipeline (iSRAP) research tool that is composed of widely used tools for rapid profiling of small RNAs. The performance test of iSRAP using publicly and in-house available data sets shows its ability of comprehensive profiling of small RNAs of various classes, and analysis of differentially expressed small RNAs. iSRAP offers comprehensive analysis of small RNA sequencing data that leverage informed decisions on the downstream analyses of small RNA studies, including extracellular vesicles such as exosomes.
To access the supplementary material to this article, please see Supplementary files under ‘Article Tools’.
Small RNAs (<250 nucleotides in length) are a class of non-coding RNAs that modulate translation of target RNAs through RNA–RNA interactions in normal physiological conditions and in the disease state (Citation1–Citation3). One type of small RNAs is the microRNA (miRNA), which can mediate either translational repression or mRNA degradation by binding to the 3′ UTRs of target sites (Citation4, Citation5). Potentially, a single miRNA may target many protein-coding genes, resulting in the perturbation of different biological processes (Citation6, Citation7). Recent studies have extensively documented that these miRNAs and other small RNAs can be packaged in exosomes, which are small extracellular vesicles released from many biotypes, contributing to pathogenesis during disease state (Citation8, Citation9). The role of exosomes as potential carriers of small RNAs during the disease progression includes spreading of cancer (Citation10–Citation12) and neurodegenerative diseases (Citation13–Citation15).
The advances in small RNA profiling using next-generation sequencing (NGS) technology have enabled the interrogation of genome-wide expression at a higher throughput and lower cost (Citation16–Citation18). To date, there are several NGS platforms and protocols for small RNA sequencing, including Illumina HiSeq systems and Life Technologies Ion Torrent/Proton sequencing (Citation19). Despite the different sequencing platforms, the analysis of generated data follows a common analytical workflow for small RNA sequencing that includes 3′-adapter trimming, sequence alignment, read counting, normalization, expression profiling and other downstream analyses to address relevant biological questions (Citation20). To perform this procedure, several open-source tools have been established, such as mirTools (Citation21, Citation22), miRNAkey (Citation23), miRDeep (Citation24, Citation25), DSAP (Citation26), E-miR (Citation27), miRanalyzer (Citation28), MIReNA (Citation29), miRExpress (Citation30), miRspring (Citation31), iMir (Citation32) and CAP-miRSeq (Citation33). These tools differ in the methods and algorithms used for various processing steps such as adapter trimming, sequence alignment and normalization of expression level (Supplementary Table I). Most of them have high performance with respect to accuracy, sensitivity and visualization for conducting expression analysis. However, only some tools provide sequence quality assessment and differential expression analysis for small RNAs, while the majority of these tools are for miRNA profiling. In addition, optimized parameters employed in the pipeline with various considerations may not be suitable for data analysis of all small RNA studies, particularly to experiments with a wide variety of conditions including drug exposure, exosome-derived nucleic acids and specific genetic alterations, such as gene deletions/insertions and siRNA knockdown (Citation34, Citation35). Thus, existing pipelines that do not allow configuration of argument parameters may not be appropriate for a complex study design (Citation36). It is difficult to reach a coherent consensus on how the software parameters should be applied for a specific study and the chosen methodology for subsequent analyses due to the dynamic nature of biological studies. Therefore, analysis tools that include the convenient options of customization will be desirable for analysing different types of small RNA data.
Of these analysis methods, the standalone tools are becoming more appealing due to their flexibility and reliability for data processing and analysis (Citation37). Advantages include having no limit in the argument options provided by the software and the choice of selecting appropriate small RNA references from respective species. As compared to graphical user interface (GUI) or web browser tools, the standalone tools have no issues of uploading hundreds of samples and encountering server down or the missing web-link. These attributes significantly accelerate the analysis of sequencing projects with numerous samples and complex study designs.
The initial processing step for expression profiling is mainly the sequence alignment and normalization of small RNA counts (Citation38, Citation39). Although there are different aligners for small RNA, the choice of alignment software depends on the compatibility of sequencing instrument as well as the balance of speed and accuracy because increased alignment speed will affect the alignment quality (Citation40). Therefore, several sequencing companies provide their specific aligner tool that can promptly and reliably perform sequence alignment. For instance, the Ion Torrent platform from Life Technologies incorporates TMAP aligner into the Torrent Suite Software for performing alignment after base calling, eliminating the inconvenience of adapter trimming and sequence alignment using third-party tools (Citation41, Citation42). After sequence alignment, the recovered small RNA counts need to be normalized to remove variations in the data that are caused by experimental procedure such as RNA extraction, sequence library construction and sequencing (Citation43, Citation44). Several normalization methods for small RNA data have been proposed, including total count-based or quartile-based scaling and linear or non-linear regression (Citation45). These normalization methods are adopted from mRNA or whole transcriptome analysis (Citation46, Citation47). The selection of appropriate normalization method for small RNA data has led to several studies in evaluating the effect of different normalization methods (Citation48, Citation49). Despite the effort of comparing the existing methods, common conclusions have not been drawn from these studies. The evaluation results from Garmire and Subramaniam recommended the use of quantile and Lowess normalization methods for small RNA-seq data, in particular for miRNA, and showed that the poor performance of trimmed mean of M values (TMM) was due to the abnormal results from the test of differential expression of miRNA (Citation50). In contrast, with the correct implementation of TMM for small RNA data, Zhou et al. demonstrated the potential of TMM method in improving the total-depth normalization by re-analysing the data from the aforementioned study (Citation51). In addition, Dillies et al. had demonstrated a comprehensive evaluation of normalization methods and had suggested the use of DESeq and TMM for RNA sequencing data (Citation48). Thereafter, testing different normalization methods for small RNA-seq analysis can facilitate the selection of an optimal method for expression profiling in various biological data sets.
Since sequence alignment and expression normalization will affect the accurate quantification of small RNA abundance, there is a demand for tools to provide flexible and practical usage for data analysis. Here, we developed an integrated Small RNA Analysis Pipeline (iSRAP) for comprehensive analysis of small RNA sequencing data derived from exosomes and the disease state. iSRAP is presented with a one-step command which maximises the performance of integrated tools automatically, providing visualization and real-time evaluation of analysis run for transcriptomic data. In this study, data sets retrieved from public databases were used to demonstrate the pipeline's usage in quantification and discovery of a wide spectrum of small RNAs, including but not limited to miRNA, small nucleolar RNA (snoRNA), small nuclear RNA (snRNA), piwi-interacting RNA (piRNA) and transfer RNA (tRNA).
Materials and methods
Test data sets
Three data sets were used to demonstrate the capability of iSRAP and the descriptions of each data set were detailed in the following.
Data set 1: miRNA sequences from the prefrontal cortex Brodmann Area 9 of the frozen brain tissue (Citation52) of 12 Huntington's disease (HD) patients and 9 healthy individuals (Sequence Read Archive [SRA]; accession no. ERP004592). Samples were sequenced using the Illumina HiSeq 2000 sequencing platform.
Data set 2: Mouse GT1-7 neuronal cell-derived exosomes. These neuronal cell and exosome data sets were previously generated in-house to investigate the different exosome isolation methods for small RNA profiling. Exosomes were isolated from GT1-7 neuronal cell line using differential ultracentrifugation (UC), and OptiPrep™ (OP) velocity gradient UC where exosomes were predominantly found in Fractions 8 and 9 (Citation53). Small RNAs were extracted from exosomes prepared by UC and Fractions 8 and 9 of OP gradient, as well as GT1-7 neuronal cells for comparison. Samples were sequenced using Ion Torrent Personal Genome Machine at 200 base sequencing. The sequencing data consisted of 5 replicates of OP exosomes and 3 replicates of respective UC exosomes and cells. The full details of the experimental work were described previously. Sequence data can be downloaded from European Nucleotide Archive database (accession no. PRJEB9472).
Data set 3: Experimental procedures for small RNA sequences from human plasma-derived exosomes were previously reported (Citation54). The study consisted of 14 size-selected sequencing libraries from 7 individuals (SRA accession no. SRP034590), and these libraries were sequenced using an Illumina HiSeq 2000 sequencer (Citation55).
Reference databases and annotation
Several reference databases were used to identify miRNA and other small RNAs. Genomic coordinates were intersected between query and known transcripts in miRBase database (Citation56). Subsequently, additional intersection to the other classes of small RNAs was also performed with respect to their specific databases, including Genomic tRNA database (Citation57), piRNA Bank (Citation58) and Ensembl (i.e. snoRNA, snRNA and rRNA) (Citation59).
Implementation of iSRAP pipeline
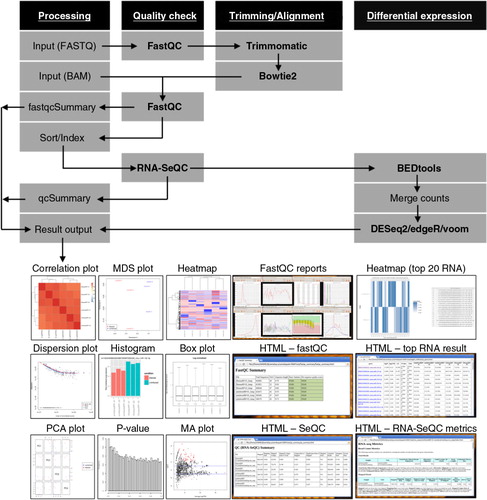
The outline of the pipeline is illustrated in a schematic diagram (). This is a pipeline implemented with Ruffus, a lightweight computation pipeline management library for Python, which allows for multistage processing of computational tasks (Citation60). Each tool in the pipeline is executed as defined in the configuration file.
Fig. 1. A schematic diagram of iSRAP workflow. The analysis steps involve pre-processing (sequence trimming and alignment), alignment and data quality check, and differential expression profiling. Input files are either BAM alignment or raw FASTQ sequencing data. iSRAP will determine the analysis steps required for raw sequence or alignment files. Different types of tabular and graphical outputs are generated automatically in iSRAP. The solid arrow represents the flow of the analysis. The computational tasks and analysis tools are, respectively, underlined and bolded.
Results
Workflow of iSRAP
iSRAP provides automated execution of a range of tools for small RNA expression analysis as shown in . The main components are listed in Table . For full details of the pipeline, refer to Supplementary file for explanations and key parameters of each tool.
Table I. Description of tasks in iSRAP
Key features of iSRAP
The followings are the main features of iSRAP.
Sample management: The flexibility of input files and data management is important for analysing different types of studies. The text file is provided to specify the processing steps and file locations. The pipeline recognized raw FASTQ or BAM alignment files, in which multiple data sets are processed in parallel for each computational task.
Result output management: All results are saved in each respective folder based on the computational task. Results are saved in PDF and HTML files, which allow portability of analysing data between different operating systems (e.g. MAC, Windows, Linux, iOS and Android), facilitating convenient collaboration and sharing of data. In addition, the statistically significant miRNAs are tabulated in HTML format, providing links to miRBase (Citation56) for ease of literature-based analysis.
Flexible specifications: A configuration YAML file is provided to allow different degrees of analysis options to be modified, allowing optimization of small RNA profiling in different data sets. The common parameters used in the tools such as BEDTools (Citation66), Bowtie2 (Citation62) and Trimmomatic (Citation61) are provided in the configuration for modifications. The options include the number of allowed mismatches, nucleotide length for sequence alignment, threshold of overlapping reads and memory usage. The computational task can be selected based on the specific run analysis.
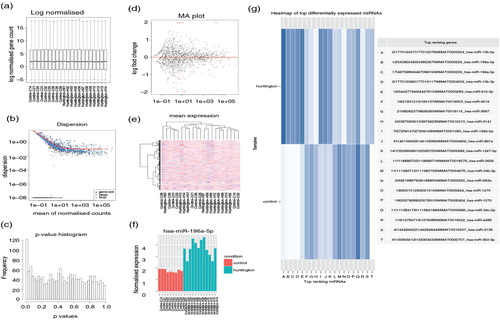
Publication-ready graphics: Outputs are presented in 2 basic types of visualization, either in tabular- or graphical-based manner. The results are presented in several figures (a–f) that include but not limited to box plot, variance/dispersion plot, p-value distribution graph, MA plot, heat map and histogram. Digital information, such as raw or normalized transcript counts and log expression values, from each sample is displayed in table format.
Fig. 2. Illustration of result outputs from iSRAP using Huntington's disease data set. (a) Boxplot depicting the read counts normalization. The y-axis shows the normalized log2 counts per million values of miRNA in each sample. (b) Dispersion plot estimates the biological variation showing the gene-wise estimates (black), the fitted values (red) and the final maximum posteriori estimates (blue). (c) The p-value distribution plot shows the frequency of differentially expressed miRNA against the p-values obtained from DESeq2 analysis. The observed distribution shows a peak at near 0. (d) The MA plot shows the log2 fold-changes between disease and healthy individuals over the mean of normalized counts. Each dot represents individual miRNA. The red line at y=0 indicates no expression changes between the conditions. The red dots on the plot represent miRNAs that have significant expression changes. (e) Heatmap of unsupervised hierarchical clustering of miRNA profiles across all samples. The degree of low to high miRNA expression is represented from blue to red. (f) Bar plot showing one of the top differentially expressed miRNAs (miR-196a-5p). The pink and green bars indicate the respective control and disease samples. (g) Heat map showing the 20 most significant differentially expression miRNAs between disease and healthy individuals. The ranking table details the chromosome, start and end of chromosome, and followed by the miRBase accession number of each miRNA. The shade of blue indicates degree of down- and up-regulated miRNAs in the disease state.
Differential expression analysis of Huntington's disease patients from data set 1
To examine the presence of altered miRNA expression in Hoss et al. (Citation52) study (data set 1), the sequencing files were subjected into iSRAP for data analysis. A wide variety of result output was obtained and stored in the directories specified in the configuration file. The result output included normalization plot, transcript dispersion, p-value histogram, MA plot, bar plot and heatmap.
Prior to differential expression analysis, the sequence quality (Supplementary Tables II and III) of each sample was checked to ensure that sequence reads were well trimmed and aligned. From a–e, the biological variation in each condition was observed and the normalized read counts were subjected to differential expression testing using DESeq function, displaying the presence of expression changes of miRNAs. Similar to the results published by Hoss et al., one of the most significant differentially expressed miRNA, miR-196a-5p, was expressed consistently higher in HD patients according to the fold change value of 4.57 (adjusted p-value=2.952E-16; f). Additionally, in concordance with the Hoss et al. published results (Citation52), the heat map (g) highlighted the reported 5 miRNAs (miR-10b-5p, miR-196a-5p, miR-196b-5p, miR-615-3p and miR-1247-5p) that were significantly up-regulated (adjusted p-value<0.001; log2 fold-change=1.03-4.57) in HD. The tabulated top differentially expressed miRNAs in the HTML file ( Supplementary Table IV) provided links to miRBase for downstream analysis of these miRNAs, and the table was sorted by p-value. As iSRAP automatically extends the analysis of small RNA-seq data beyond miRNAs, the summary of differential expression analysis on other species of small RNAs was generated. There were several small RNAs that were highly expressed in disease; however, none of them were significantly differentially expressed in healthy individuals with adjusted p-value threshold 0.05 (Supplementary Fig. 1).
Profiling of various small RNA species from exosomal data sets 2 and 3
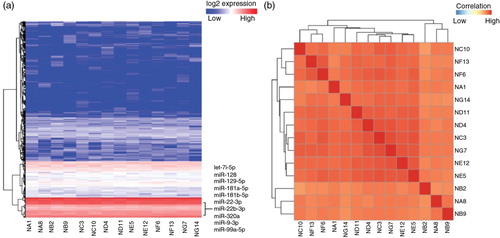
To demonstrate small RNA profiling, iSRAP identified and quantified a comprehensive range of small RNAs from both data set 2 and data set 3. The results from neuronal cell-derived exosomes (data set 2) showed a comprehensive panel of small RNAs that was detected in the exosome samples (Supplementary Table V), including miRNA (0.64±0.33%), piRNA (0.63±0.26%), snoRNA (0.043±0.0096%), snRNA (0.11±0.019%) and rRNA (0.34±0.14%). Approximately 42% of sequences from each of the exosome library were composed of fragments of various tRNA species. The heatmap of miRNA (a) and other small RNAs (b) expression is distinct between cells and exosome samples. Similar analysis was performed for the data set of plasma-derived exosomes (data set 3). The fraction of small RNA counts (Supplementary Table VI) to the total mapped reads comprised miRNA (76.59±7.26%), piRNA (19.98±6.22%), rRNA (1.63±0.99%), snoRNA (0.02±0.01%), snRNA (1.25±0.36%) and tRNA (0.53±0.28%). The 10 most abundant miRNAs (a, Supplementary Table VII) were previously reported to have functional roles in target cells (Citation54). To assess the variation of small RNA contents that may be produced by potential biological variability or experimental procedures, a correlation coefficient analysis using normalized reads from exosome data sets was performed in iSRAP. The correlation plot illustrated that the overall reproducibility was high in both cell-derived (c) and plasma-derived (b) exosome samples, with an average Pearson correlation coefficient r of 0.90 (Supplementary Tables VIII and IX). In contrast, the correlation coefficient r was much lower at ~0.56 between neuronal-derived exosome samples and cell-line samples. Taken together, the results showed that the small RNA profiles were unique in exosomes, as compared to the parental cells that released the exosomes.
Fig. 3. Heatmap of unsupervised hierarchical clustering and correlation matrix of neuronal-derived exosome and GT1-7 neuronal cell samples. Heatmap of expression level of microRNAs (a) and other small RNAs (b), including transfer RNA, piwi-interacting RNA, ribosomal RNA, small nucleolar RNA and small nuclear RNA. (c) Distance mapping of small RNA expression using Euclidean distance metric of OptiPrep™ exosomes, ultracentrifugation exosomes and GT1-7 neuronal cells. Exosomes prepared by both methods are closely related to each other, but distantly related to neuronal cells. Abbreviations: “GTcell” denotes GT1-7 mouse neuronal cell line; “OPexo” refers to exosomes isolated from OptiPrep™ velocity gradient ultracentrifugation; “UCexo” refers to exosomes isolated from differential ultracentrifugation; “RP” denotes sample replicate.
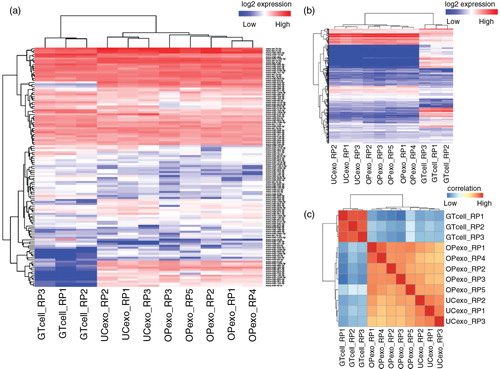
Fig. 4. Heatmap of unsupervised hierarchical clustering and correlation matrix of human plasma-derived exosomes. (a) Heatmap of small RNA profiles including microRNA, transfer RNA, piwi-interacting RNA, ribosomal RNA, small nucleolar RNA and small nuclear RNA. (b) Distance mapping of small RNA expression using Euclidean distance metric of all replicates from 7 human individuals, generating a total size of 14 samples.
Discussion
NGS technologies have increasingly been recognized as the standard for global transcriptome analysis, owing to their attributes in identification of all RNAs without any prior knowledge of transcripts to be quantified (Citation71). The routine practice of NGS has resulted in the generation of large volumes of data, which makes web-based tools or applications that require manual processing of samples impractical. Here, iSRAP is described as a standalone package that compiles essential tools for the identification, quantification and differential expression analysis of small RNAs with one-touch process by a single command.
Although iSRAP has many similar analysis features with existing small RNA analysis tools either web-based or standalone, it augments the flexibility and broadens the spectrum of analysis. As the configuration document specifies the tools to run and the parameters for each tool, users have full control on the choice of tools and the way to run the tools. iSRAP is capable of not only profiling all known small RNAs of any classes but also carrying out the differential expression analysis, which is not offered by any existing small RNA analysis tools to our best knowledge. Other important benefits of iSRAP are as follows: (a) Better time management: The automated feature of iSRAP will allow researchers to focus on interpretation of biological meaning. There are no requirements to re-format the raw sequencing data as standard FASTQ and BAM format are accepted for data processing. The configuration file provides concise information for running the pipeline, allowing the recording of analysis details for future downstream work. The manual preparations of file formats are eliminated by a single command. (b) High-throughput capability: Handling of numerous sequencing samples for data analysis is executed by parallel processing in iSRAP. Unlike web-based or GUI-based tools, there are no limitations on the sample file size or facing the problem of uploading time. (c) Reliability: iSRAP can be downloaded into the local computer, eliminating the issue of downtime due to software upgrade or maintenance. The pipeline will thus provide a practical environment for researchers to learn more about the data and fulfil the requirements for analysing large sequencing data independently. (d) Infographics: Visual representations of data allow complex digital information to be presented quickly and clearly, so that biologists can explore and interpret biological relationships. The result documents are portable and thus allow the independent use of web servers and convenience of analysing data between different operating systems (e.g. MAC, Windows, Linux, iOS and Android).
Furthermore, the flexibility of iSRAP allows researchers to choose any tool that is compatible with their system for data analysis. This is one of the key advantages of iSRAP over Galaxy, a cloud-based tool that provides simple interfaces for different NGS data analysis (Citation72, Citation73). Although Galaxy and iSRAP have similar analysis features, the main drawback of Galaxy is the limitation of tools available in Galaxy instance. This flexibility greatly extends differential expression analysis within iSRAP, including tools for miRNA target prediction or target identification through integrative analysis with differential (protein-coding) gene expression analysis results. The flexibility of iSRAP allows not only a selection of analysis tools but also fine-tuning the settings for normalization. The normalization is important for differential expression analysis, because the performance of normalization methods can be dependent on the nature of the data sets. As most tools are established for general purpose of small RNA profiling, they may not be suitable for complex study design, particularly on exosome data sets. The potential issue posed by some tools is that they use library sizes calculated from mapped reads to specific RNA biotype (e.g. miRNA, piRNA or snRNA) as a normalization factor, which in some experimental designs is not appropriate. In the case of exosome study, exosome production and content may be influenced by their parental cells due to environment conditions (e.g. hypoxia) or by the fluid of origins (Citation74, Citation75). When RNA extraction was performed from low production of exosomes, normalization to the total genomic alignment library size was used to improve the overall expression, as shown when the workflow is applied to the current exosome data sets 2 and 3. Similarly, the concept is also applied in the published study of Dicer knock-down in breast cancer cell line, which resulted in the reduction of miRNA (Citation33). When normalization was performed using the low number of miRNA library size, the subset of differentially expressed miRNAs were not accurately defined due to the globally reduced miRNA library read counts. To obscure the true differences, the whole genome alignment library size was used for normalization. Therefore, iSRAP considers this biological nature of experimental design and provides the convenient options for selecting the library size for normalization.
In summary, iSRAP provides a flexible and integrated environment for small RNA expression analysis using a single command. The flexible and powerful features of iSRAP enable a comprehensive analysis of small RNAs, which covers from quality assessment of input data to differential expression analysis and visualization of results with the ease of use. iSRAP can potentially serve as a platform for rapid analysis of transcriptomic data so that a better-informed decision can be made on the downstream analyses.
Availability
The iSRAP pipeline is freely available for use at www.israp.sourceforge.net/ according to the GNU Public License. The step-by-step manual and technical documents are provided through the web site, and the source code for iSRAP is included in Supplementary file 1.
Conflict of interest and funding
The authors have not received any funding or benefits from industry or elsewhere to conduct this study.
Supplementary Figure 1
Download PDF (15.2 KB)Supplementary Figure 2
Download PDF (422.5 KB)Supplementary Table 1
Download PDF (53.3 KB)Supplementary Table 2
Download HTML (18.8 KB)Supplementary Table 3
Download HTML (18.8 KB)Supplementary Table 4
Download HTML (18.8 KB)Supplementary Table 5
Download MS Excel (278.7 KB)Supplementary Table 6
Download MS Excel (1.6 MB)Supplementary Table 7
Download PDF (132.5 KB)Supplementary Table 8
Download PDF (77.4 KB)Supplementary Table 9
Download PDF (87.5 KB)Supplementary Data
Download Zip (18.8 KB)Acknowledgements
We thank the Life Sciences Computation Centre of Victorian Life Sciences Computation Initiative, an initiative of the Victorian Government, Australia, hosted at the University of Melbourne, for high-performance computing system and resources. This work was supported by the Australian Research Council (FT100100560 to AFH) and the National Health and Medical Research Council (628946 to AFH). CQ was supported by Melbourne International Research Scholarship.
Notes
To access the supplementary material to this article, please see Supplementary files under ‘Article Tools’.
Related Research Data
References
- Mattick JS, Makunin IV. Non-coding RNA. Hum Mol Genet. 2006; 15(Spec No. 1): 17–29.
- Gesteland RF, Cech T, Atkins JF. The RNA world: the nature of modern RNA suggests a prebiotic RNA world. 3rd ed. 2006; Cold Spring Harbor, NY: Cold Spring Harbor Laboratory Press. 768 p.
- Jacob F, Monod J. Genetic regulatory mechanisms in the synthesis of proteins. J Mol Biol. 1961; 3: 318–56.
- Lai EC. Micro RNAs are complementary to 3′ UTR sequence motifs that mediate negative post-transcriptional regulation. Nat Genet. 2002; 30: 363–4.
- Bagga S, Bracht J, Hunter S, Massirer K, Holtz J, Eachus R, etal. Regulation by let-7 and lin-4 miRNAs results in target mRNA degradation. Cell. 2005; 122: 553–63.
- Bartel DP. MicroRNAs: genomics, biogenesis, mechanism, and function. Cell. 2004; 116: 281–97.
- Sood P, Krek A, Zavolan M, Macino G, Rajewsky N. Cell-type-specific signatures of microRNAs on target mRNA expression. Proc Natl Acad Sci USA. 2006; 103: 2746–51.
- Bellingham SA, Coleman BM, Hill AF. Small RNA deep sequencing reveals a distinct miRNA signature released in exosomes from prion-infected neuronal cells. Nucleic Acids Res. 2012; 40: 10937–49.
- Cheng L, Sharples RA, Scicluna BJ, Hill AF. Exosomes provide a protective and enriched source of miRNA for biomarker profiling compared to intracellular and cell-free blood. J Extracell Vesicles. 2014; 3 23743, doi: http://dx.doi.org/10.3402/jev.v3.23743 [PubMed CentralFull Text].
- Vella LJ. The emerging role of exosomes in epithelial–mesenchymal-transition in cancer. Front Oncol. 2014; 4: 361.
- Webber JP, Spary LK, Sanders AJ, Chowdhury R, Jiang WG, Steadman R, etal. Differentiation of tumour-promoting stromal myofibroblasts by cancer exosomes. Oncogene. 2015; 34: 290–302.
- Ono M, Kosaka N, Tominaga N, Yoshioka Y, Takeshita F, Takahashi RU, etal. Exosomes from bone marrow mesenchymal stem cells contain a microRNA that promotes dormancy in metastatic breast cancer cells. Sci Signal. 2014; 7
- Cheng L, Doecke JD, Sharples RA, Villemagne VL, Fowler CJ, Rembach A, etal. Prognostic serum miRNA biomarkers associated with Alzheimer's disease shows concordance with neuropsychological and neuroimaging assessment. Mol Psychiatry. 2015; 20: 1188–96. doi: http://dx.doi.org/10.1038/mp.2014.127.
- Vallelunga A, Ragusa M, Di Mauro S, Iannitti T, Pilleri M, Biundo R, etal. Identification of circulating microRNAs for the differential diagnosis of Parkinson's disease and multiple system atrophy. Front Cell Neurosci. 2014; 8: 156.
- Cooper JM, Wiklander PB, Nordin JZ, Al-Shawi R, Wood MJ, Vithlani M, etal. Systemic exosomal siRNA delivery reduced alpha-synuclein aggregates in brains of transgenic mice. Mov Disord. 2014; 29: 1476–85.
- Linsen SE, de Wit E, Janssens G, Heater S, Chapman L, Parkin RK, etal. Limitations and possibilities of small RNA digital gene expression profiling. Nat Methods. 2009; 6: 474–6.
- Williams Z, Ben-Dov IZ, Elias R, Mihailovic A, Brown M, Rosenwaks Z, etal. Comprehensive profiling of circulating microRNA via small RNA sequencing of cDNA libraries reveals biomarker potential and limitations. Proc Natl Acad Sci USA. 2013; 110: 4255–60.
- Denoeud F, Aury JM, Da Silva C, Noel B, Rogier O, Delledonne M, etal. Annotating genomes with massive-scale RNA sequencing. Genome Biol. 2008; 9: R175.
- Creighton CJ, Reid JG, Gunaratne PH. Expression profiling of microRNAs by deep sequencing. Brief Bioinform. 2009; 10: 490–7.
- Cheng L, Quek C, Sun X, Bellingham SA, Hill AF. Deep-sequencing of microRNA associated with Alzheimer's disease in biological fluids: from biomarker discovery to diagnostic practice. Front Genet. 2013; 4 :150..
- Wu J, Liu Q, Wang X, Zheng J, Wang T, You M, etal. mirTools 2.0 for non-coding RNA discovery, profiling, and functional annotation based on high-throughput sequencing. RNA Biol. 2013; 10: 1087–92.
- Zhu E, Zhao F, Xu G, Hou H, Zhou L, Li X, etal. mirTools: microRNA profiling and discovery based on high-throughput sequencing. Nucleic Acids Res. 2010; 38: W392–7.
- Ronen R, Gan I, Modai S, Sukacheov A, Dror G, Halperin E, etal. miRNAkey: a software for microRNA deep sequencing analysis. Bioinformatics. 2010; 26: 2615–6.
- Friedlander MR, Chen W, Adamidi C, Maaskola J, Einspanier R, Knespel S, etal. Discovering microRNAs from deep sequencing data using miRDeep. Nat Biotechnol. 2008; 26: 407–15.
- An JY, Lai J, Lehman ML, Nelson CC. miRDeep*: an integrated application tool for miRNA identification from RNA sequencing data. Nucleic Acids Res. 2013; 41: 727–37.
- Huang PJ, Liu YC, Lee CC, Lin WC, Gan RR, Lyu PC, etal. DSAP: deep-sequencing small RNA analysis pipeline. Nucleic Acids Res. 2010; 38: W385–91.
- Buermans HP, Ariyurek Y, van Ommen G, den Dunnen JT, t Hoen PA. New methods for next generation sequencing based microRNA expression profiling. BMC Genom. 2010; 11: 716.
- Hackenberg M, Sturm M, Langenberger D, Falcon-Perez JM, Aransay AM. miRanalyzer: a microRNA detection and analysis tool for next-generation sequencing experiments. Nucleic Acids Res. 2009; 37: W68–76.
- Mathelier A, Carbone A. MIReNA: finding microRNAs with high accuracy and no learning at genome scale and from deep sequencing data. Bioinformatics. 2010; 26: 2226–34.
- Wang WC, Lin FM, Chang WC, Lin KY, Huang HD, Lin NS. miRExpress: analyzing high-throughput sequencing data for profiling microRNA expression. BMC Bioinformatics. 2009; 10: 328.
- Humphreys DT, Suter CM. miRspring: a compact standalone research tool for analyzing miRNA-seq data. Nucleic Acids Res. 2013; 41: e147.
- Giurato G, De Filippo MR, Rinaldi A, Hashim A, Nassa G, Ravo M, etal. iMir: an integrated pipeline for high-throughput analysis of small non-coding RNA data obtained by smallRNA-Seq. BMC Bioinformatics. 2013; 14: 362.
- Sun Z, Evans J, Bhagwate A, Middha S, Bockol M, Yan H, etal. CAP-miRSeq: a comprehensive analysis pipeline for microRNA sequencing data. BMC Genom. 2014; 15: 423.
- Li Y, Zhang Z, Liu F, Vongsangnak W, Jing Q, Shen B. Performance comparison and evaluation of software tools for microRNA deep-sequencing data analysis. Nucleic Acids Res. 2012; 40: 4298–305.
- Kleftogiannis D, Korfiati A, Theofilatos K, Likothanassis S, Tsakalidis A, Mavroudi S. Where we stand, where we are moving: surveying computational techniques for identifying miRNA genes and uncovering their regulatory role. J Biomed Inform. 2013; 46: 563–73.
- Hoon S, Ratnapu KK, Chia JM, Kumarasamy B, Juguang X, Clamp M, etal. Biopipe: a flexible framework for protocol-based bioinformatics analysis. Genome Res. 2003; 13: 1904–15. [PubMed Abstract] [PubMed CentralFull Text].
- Kumar S, Dudley J. Bioinformatics software for biologists in the genomics era. Bioinformatics. 2007; 23: 1713–7.
- Oshlack A, Robinson MD, Young MD. From RNA-seq reads to differential expression results. Genome Biol. 2010; 11 (12):220..
- Majer A, Caligiuri K, Booth S, Ying S-Y. A user-friendly computational workflow for the analysis of microRNA deep sequencing data. MicroRNA protocols. Methods in molecular biology. 2013; Totowa, NJ: Humana Press. 35–45.
- Flicek P, Birney E. Sense from sequence reads: methods for alignment and assembly. Nat Methods. 2009; 6(11 Suppl): S6–12.
- Caboche S, Audebert C, Lemoine Y, Hot D. Comparison of mapping algorithms used in high-throughput sequencing: application to Ion Torrent data. BMC Genom. 2014; 15: 264.
- Merriman B, Rothberg JM. Progress in ion torrent semiconductor chip based sequencing. Electrophoresis. 2012; 33: 3397–417.
- Robinson MD, Oshlack A. A scaling normalization method for differential expression analysis of RNA-seq data. Genome Biol. 2010; 11: R25.
- Bullard JH, Purdom E, Hansen KD, Dudoit S. Evaluation of statistical methods for normalization and differential expression in mRNA-Seq experiments. BMC Bioinformatics. 2010; 11: 94.
- Meyer SU, Pfaffl MW, Ulbrich SE. Normalization strategies for microRNA profiling experiments: a “normal” way to a hidden layer of complexity?. Biotechnol Lett. 2010; 32: 1777–88.
- McCormick KP, Willmann MR, Meyers BC. Experimental design, preprocessing, normalization and differential expression analysis of small RNA sequencing experiments. Silence. 2011; 2: 2.
- Pritchard CC, Cheng HH, Tewari M. MicroRNA profiling: approaches and considerations. Nat Rev Genet. 2012; 13: 358–69.
- Dillies MA, Rau A, Aubert J, Hennequet-Antier C, Jeanmougin M, Servant N, etal. A comprehensive evaluation of normalization methods for Illumina high-throughput RNA sequencing data analysis. Brief Bioinform. 2013; 14: 671–83.
- Tam S, Tsao MS, McPherson JD. Optimization of miRNA-seq data preprocessing. Brief Bioinform. 2015. doi: http://dx.doi.org/10.1093/bib/bbv019.
- Garmire LX, Subramaniam S. Evaluation of normalization methods in mammalian microRNA-seq data. RNA. 2012; 18: 1279–88.
- Zhou X, Oshlack A, Robinson MD. miRNA-Seq normalization comparisons need improvement. RNA. 2013; 19: 733–4.
- Hoss AG, Kartha VK, Dong XJ, Latourelle JC, Dumitriu A, Hadzi TC, etal. MicroRNAs located in the Hox gene clusters are implicated in Huntington's disease pathogenesis. PLoS Genet. 2014; 10: e1004188.
- Coleman BM, Hanssen E, Lawson VA, Hill AF. Prion-infected cells regulate the release of exosomes with distinct ultrastructural features. FASEB J. 2012; 26: 4160–73.
- Huang X, Yuan T, Tschannen M, Sun Z, Jacob H, Du M, etal. Characterization of human plasma-derived exosomal RNAs by deep sequencing. BMC Genom. 2013; 14: 319.
- Yuan T, Huang X, Dittmar RL, Du M, Kohli M, Boardman L, etal. eRNA: a graphic user interface-based tool optimized for large data analysis from high-throughput RNA sequencing. BMC Genom. 2014; 15: 176.
- Griffiths-Jones S, Grocock RJ, van Dongen S, Bateman A, Enright AJ. miRBase: microRNA sequences, targets and gene nomenclature. Nucleic Acids Res. 2006; 34: D140–4.
- Chan PP, Lowe TM. GtRNAdb: a database of transfer RNA genes detected in genomic sequence. Nucleic Acids Res. 2009; 37: D93–7.
- Sai Lakshmi S, Agrawal S. piRNABank: a web resource on classified and clustered Piwi-interacting RNAs. Nucleic Acids Res. 2008; 36: D173–7.
- Flicek P, Ahmed I, Amode MR, Barrell D, Beal K, Brent S, etal. Ensembl 2013. Nucleic Acids Res. 2013; 41: D48–55.
- Goodstadt L. Ruffus: a lightweight Python library for computational pipelines. Bioinformatics. 2010; 26: 2778–9.
- Bolger AM, Lohse M, Usadel B. Trimmomatic: a flexible trimmer for Illumina sequence data. Bioinformatics. 2014; 30: 2114–20.
- Langmead B, Salzberg SL. Fast gapped-read alignment with Bowtie 2. Nat Methods. 2012; 9: 357–9.
- Li H, Handsaker B, Wysoker A, Fennell T, Ruan J, Homer N, etal. The sequence alignment/map format and SAMtools. Bioinformatics. 2009; 25: 2078–9.
- Bioinformatics B. FASTQC: a quality control tool for high throughput sequence data. 2011; Cambridge, UK: Babraham Institute.
- DeLuca DS, Levin JZ, Sivachenko A, Fennell T, Nazaire MD, Williams C, etal. RNA-SeQC: RNA-seq metrics for quality control and process optimization. Bioinformatics. 2012; 28: 1530–2.
- Quinlan AR, Hall IM. BEDTools: a flexible suite of utilities for comparing genomic features. Bioinformatics. 2010; 26: 841–2.
- Love MI, Huber W, Anders S. Moderated estimation of fold change and dispersion for RNA-seq data with DESeq2. Genome Biol. 2014; 15: 550.
- Robinson MD, McCarthy DJ, Smyth GK. edgeR: a bioconductor package for differential expression analysis of digital gene expression data. Bioinformatics. 2010; 26: 139–40.
- Law CW, Chen Y, Shi W, Smyth GK. voom: precision weights unlock linear model analysis tools for RNA-seq read counts. Genome Biol. 2014; 15: R29.
- Ritchie ME, Phipson B, Wu D, Hu Y, Law CW, Shi W, etal. limma powers differential expression analyses for RNA-sequencing and microarray studies. Nucleic Acids Res. 2015; 43: e47.
- Wang Z, Gerstein M, Snyder M. RNA-Seq: a revolutionary tool for transcriptomics. Nat Rev Genet. 2009; 10: 57–63.
- Blankenberg D, Von Kuster G, Coraor N, Ananda G, Lazarus R, Mangan M, etal. Galaxy: a web-based genome analysis tool for experimentalists. Curr Protoc Mol Biol. 2010. Chapter 19:Unit 19.10.1–21.
- Giardine B, Riemer C, Hardison RC, Burhans R, Elnitski L, Shah P, etal. Galaxy: a platform for interactive large-scale genome analysis. Genome Res. 2005; 15: 1451–5.
- Park JE, Tan HS, Datta A, Lai RC, Zhang H, Meng W, etal. Hypoxic tumor cell modulates its microenvironment to enhance angiogenic and metastatic potential by secretion of proteins and exosomes. Mol Cell Proteomics. 2010; 9: 1085–99.
- Valadi H, Ekstrom K, Bossios A, Sjostrand M, Lee JJ, Lotvall JO. Exosome-mediated transfer of mRNAs and microRNAs is a novel mechanism of genetic exchange between cells. Nat Cell Biol. 2007; 9: 654–9.