
Abstract
Background and objective
The microbial profiles of stimulated saliva samples have been shown to differentiate between patients with periodontitis, patients with dental caries, and orally healthy individuals. Saliva was stimulated to allow for easy and rapid collection; however, microbial composition may not reflect the more natural, unstimulated state. The purpose of this study was to validate whether stimulated saliva is an adequate surrogate for unstimulated saliva in determining salivary microbiomes.
Design
Unstimulated (n=20) and stimulated (n=20) saliva samples were collected from 20 orally and systemically healthy, non-smoking participants. Salivary bacterial profiles were analyzed by means of the Human Oral Microbe Identification using Next Generation Sequencing (HOMINGS), and statistical analysis was performed using Mann–Whitney test with Benjamini–Hochberg's correction for multiple comparison, cluster analysis, principal component analysis, and correspondence analysis.
Results
From a total of 40 saliva samples, 496 probe targets were identified with a mean number of targets per sample of 203 (range: 146–303), and a mean number of probe targets of 206 and 200 in unstimulated and stimulated saliva samples, respectively (p=0.62). Based on all statistical methods used for this study, the microbial profiles of unstimulated and stimulated saliva samples collected from the same person were not statistically significantly different.
Conclusions
Analysis of bacterial salivary profiles in unstimulated and stimulated saliva samples collected from the same individual showed comparable results. Thus, the results verify that stimulated saliva is an adequate surrogate of unstimulated saliva for microbiome-related studies.
To access the supplementary material to this article, please see Supplementary files under ‘Article Tools’.
The composition of oral microbiota is highly complex, diverse, and site specific (Citation1, Citation2), and interactions between the resident microbiota and the host is believed to be critically involved in maintenance of oral health. In addition, local alterations of the oral microbiota in relation to ecological perturbations have been considered a prerequisite for the development of periodontitis and dental caries (Citation3–Citation5).
The salivary microbiota is composed of bacteria shed from different oral surfaces being in direct contact with saliva and contains more than 100 million bacteria/mL of saliva (Citation6), which accounts for approximately 1% of the total amount of DNA present in saliva (Citation7). Using molecular methods, the salivary microbiota in oral health has been characterized (Citation8, Citation9) and has been shown to be mostly comparable with the microbiota of the throat, the tonsils, and the dorsum of the tongue (Citation8).
Saliva is an attractive medium for studies of biomarkers associated with oral health and disease for several reasons including that it is non-invasive, fast, safe to handle, easy to ship and store, and inexpensive, as only one sample from each individual is collected and analyzed (Citation10, Citation11). Notably, several cross-sectional studies using stimulated saliva samples have reported salivary bacterial profiles that differentiate between patients with periodontitis, dental caries, and orally healthy individuals (Citation12–Citation14), suggesting that salivary bacterial profiles could potentially be used as a biomarker for population-based screening of oral disease at preclinical stages.
Collection of stimulated saliva samples is significantly faster and more comfortable for the patient than collection of an unstimulated saliva sample, which may favor the use of stimulated saliva samples for screening of larger populations. However, in the area of proteomics, analysis of unstimulated saliva samples is usually preferred over stimulated saliva samples because dilution of the proteomic components in stimulated saliva samples has been reported (Citation15, Citation16). Likewise, data from a recent study of two healthy individuals reported higher bacterial diversity in unstimulated saliva samples compared with that of stimulated saliva samples (Citation17). In contrast, earlier investigations have reported that stimulated saliva samples may be more useful than unstimulated saliva samples for identification of specific oral bacterial taxa such as Streptococcus mutans (Citation18) and Aggregatibacter actinomycetemcomitans (Citation19). However, to the best of our knowledge, no previous study has systematically addressed the similarities of the salivary microbiota comparing the salivary microbiomes from unstimulated and stimulated saliva samples collected from the same individuals.
Therefore, the purpose of this study was to directly compare salivary bacterial profiles based on data from unstimulated and stimulated saliva samples collected from systemically and orally healthy individuals by means of the Human Oral Microbe Identification using Next Generation Sequencing (HOMINGS) technique to verify if salivary bacterial profiles are comparable from both types of samples.
Material and methods
Study population
In April 2015, 20 adults who fulfilled the inclusion criteria were enrolled in this study. Inclusion criteria were individuals aged ≥18 years seeking dental treatment at the Department of Odontology, University of Copenhagen, Copenhagen, Denmark. Exclusion criteria were as follows: presence of periodontitis or dental caries according to predefined criteria, current daily smokers, presence of any systemic disease, use of any kind of medication, and treatment with local or systemic antibiotics within the past 3 months prior to participation.
Smoking habit, systemic health, use of medication, and previous antibiotic therapy were addressed by questionnaire. Clinical screening of periodontitis and dental caries was performed by the same examiner (DB) in combination with the analysis of bite-wing X-rays. Based on our previous studies, periodontitis was defined as bleeding on probing ≥25% of total sites+minimum two teeth with clinical attachment level ≥4 mm+minimum two teeth with probing depth ≥6 mm. Pronounced dental caries was defined as untreated caries ≥three surfaces (Citation9, Citation12–Citation14).
Thus, the study population comprised 20 adults, mean age 29 (range: 20–53 years), 10 male and 10 female Caucasians, all seeking dental care at the Department of Odontology, University of Copenhagen. All participants signed an informed consent prior to participation, and the study was approved by the regional ethical committee (H-15000856) and reported to the Danish Data Authorization (2015-54-0970).
Collection of saliva samples
All saliva samples were collected between 8 AM and 11 AM, and to avoid bleeding or any other contamination of saliva, samples were collected before dental treatment. Participants were instructed not to brush the morning before sampling. Initially, an unstimulated saliva sample was collected, followed immediately by a stimulated saliva sample from the same individual.
Unstimulated saliva samples were collected according to a protocol, modified from a previous study (Citation20). Participants were initially asked to rinse their mouth with tap water prior to sampling, followed by collection of at least 5 ml unstimulated saliva in a plastic cup. Finally, the sample was transferred to a plastic tube and stored at −80°C. Collection of stimulated saliva samples was performed according to a previously described protocol (Citation21). In brief, participants started by flushing thoroughly with tap water followed by chewing of paraffin gum for 1 min. Participants expectorated for 1 min and the saliva was discarded. Participants then continued to expectorate for an additional 3 min in a plastic cup. Finally, the stimulated saliva sample was transferred to a plastic tube and stored at −80°C as above.
Human Oral Microbe Identification using Next Generation Sequencing
DNA isolation was performed as previously described (Citation9, Citation12–Citation14), and HOMINGS, the successor to the Human Oral Microbe Identification Microarray (HOMIM), was used for microbial analysis (Citation22–Citation24). In brief, HOMINGS is an Illumina-based next-generation sequencing technique, which in combination with a customized BLAST program (called ProbeSeq for HOMINGS) developed at the Forsyth Institute, enables simultaneous identification of approximately 600 oral taxa at the species level.
The laboratory procedures of HOMINGS were performed using a modified protocol previously described (Citation25). Initially, 10–50 ng of sample DNA were PCR-amplified using V3-V4 Forward (341F) AATGATACGGCGACCACCGAGATCTACACTATGGTAATTGTCCTACGGGAGGCAGCAG and reverse (806R) CAAGCAGAAGACGGCATACGAGATNNNNNNNNNNNNAGTCAGTCAGCCGGACTACHVGGGTWTCTAAT primers, followed by purification (AMPure beads), gel-purification, and quantification (qPCR). Finally, 12 pM of the library mixture, spiked with 20% PhiX (Illumina, San Diego, CA), was sequenced by use of MiSeq (Illumina). In this study, an average of 34,091 sequences (441 bp long) was obtained from each sample. Bad sequences were determined as based on Q scores of less than 25 and were not considered for stitching of forward and reverse reads. For this study, chimeric sequences after stitching were not removed for analyses. However, in a separate analysis, chimeric sequences ranged from 10 to 15% of the total reads. Relative proportions of detected taxa did not vary significantly (data not shown).
Bacterial identification using ProbeSeq was performed as all generated sequences were BLASTed against 598 species-specific and 94 genus-specific (sequences that recognizes two or more closely related taxa within the same bacterial genus) 16S rDNA-based reference sequences (17 to 40 bases long), many of which were originally designed for HOMIM. A complete list of probes present in ProbeSeq is presented in Supplementary file 1).
Statistical analysis
Comparisons of unstimulated saliva samples (n=20) and stimulated saliva samples (n=20) at probe level were analyzed using the Mann–Whitney test with Benjamini–Hochberg correction for multiple comparisons. Benjamini–Hochberg correction was used for control of false-positive discoveries in positive-dependent assumptions (Citation26). For this analysis, an adjusted p-value of <0.01 was considered statistically significant. Analysis of comparability of microbial community profiles in unstimulated and stimulated saliva samples collected from the same individual was performed using cluster analysis, principal component analysis, and correspondence analysis. For hierarchal clustering, Spearman Rank correlations with average linkage were used to construct dendrograms. The alpha diversity for microbial profiles was compared by Shannon index calculations using the following formula. H’=– Σp i ln(p i ), where p i is the relative abundance. Student t-tests, paired and unpaired, were used to determine statistical differences of alpha diversity. Graphpad prism 5 (San Diego, CA) and MeV 4_8_1 (Citation27) were used as statistical software.
Results
General findings
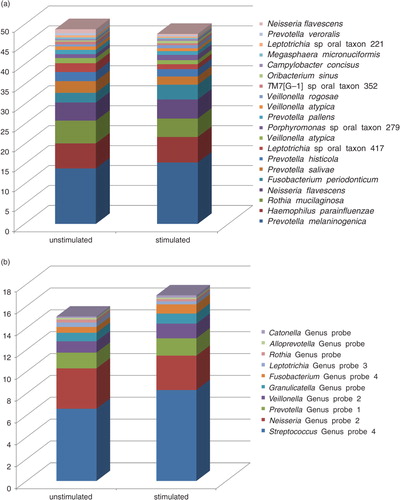
Of a total of 40 saliva samples (20 unstimulated and 20 stimulated), positive identification for targets of 496 probe sequences were observed (421 identifying a bacterial taxon and 75 identifying a bacterial genus, for example, two or more members of the same genus) corresponding to a coverage of 65% of the 768 probe sequences present in the ProbeSeq database (a complete list of bacterial probes detected are presented in Supplementary file 2. The mean number of probe targets identified per sample was 203 (range: 146–303), with a mean number of probe targets of 206 and 200 in unstimulated and stimulated saliva samples, respectively (p=0.62). The most predominant probe targets at species-level and genus-level are presented in a and b. No difference between distributions of predominant genera was observed between unstimulated and stimulated saliva samples (adjusted p-value=1). An average of 34,091 sequences (range: 10,237–65,108) was generated out of which 55.3% (range: 46.2–65.6%) and 17.9% (range: 8.2–30.5%) were identified at species-level and genus-level, respectively. In addition, an average of 26.8% (range: 14.8–39.3%) of the sequences generated could not be assigned to either a species-specific or a genus-specific probe sequence based on blast against the ProbeSeq database. No differences between number of sequences (p=0.51), proportions of sequences identified at species (p=0.74) and genus levels (p=0.39), as well as proportions of unmatched sequences (p=0.60) were observed between unstimulated and stimulated saliva samples.
Fig. 1. Relative abundance of predominant species-level and genus-level probe targets. (a) Relative abundance of the 20 most predominant species-level probe targets in each group. (b) Relative abundance of the 10 most predominant genus-level probe targets in each group.
No difference between unstimulated and stimulated saliva samples at probe level
Based on comparison at probe level, six out of 496 probe targets were present with a significantly different frequency and a different mean proportion, respectively, in unstimulated (n=20) or stimulated saliva samples (n=20) (p<0.05). However, when adjusting for multiple assumptions no probe targets were present with a different frequency or with different mean proportions in unstimulated or stimulated saliva samples (adjusted p-value=1, Supplementary file 2).
Strong concordance of bacterial salivary profiles in unstimulated and stimulated saliva samples collected from the same individual
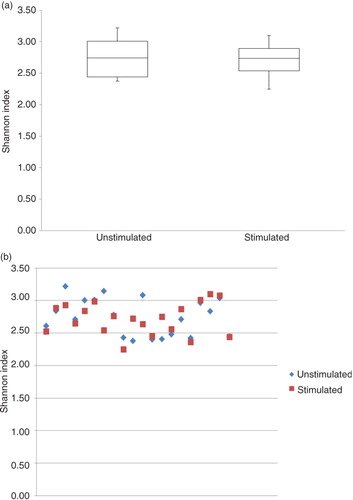
Comparison of bacterial community profiles in unstimulated and stimulated saliva samples using cluster analysis demonstrated tight clustering of sample pairs (unstimulated vs. stimulated saliva sample) collected from the same individual (). In addition, principal component analysis and correspondence analysis illustrated clustering between the majority of sample pairs ( and ). Alpha diversity as calculated using the Shannon index demonstrated no statistically significant differences between microbial profiles of unstimulated versus stimulated saliva samples collectively among subjects (unpaired t-test, p=0.74, a) or within the same subject (paired t-test, p=0.60, b).
Fig. 2. Cluster analysis based on Spearman Rank Correlation. Unstimulated saliva samples, blue; stimulated saliva samples, red. Sample denotation: 1–20 (Individual 1–Individual 20). US, unstimulated saliva sample; S, stimulated saliva sample.
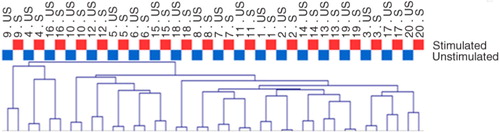
Fig. 3. Principal component analysis visualized two-dimensionally with axes expressed as the two most crucial components accounting for 59.8% of the variation of the dataset. Sample denotation: 1–20 (Individual 1–Individual 20). Unstimulated saliva samples (blue) and stimulated saliva samples (red).
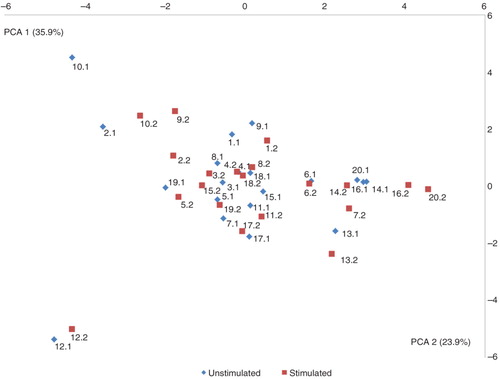
Fig. 4. Correspondence analysis visualized two-dimensionally with axes expressed as the two most crucial inertia values accounting for a cumulative inertia of 34.92%. Sample denotation: 1–20 (Individual 1–Individual 20). Unstimulated saliva samples (blue) and stimulated saliva samples (red).
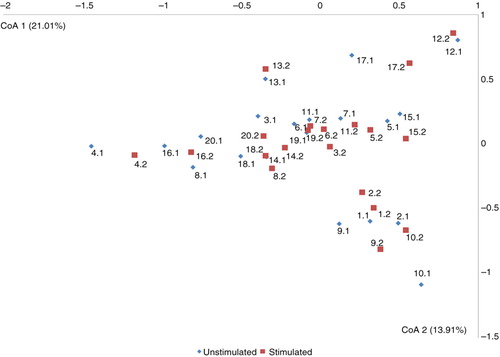
Fig. 5. Shannon index displaying alpha diversity between microbial profiles of unstimulated and stimulated saliva samples. (a) Collectively among subjects. (b) Within individual subjects.
Discussion
The purpose of this study was to determine whether stimulated saliva was a valid surrogate for the more natural, unstimulated saliva, as we hypothesized that the bacterial component of stimulated saliva might be diluted as compared with unstimulated saliva samples. The main finding was that there was essentially no difference in stimulated versus unstimulated saliva in the same individual with respect to microbiome analysis. There was likely a dilution effect, but this could not be determined in this study. Nevertheless, the overall composition and proportions remained constant, which is why based on data from this study, stimulated saliva samples might be employed as an adequate surrogate of unstimulated saliva used for oral microbiome studies.
Saliva-based analysis has been proposed as an approach for population-based screening of oral health and disease, and salivary concentrations of several proteins (Citation28, Citation29), as well as alterations of salivary bacterial profiles (Citation12, Citation13) have been suggested as candidate biomarkers associated with oral health and disease. The main advantage of using saliva for biomarker analysis is that saliva can be easily and non-invasively collected routinely in the dental office (Citation10, Citation11) (Citation30). For practical reasons, however, stimulated saliva samples may be preferred over unstimulated saliva samples, as these can be collected in higher volumes and considerably faster than unstimulated saliva samples. Not surprisingly, the proteomic profile of stimulated saliva samples has been reported to be diluted when compared with unstimulated saliva samples, which is why unstimulated saliva samples are preferred for proteomic analysis of saliva (Citation15, Citation16). A few studies have previously compared the ability to detect specific oral bacteria, in unstimulated versus stimulated saliva samples by means of different culture-dependent microbial techniques (Citation18, Citation19). Interestingly, both studies reported stimulated saliva samples as superior to unstimulated saliva samples for bacterial identification (Citation18, Citation19). On the contrary, a recently published report based on pyrosequencing of microbial samples from two healthy individuals suggested that the microbiota of stimulated saliva samples might be diluted compared with unstimulated saliva samples (Citation17). Thus, to the best of our knowledge, a systematic comparative analysis between saliva microbiomes in unstimulated and stimulated saliva samples, using contemporary molecular methods, remains to be performed. Essentially, from a practical point of view, this is crucial when evaluating the feasibility of using salivary bacterial profiles as a potential biomarker for screening of oral health and disease status.
We demonstrated similarities between the microbiomes of stimulated versus unstimulated saliva by several means. For example, essentially no differences in the proportional presence of the most predominant species-level and genus-level probe targets were observed (a and b), and comparative analysis was very similar based on cluster analysis (), principal component analysis (), and correspondence analysis (). In addition, alpha diversity, as measured using the Shannon index, demonstrated further that there were no statistically significant differences in the microbial profiles of stimulated and unstimulated saliva (a and b). Furthermore, no differences at probe level based on proportional presence between unstimulated saliva samples and stimulated saliva samples were evident (adjusted p-value=1, Supplementary file 2). Notably, these findings suggest that even though the bacterial component of stimulated saliva samples may be diluted when compared with unstimulated saliva samples, comparable information on the proportional presence of the salivary microbiota could be obtained from both stimulated and unstimulated saliva samples by means of HOMINGS analysis. This indicates that it is feasible to use salivary bacterial profiles as biomarkers of oral health and disease. Consequently, data from this study highlight that salivary microbiomes can be accurately characterized by analysis of stimulated saliva samples. Thus, based on these findings, we propose that longitudinal screening of the salivary microbiota may be performed using stimulated saliva samples, and speculate that, at the individual level, alterations of the salivary microbiota might hold the potential to identify local bacterial alterations associated with oral diseases at preclinical stages.
In summary, the data suggest that in microbiome-based studies, stimulated saliva samples can serve as an adequate surrogate for unstimulated saliva. Use of stimulated saliva in such studies will significantly reduce time spent, and hence cost, on sample collection. Furthermore, the shorter duration of collection time is easier and more comfortable for patients.
Conflict of interest and funding
The authors declare no conflict of interest. This study was supported by external financial support from the Danish Dental Association, the Danish Foundation of Mutual Efforts in Dental Care, Trygfonden, and the Simon Spies Foundation. Funded in part from NIH grant, DE021565 (BJP).
Supplementary Material 1
Download MS Excel (37.9 KB)Supplementary Material 2
Download MS Excel (75 KB)Acknowledgements
The authors thank Nikolai Kirkby for assistance with DNA isolation.
Notes
To access the supplementary material to this article, please see Supplementary files under ‘Article Tools’.
Related Research Data
References
- Dewhirst FE, Chen T, Izard J, Paster BJ, Tanner AC, Yu WH, etal. The human oral microbiome. J Bacteriol. 2010; 192: 5002–17. [PubMed Abstract] [PubMed CentralFull Text].
- Aas JA, Paster BJ, Stokes LN, Olsen I, Dewhirst FE. Defining the normal bacterial flora of the oral cavity. J Clin Microbiol. 2005; 43: 5721–32. [PubMed Abstract] [PubMed CentralFull Text].
- Jenkinson HF, Lamont RJ. Oral microbial communities in sickness and in health. Trends Microbiol. 2005; 13: 589–95. [PubMed Abstract].
- Teles R, Teles F, Frias-Lopez J, Paster B, Haffajee A. Lessons learned and unlearned in periodontal microbiology. Periodontol 2000. 2013; 62: 95–162. [PubMed Abstract] [PubMed CentralFull Text].
- Wade WG. The oral microbiome in health and disease. Pharmacol Res. 2013; 69: 137–43. [PubMed Abstract].
- Curtis MA, Zenobia C, Darveau RP. The relationship of the oral microbiotia to periodontal health and disease. Cell Host Microbe. 2011; 10: 302–6. [PubMed Abstract] [PubMed CentralFull Text].
- Lazarevic V, Whiteson K, Gaia N, Gizard Y, Hernandez D, Farinelli L, etal. Analysis of the salivary microbiome using culture-independent techniques. J Clin Bioinforma. 2012; 2: 4. [PubMed Abstract] [PubMed CentralFull Text].
- Segata N, Haake SK, Mannon P, Lemon KP, Waldron L, Gevers D, etal. Composition of the adult digestive tract bacterial microbiome based on seven mouth surfaces, tonsils, throat and stool samples. Genome Biol. 2012; 13: R42. [PubMed Abstract] [PubMed CentralFull Text].
- Belstrøm D, Holmstrup P, Nielsen CH, Kirkby N, Twetman S, Heitmann BL, etal. Bacterial profiles of saliva in relation to diet, lifestyle factors, and socioeconomic status. J Oral Microbiol. 2014; 6: 23609. doi: http://dx.doi.org/10.3402/jom.v6.23609.
- Giannobile WV, McDevitt JT, Niedbala RS, Malamud D. Translational and clinical applications of salivary diagnostics. Adv Dent Res. 2011; 23: 375–80. [PubMed Abstract] [PubMed CentralFull Text].
- Yoshizawa JM, Schafer CA, Schafer JJ, Farrell JJ, Paster BJ, Wong DT. Salivary biomarkers: toward future clinical and diagnostic utilities. Clin Microbiol Rev. 2013; 26: 781–91. [PubMed Abstract] [PubMed CentralFull Text].
- Belstrøm D, Fiehn NE, Nielsen CH, Kirkby N, Twetman S, Klepac-Ceraj V, etal. Differences in bacterial saliva profile between periodontitis patients and a control cohort. J Clin Periodontol. 2014; 41: 104–12.
- Belstrøm D, Fiehn NE, Nielsen CH, Holmstrup P, Kirkby N, Klepac-Ceraj V, etal. Altered bacterial profiles in saliva from adults with caries lesions: a case-cohort study. Caries Res. 2014; 48: 368–75.
- Belstrøm D, Fiehn NE, Nielsen CH, Klepac-Ceraj V, Paster BJ, Twetman S, etal. Differentiation of salivary bacterial profiles of subjects with periodontitis and dental caries. J Oral Microbiol. 2015; 6: 27429. doi: http://dx.doi.org/10.3402/jom.v7.27429.
- Yakob M, Fuentes L, Wang MB, Abemayor E, Wong DT. Salivary biomarkers for detection of oral squamous cell carcinoma – current state and recent advances. Curr Oral Health Rep. 2014; 1: 133–41. [PubMed Abstract] [PubMed CentralFull Text].
- Schafer CA, Schafer JJ, Yakob M, Lima P, Camargo P, Wong DT. Saliva diagnostics: utilizing oral fluids to determine health status. Monogr Oral Sci. 2014; 24: 88–98. [PubMed Abstract].
- Simón-Soro A, Tomás I, Cabrera-Rubio R, Catalan MD, Nyvad B, Mira A. Microbial geography of the oral cavity. J Dent Res. 2013; 92: 616–21.
- Dasanayake AP, Caufield PW, Cutter GR, Roseman JM, Köhler B. Differences in the detection and enumeration of mutans streptococci due to differences in methods. Arch Oral Biol. 1995; 40: 345–51. [PubMed Abstract].
- Asikainen S, Alaluusua S, Saxén L. Recovery of A. actinomycetemcomitans from teeth, tongue, and saliva. J Periodontol. 1991; 62: 203–6. [PubMed Abstract].
- Ebersole JL, Schuster JL, Stevens J, Dawson DIII, Kryscio RJ, Lin Y, etal. Patterns of salivary analytes provide diagnostic capacity for distinguishing chronic adult periodontitis from health. J Clin Immunol. 2013; 33: 271–9. [PubMed Abstract] [PubMed CentralFull Text].
- Kongstad J, Ekstrand K, Qvist V, Christensen LB, Cortsen B, Gronbaek M, etal. Findings from the oral health study of the Danish Health Examination Survey 2007–2008. Acta Odontol Scand. 2013; 71: 1560–9. [PubMed Abstract].
- Gomes BP, Berber VB, Kokaras AS, Chen T, Paster BJ. Microbiomes of endodontic-periodontal lesions before and after chemomechanical preparation. J Endod. 2015; 41: 1975–84. [PubMed Abstract].
- Belstrøm D, Paster BJ, Fiehn NE, Bardow A, Holmstrup P. Salivary bacterial fingerprints of established oral disease revealed by the Human Oral Microbe Identification using Next Generation Sequencing (HOMINGS) technique. J Oral Microbiol. 2016; 8: 30170. doi: http://dx.doi.org/10.3402/jom.v8.30170.
- Belstrøm D, Holmstrup P, Bardow A, Kokaras A, Fiehn NE, Paster BJ. Temporal Stability of the Salivary Microbiota in Oral Health. PLoS One. 2016; 11: e0147472.
- Caporaso JG, Lauber CL, Walters WA, Berg-Lyons D, Lozupone CA, Turnbaugh PJ, etal. Global patterns of 16S rRNA diversity at a depth of millions of sequences per sample. Proc Natl Acad Sci USA. 2011; 108(Suppl 1): 4516–22. [PubMed Abstract] [PubMed CentralFull Text].
- Hochberg Y, Benjamini Y. More powerful procedures for multiple significance testing. Stat Med. 1990; 9: 811–18. [PubMed Abstract].
- Saeed AI, Bhagabati NK, Braisted JC, Liang W, Sharov V, Howe EA, etal. TM4 microarray software suite. Methods Enzymol. 2006; 411: 134–93. [PubMed Abstract].
- Kinney JS, Morelli T, Braun T, Ramseier CA, Herr AE, Sugai JV, etal. Saliva/pathogen biomarker signatures and periodontal disease progression. J Dent Res. 2011; 90: 752–8. [PubMed Abstract] [PubMed CentralFull Text].
- Rathnayake N, Akerman S, Klinge B, Lundegren N, Jansson H, Tryselius Y, etal. Salivary biomarkers of oral health: a cross-sectional study. J Clin Periodontol. 2013; 40: 140–7. [PubMed Abstract].
- Giannobile WV, Beikler T, Kinney JS, Ramseier CA, Morelli T, Wong DT. Saliva as a diagnostic tool for periodontal disease: current state and future directions. Periodontol 2000. 2009; 50: 52–64. [PubMed Abstract].