
Abstract
Background
Some dental plaque fluoresces red. The factors involved in this fluorescence are yet unknown.
Objective
The aim of this study was to assess systematically the effect of age, thickness, and cariogenicity on the extent of red fluorescence produced by in vitro microcosm biofilms.
Design
The effects of biofilm age and thickness on red fluorescence were tested in a constant depth film fermentor (CDFF) by growing biofilms of variable thicknesses that received a constant supply of defined mucin medium (DMM) and eight pulses of sucrose/day. The influence of cariogenicity on red fluorescence was tested by growing biofilm on dentin disks receiving DMM, supplemented with three or eight pulses of sucrose/day. The biofilms were analyzed at different time points after inoculation, up to 24 days. Emission spectra were measured using a fluorescence spectrophotometer (λexc405 nm) and the biofilms were photographed with a fluorescence camera. The composition of the biofilms was assessed using 454-pyrosequecing of the 16S rDNA gene.
Results
From day 7 onward, the biofilms emitted increasing intensities of red fluorescence as evidenced by the combined red fluorescence peaks. The red fluorescence intensity correlated with biofilm thickness but not in a linear way. Biofilm fluorescence also correlated with the imposed cariogenicity, evidenced by the induced dentin mineral loss. Increasing the biofilm age or increasing the sucrose pulsing frequency led to a shift in the microbial composition. These shifts in composition were accompanied by an increase in red fluorescence.
Conclusions
The current study shows that a thicker, older, or more cariogenic biofilm results in a higher intensity of red fluorescence.
To access the supplementary material to this article, please see Supplementary files under ‘Article Tools’.
Dental caries is one of the most prevalent oral infectious diseases (Citation1). When fermentable dietary carbohydrates are frequently present in the mouth, the pH of the biofilm on the teeth (dental plaque) decreases which, when combined with an inadequate oral hygiene, subsequently leads to mineral loss of enamel or dentin (Citation2, Citation3). In the long run, this results in tooth decay.
With adequate daily oral hygiene to remove the plaque, developing caries lesions can be brought to a halt and the acid-induced damage can be reversed (remineralized) in time (Citation3). When plaque has not been removed for a longer period of time, the plaque ages, that is, it matures. In the presence of fermentable carbohydrates, the lowered pH of the supragingival plaque leads to a shift in the composition, toward a more cariogenic biofilm (Citation2, Citation4) (Citation5).
Dental plaque can fluoresce red when excited with violet light (Citation6–Citation10). Currently, the origin of this red fluorescence is not known, resulting in assumptions about its significance in dental practice. The fluorescence may be the result of the production of metabolic by-products from microorganisms in the plaque (Citation11). Since not all dental plaque fluoresces red, it has been suggested that it is the mature dental plaque that fluoresces red (Citation7, Citation12) (Citation13) and that it is related to its cariogenicity as well (Citation14). Active caries lesions as well as dental plaque have been shown to fluoresce red, when excited with violet light (Citation11, Citation15–Citation17), which is in line with the hypothesis that red fluorescence is related to the cariogenicity of plaque. It has therefore been suggested that plaque fluorescence could help in the risk assessment of patients (Citation18) or to identify high-risk areas in the mouth for caries development.
Prior studies which aimed to identify the origin of red plaque fluorescence focused on growing microcosm biofilms at different sucrose concentrations (Citation14) or looked at biofilms at different time points (Citation19). An in situ study looked at plaque fluorescence with and without sucrose challenges (Citation20). However, the thickness of the biofilms was not looked at or controlled in the studies; biofilm thickness can vary greatly in a biofilm model with horizontally placed substrata as well as in a clinical situation where a participant can be a heavy or a light plaque former (Citation21).
While previous studies looked at the influence of sucrose concentrations and of the maturation of the plaque, only total and aciduric bacterial CFUs were determined (Citation14, Citation19). The total biofilm composition was not taken into account, while this could give an indication about the relation between biofilm fluorescence and specific taxa present in the biofilm.
In this study, we assessed the effects of biofilm age, thickness, and cariogenicity separately on the intensity of red fluorescence of in vitro biofilms to improve our understanding of the red fluorescence of dental plaque. Our hypothesis was that older, thicker, and cariogenic dental biofilm would produce a higher intensity of fluorescence than younger, thinner, and less-cariogenic dental biofilm.
Materials and methods
Microcosm biofilm growth
A constant depth film fermentor (CDFF) was used in a ‘conventional’ mode as described by Pratten (Citation22) and in an ‘oscillating’ mode as described by Deng et al. (Citation23). The latter allows the application of two growth conditions simultaneously within one model. The CDFF model allows the simultaneous growth of 75 biofilms, divided over 15 pans with 5 substrata plugs in each. In oscillating mode, five pans were removed to avoid carry-over (Citation23). The CDFF was maintained at 37°C in an incubator (Incucell 220R, MMM Medcenter Einrichtungen GmbH, Gräfelfing, Germany). The CDFF was kept under anaerobic conditions by supplying 10% CO2 and 10% H2 in N2 through a 0.2 µm filter device (Acro® 37 TF, Pall Life Sciences, Ann Arbor, MI) at a rate of approximately 50±0.5 mL/min. The CDFF was inoculated with stimulated saliva from one systemically healthy donor without active caries or gingivitis. Nine mL of saliva was mixed with 200 mL of defined mucin medium (DMM) (Citation24). The inoculum was pumped into the CDFF for 1.5 h at a flow rate of 138 mL/h. After inoculation, fresh DMM was constantly supplied at a rate of 36 mL/h. Medium flow and sucrose pulses were regulated by calibrated and computer-controlled peristaltic pumps (Ismatec, Zürich, Switzerland) and controlled by LabView software (National Instruments, Austin, TX).
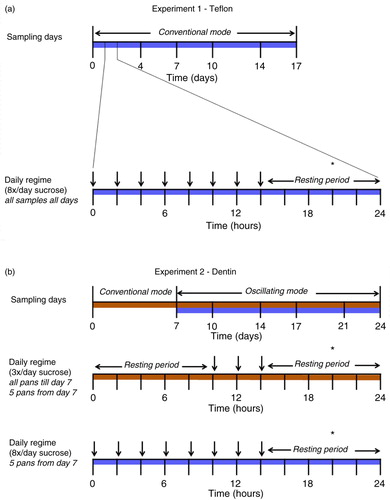
Fig. 1 A diagram of the sampling days and the daily CDFF regime for 17 days (experiment 1) and 24 days (experiment 2). Each day, the DMM supply was interrupted by 5-min-long sucrose pulses (vertical arrows). The asterisk (*) depicts the moment of sampling.
Age and thickness – experiment 1
The effects of age and thickness on fluorescence were tested on biofilms grown on Teflon (Polytetrafluoroethylene). The depth of the plugs in the CDFF was set at 100, 200, 500, and 600 (two plugs) µm. The 100 and 200 µm depths are clinically relevant biofilm thicknesses for smooth surfaces (Citation25) and 500 and 600 µm are more likely to be found in fissures or on approximal surfaces (Citation25). The CDFF was set in the ‘conventional’ 360° mode (Citation22) at a rotational speed of 6 rpm. Every 24 h, eight 2-hourly 5-min sucrose pulses were given (10% w/v sucrose, alternating with DMM), then followed by an 8-h resting period (in which only DMM was supplied) to simulate cariogenic stress and recovery (). Three pans (with five plugs of biofilms each) were sampled 4, 7, 10, 14, and 17 days after inoculation. The samples were taken at the end of the resting period (6–7 h after the last sucrose pulse).
Age and cariogenicity – experiment 2
The effects of age and cariogenic stress on the red fluorescence of the biofilm were tested in a second experiment by growing biofilms under various sucrose conditions. In this experiment, the biofilms were grown on freshly extracted coronal dentin from bovine incisors (Ø 5 mm) to be able to determine the mineral loss after growing the biofilms and therewith the cariogenic potential of the biofilms. The depth of the plugs in the CDFF was set at 600 µm as this depth gave the most prominent red fluorescence in the first experiment. The inoculation procedure was identical to the first experiment, described above, but for the first 7 days, the biofilms received three daily administrations of sucrose (10% w/v sucrose) for 5 min per 24 h in addition to DMM. After inoculation, the CDFF was first set in the conventional 360° mode, and the biofilms were allowed to develop undisturbed for 7 days (). After this week, the CDFF was switched to the oscillating mode with the turntable rotating 180° back and forth. This implied that biofilms with two different growth conditions could be grown simultaneously (Citation23). Five pans (25 biofilms) were removed from the CDFF to create this split design. Biofilms from two pans were used for analysis; the other three pans were empty and discarded. All biofilms received a constant supply of DMM (18 mL/h) per inlet and depending on the group, either three or eight sucrose pulses per day to apply a difference in cariogenicity. The samples remaining in the CDFF were collected at different time points (10, 14, 17, 21, and 24 days; one pan per group per time point) after switching to the oscillating mode (). All samples were taken at the end of the resting period (6–7 h after the last sucrose pulse) ().
In case dentin was lost from the pin during the autoclaving process or the scraper blades had removed a substantial part of a biofilm, samples were excluded from analysis.
Fluorescence assessment – experiment 1 and 2
After sampling, the fluorescence of the biofilms was assessed by measuring the emission spectra (λexc 405±20 nm) with a fiber-optic spectrophotometer (USB4000 – FL, reflection probe, Ø 600 µm, Ocean Optics Inc., Dunedin, FL, six illumination fibers around one read fiber) 6 mm from the surface of the biofilm (measuring per plug). The biofilms were subsequently photographed for visual assessment using a QLF-D Biluminator camera system (QLF; Inspektor Research Systems BV, Amsterdam, the Netherlands) as described earlier (Citation26). The photographs were taken with fixed camera settings (white light photographs: shutter speed 1/160th; aperture value 13; ISO 1600; QLF photographs: shutter speed 1/30th; aperture value 8.0; ISO 1600). The biluminator tube was placed directly around the CDFF pans. To prevent photo bleaching (Citation6) of the samples, all measurements were performed in a dark room. The samples were illuminated by LEDs only while taking spectra and capturing QLF photographs.
Assessment of Integrated Mineral Loss (IML) and lesion depth – experiment 2
The dentin discs from experiment 2 were stored at 4°C, and after completing the experiment, transversal microradiography (TMR) was performed as described by Van Strijp et al. (Citation27). Mineral loss of enamel or dentin indicates the cariogenic potential of a biofilm (Citation28). TMR assesses the mineral changes (de- and re-mineralization) by taking an X-ray of cross sections (200 µm) of the dentin discs on a high-resolution film, together with a calibration stepwedge. Thereafter, this microradiogram is digitized and analyzed with a microscope-video camera-microcomputer setup with dedicated software (TMR 2000 2.0.27.16; Inspektor Research Systems BV, Amsterdam, the Netherlands).
DNA extraction, amplicon preparation and pyrosequencing – experiment 2
From the 75 plugs with biofilm in the second experiment, 15 plugs (three pans) had to be discarded due to the oscillating mode of the CDFF. From the remaining 60 plugs with biofilm (five plugs per pan, six time points, and two sucrose groups), one biofilm sample per group was included for microbiome analyses. An extra sample was included from a different pan at day 7 (before the oscillating mode, three times sucrose a day) to assess the reproducibility of the samples between pans. Two extra samples from one pan (different plugs) were included for day 10 and day 21 to assess the reproducibility within one pan. The biofilm was directly scraped off from the dentin surface and put in an Eppendorf tube (1.5 mL, Eppendorf AG, Hamburg, Germany) and immediately stored at −80°C.
DNA was extracted using a mag Mini DNA Isolation Kit (LGC genomics, GmbH, Berlin, Germany) as described previously (Citation29). Barcoded amplicon libraries of the small subunit ribosomal RNA gene hypervariable region V5–V7 were generated for each of the individual samples as described previously (Citation30), pooled and sequenced by Macrogen Inc. (Seoul, Republic of Korea) using the 454 GS-FLX+ Titanium system (Roche Molecular Diagnostics, Branford, CT) (Citation31). The sequencing data were processed and filtered using QIIME (qiime.org) as described previously (Citation30, Citation31). In brief, after quality filtering, the reads were denoised using Denoiser version 1.3.0 (Citation32) and chimeric reads were identified using UCHIME version 4.2.40 (Citation33) and removed (Citation34). The sequences were clustered in operational taxonomic units (OTUs) at 97% similarity as described previously (Citation30). The taxonomy of the representative sequence of each cluster was assigned using the SILVA rRNA database (Citation34). To further classify the OTUs at species level (Supplementary Table 1), the representative sequences of each OTU were manually aligned against the nucleotide collection using the Human Oral Microbiome Database (HOMD) (Citation35). This database includes approximately 700 curated sequences of oral taxa and allows deeper taxonomic resolution of certain taxa compared with the SILVA rRNA database that covers all bacterial ecosystems on Earth and includes over 5 million sequences, allowing detection of non-oral taxa. The sequence data were submitted to the short read archive at NCBI under BioProject ID PRJNA275963.
Data normalization and statistical analysis
Spectra were normalized to the amplitude and angle of inclination of the excitation peak (420–430 nm) using dedicated software (SP1, version 1.0.0.10; Inspektor Research Systems BV; zero compensation 330–380 nm). Biofilm spectra were analyzed using Gaussian curve fitting to assess separate fluorescence peaks for peak wavelength, amplitude, and full width at half maximum. Spectra from plugs of Teflon and dentin without biofilm were used as references in the curve-fitting procedure. Spectra (Supplementary Fig. 1) of biofilms grown on Teflon or dentin substrates were not compared directly, as the green fluorescence of dentin rendered such a comparison impossible.
The correlations of the peak amplitudes at different wavelengths with biofilm age and thickness or lesion depth and mineral loss were assessed using the Spearman rank correlation test. The combined results from the experiment were calculated without the second 600 µm thick biofilm (per pan) to avoid disproportionate outcomes. Differences between the two sucrose groups were tested with the Mann–Whitney U test.
All microbiome data were subsampled to an equal number of reads per sample. The OTU abundances were log 2 transformed to normalize the data distribution for principal component analysis (PCA) using PAST (PAleontological STatistics) version 3.01 (Citation36). Only OTUs present in more than two samples (inoculum not considered) and simultaneously present more than three times per sample were included in the analyses. The Shannon diversity index was calculated in PAST. This index takes into account the abundance of each OTU as well as the number of OTUs in the samples. Normal distribution of the OTUs was assessed using the Shapiro–Wilk test. SIMPER analyses (Citation37) were performed to calculate the average dissimilarity between groups. Two-way PERMANOVA (permutational multivariate analysis of variance) analyses were performed to calculate the significance of the composition differences by time and sucrose frequency. Correlations between the amount of red fluorescence and the individual OTUs were assessed using the Spearman rank correlation test. To test for comparability between samples with the same condition at the same point in time, the Wilcoxon signed rank test was used. P-values <0.05 were considered statistically significant. Correlations were considered relevant when Spearman's rho was >0.70 or<−0.70. Statistical analyses were performed using IBM SPSS Statistics v. 22, except from the two-way PERMANOVA and SIMPER analyses, which were performed using PAST.
Results
Biofilms covered the entire plug 3 days after inoculation (visual assessment). Although only green fluorescence was detectable by visual assessment after 4 days, the spectrophotometer did detect a small peak in the red area of the spectrum. From day 7 onward, red fluorescence was detectable by both spectrophotometer and visual assessment on QLF photographs. The red fluorescence had peaks at 620, 635, 655, and 685 nm, with the highest amplitude at 635 nm, measured with the spectrophotometer (Supplementary Fig. 1). To confirm the spectral results, all samples were also assessed using the QLF camera. The visual results confirmed the agreement between these two methods for fluorescence assessment (a and b).
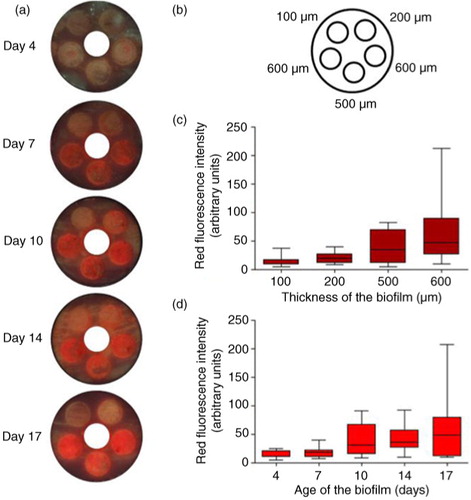
Fig. 2 The effects of biofilm thickness and age on red fluorescence, biofilm grown on Teflon. (a) Example of one CDFF pan per time point (screw thread for pan removal covered), (b) different depth settings of the plugs. (c) Intensity of red fluorescence (peak amplitudes for the different peak wavelengths within the red area of the spectrum) in arbitrary units per biofilm thickness. (d) Intensity of red fluorescence (peak amplitudes for the different peak wavelengths within the red area of the spectrum) in arbitrary units per biofilm age.
Biofilm thickness – experiment 1
Although red fluorescence intensity correlated with biofilm thickness (c; all time points: r s =0.68, p<0.001), this correlation was not linear. A correlation between red fluorescence and thickness per time point was present from day 10 onward.
Biofilm age – experiments 1 and 2
The red fluorescence of the biofilms also correlated with the age of the biofilms, but again not linearly (d and 3). This was the case with the Teflon substrate (r s =0.50; p<0.001, taken all groups together, a) as well as for the dentin substrate (r s =0.68; p<0.001 (both sucrose groups together); r s =0.59; p<0.001 (three times-a-day sucrose group), and r s =0.63; p<0.01 (eight times-a-day sucrose group)).
Cariogenicity – experiment 2
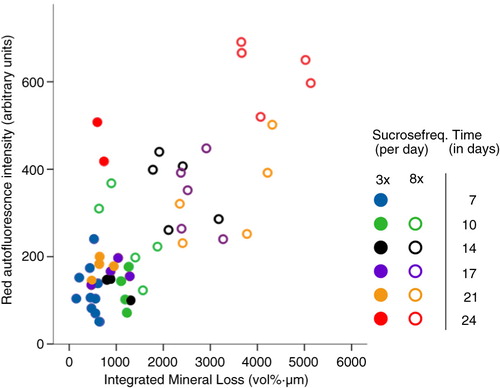
Red fluorescence in the eight times-a-day sucrose group was significantly higher when compared with the three times-a-day sucrose group (p=0.031). The red fluorescence of the biofilms showed a significant correlation with the mineral loss of the dentin (r s =0.58, p=0.019, ). While this mineral loss increased over time in the eight times-a-day sucrose group, it did not increase after 10 days in the three times-a-day sucrose group (). Biofilm red fluorescence correlated with both mineral loss and lesion depth in the eight times-a-day sucrose group (r s =0.82, p=0.02 and r s =0.86, p=0.01) but not in the three times-a-day sucrose group (r s =−0.07, p=0.87 and r s =−0.03, p=0.93).
Fig. 3 The effect of sucrose frequency on mineral loss and red fluorescence. Mineral loss from dentin plotted against intensity of red fluorescence (total amount of peaks within the red area of the spectrum) in arbitrary units. Biofilm age is indicated with different colors for the three times-a-day sucrose group (closed circles) and the eight times-a-day sucrose group (open circles). Remarkable is the increase in red fluorescence intensity at day 24 (red circles) in both groups. The thickness of all biofilms was 600 µm.
Biofilm composition – experiment 2
To relate the fluorescence outcomes with the composition and diversity of the samples, 454-pyrosequencing of the 16S rDNA amplicons was performed. The samples had on average 2,826 reads per sample (SD 272). After subsampling using 2,330 reads per sample, 67 OTUs remained in the data set with an average of 30 OTUs per sample (Supplementary Table 1). Overall, the sequencing results were classified into seven phyla, with Firmicutes (62%) and Fusobacteria (23%) dominating the data, followed by Proteobacteria (8%), Bacteroidetes (4.2%), Actinobacteria (2.4%), Candidate division TM7 (0.1%), and Cyanobacteria (0.02%).
The Shannon diversity index did not correlate with the time of sampling (r s =−0.16; p=0.55) or with the red fluorescence intensity (r s =−0.006; p=0.98). The diversity index did not differ between the two sucrose groups (p=0.35). From all OTUs, 15 were present in the original inoculum but did not appear in the biofilm samples, especially the species Rothia mucilaginosa (OUT nr 41) appeared in a high percentage in the inoculum and not in the biofilm samples.
The relative abundance of OTUs classified as Atopobium parvulum (r s =0.75, p=0.001, OUT nr 10), Cryptobacterium curtum (r s =0.70, p=0.002, OUT nr 36), a Capnocytophaga species (r s =0.70, p=0.003, OUT nr 40), and an unnamed cultivated taxon of Selenomonas correlated positively (r s =0.72, p=0.002, OUT nr 7) with the amount of red fluorescence. The OTUs classified into the species Klebsiella pneumonia (r s =−0.82, p<0.001, OUT nr 63), Haemophilus parainfluenzae (r s =−0.83, p<0.001, OUT nr 2), Candidate division TM7 (r s =−0.74, p=0.001, OUT nr 58), and Gemella sanguinis (r s =−0.73, p=0.001, OTUnr 50) correlated negatively with the amount of red fluorescence.
The relative abundance of OTUs classified as species Streptococcus mutans (r s =0.85, p<0.001, OUT nr 27), Actinomyces odontolyticus (r s =0.83, p<0.001, OUT nr 48), and Streptococcus salivarius (r s =0.73, p=0.001, OUT nr 42) correlated positively with the mineral loss while the OTUs classified into the species Neisseria subflava (r s =−0.75, p<0.001, OUT nr 49) and Fusobacterium nucleatum ss polymorphum (r s =−0.73, p=0.001, OUT nr 53) correlated negatively with the mineral loss.
The composition of the biofilms changed significantly over time (p=0.0001) and with the sucrose frequency (p=0.0001), although no significant interaction was found between the two variables (p=0.52). The overall average dissimilarity between the different biofilm age groups was 16–24% and between the two sucrose groups was 17%.
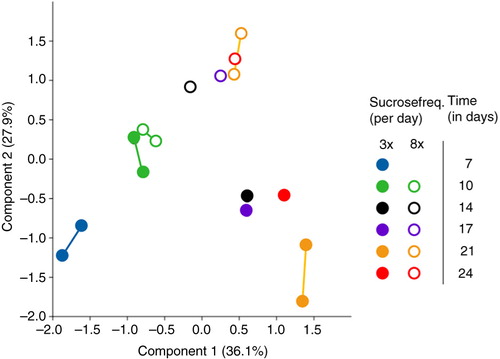
The microbiome profile data were ordinated by applying PCA (). The first component (PC1, x-axis) explained 36.1% of the variance among the samples and showed a separation of the samples in time. Shifts on the x-axis to the right were related to the OTUs classified into species Leptotrichia sp. oral taxon 215 (OUT nr 24), Prevotella melaninogenica (OUT nr 33), Capnocytophaga sp. oral taxon 336 (OUT nr 40), Mogibacterium diversum (OUT nr 51), and Atopobium parvulum (OUT nr 10). Shifts on the x-axis to the left were related to the species Haemophilus parainfluenzae (OUT nr 2) and Streptococcus orali (OUT nr 13). The second component (PC2, y-axis) explained a further 27.9% of the variance and displayed a separation of the samples by sucrose frequency (starting after day 10). Shifts on the y-axis in the upper direction were related to the OTUs classified into the species Streptococcus mutans (OTU nr 27) and Streptococcus salivarius (OUT nr 42), Atopobium parvulum (OUT nr 10), and Actinomyces odontolyticus (OUT nr 48). Shifts on the y-axis to the lower direction were related to the species Neisseria subflava (OUT nr 49), Leptotrichia sp. oral taxon 215 (OUT nr 24), Haemophilus parainfluenzae (OUT nr 2), and F. nucleatum ss polymorphum (OUT nr 53). The extra samples from the same conditions from different plugs/pans did not significantly differ from each other (p>0.05; Supplementary Table 2), except for the samples at day 21 in the three times-a-day sucrose group (p=0.02; Supplementary Table 2).
Fig. 4 Principal component analysis (PCA) plot of microbiome samples from all time points. The drawn lines link two samples from the same condition group: at day 7 between different pans, at day 10 and 21 within one pan. Biofilm age is indicated with different colors for the three times-a-day sucrose group (closed circles) and the eight times-a-day sucrose group (open circles). The thickness of all biofilms was 600 µm.
Discussion
The results from this study show that an increase in either the thickness or the cariogenicity or the age of a biofilm leads to a higher intensity of red fluorescence. These findings support our hypothesis that a thicker, more cariogenic or older plaque produces a higher intensity of fluorescence than a young, and presumably ‘healthy’, dental plaque. A clear shift in the microbial composition was observed in time and between different sucrose frequencies.
Our results imply that after a certain time of biofilm formation, its red fluorescence is determined less by biofilm age and that other variables such as biofilm thickness and cariogenicity play a more important role in the production of fluorophores since the effect of biofilm age on fluorescence was not linear. Red fluorescence was observed from day 7 onward, after which the fluorescence stabilized over time, with an increase on the last day of sampling (day 24). This increase correlated with an increase in mineral loss in the eight times-a-day sucrose group. In the three times-a-day sucrose group, the amount of red fluorescence remained stable after 7 days until the increase at day 24. The striking increase in fluorescence at day 24 (in both groups) cannot be fully explained since the composition of the biofilms at day 24 did not show remarkable changes compared with day 21. The amount of fluorescence for the eight times-a-day sucrose group is in line with the measured mineral loss, confirming an association between fluorescence and cariogenicity.
To test if the sudden change in red fluorescence at 24 days is related to a change in, for example, porphyrin gene expression, rather than the presence or absence of microbial species, an object of future study could be to study the composition and transcriptomics of dental plaque samples with varying intensities of red fluorescence. Alternatively, the transcriptomics of in vitro microcosm biofilms could be studied where the biofilms are grown under different and controlled conditions. These types of studies could give interesting new insights in red fluorescent plaque, since currently there is no proof as to which genes are involved in this phenomenon.
The relationship between the cariogenicity of a microcosm biofilm and red fluorescence was previously reported by Lee et al. (Citation14). However, biofilm thickness was not reported in this study (Citation14), although by controlling the biofilm thickness we did find a separate effect from biofilm thickness on its fluorescence. The found relationship between the age of the biofilm and its fluorescence confirms the recent findings of a microcosm biofilm study from Kim et al. (Citation19) and from an in situ study of Bittar et al. (Citation20). Neither study analyzed the microbial composition in its full width, while our results show that the composition of biofilms shifted due to aging and different sucrose conditions.
Due to the used sequencing methodology, more in-depth insight of the composition of the grown biofilms could be given. However, caution should be taken when extrapolating the outcomes from this study for explaining biofilm fluorescence since OTUs do not necessarily represent a single bacterial species.
From our results, we can conclude that all OTUs that correlated positively with the amount of red fluorescence belonged to either anaerobic or CO2-dependent genera, while the negatively correlating OTUs are known as facultative anaerobes or aerobes except for Gemella sanguinis which is CO2 dependent and Candidate division TM7 which grows under anaerobic conditions. Interestingly, the assumed unculturable taxon Candidate division TM7 was recently cultured by two separate research groups (Citation38, Citation39). This bacterial phylotype is frequently identified when oral samples are sequenced (Citation40, Citation41). As matured plaque contains more anaerobic bacteria (Citation42), the finding that anaerobes correlated positively with the amount of red fluorescence is in agreement with the assumption that red fluorescence comes from matured plaque. In this study, different species correlated with fluorescence of plaque and mineral loss, indicating that this may relate to two independent processes that occur simultaneously in these biofilms. As shown, red fluorescence of biofilm is related to age and thickness of the biofilm, while it also correlates to mineral loss resulting from prolonged exposure to cariogenic circumstances. These circumstances may affect biomass (Citation43), which may explain the increase in red fluorescence.
We did not find a correlation between the diversity of the biofilms and the amount of red fluorescence. The disappearance of the species Rothia mucilaginosa (a gram-positive coccus and a commensal bacterium from the oral cavity) after inoculation with the saliva from one donor could be explained by the different conditions in a biofilm model compared with the oral cavity.
Future research could include culturing the species which are related to the OTUs that correlated positively with the amount of red fluorescence as well as studying the metabolism of these species. For Capnocytophaga species, selective culture media have been described (Citation44) and Atopobium parvulum as well as several Selenomonas species are also culturable. It is, however, questionable whether the observed red fluorescence is associated with single species. It has been suggested previously that fluorescence is more associated with a certain condition of the biofilm where a number of species interact (Citation10).
The pH of the biofilm presumably affected the fluorescence of biofilms, since the biofilms grown on dentin fluoresced more intense red than the biofilms grown on Teflon under similar growth conditions. Dentin has been shown to work as a buffer for biofilm during growth (Citation45, Citation46). It has been shown that it takes possibly up to 5 h before the biofilm pH recovers to a neutral pH when grown on dentin in a CDFF model (Citation46). This delay of pH recovery could be comparable with the clinical situation of a pH drop in approximal plaque after a cariogenic challenge. In this experiment, we did not measure biofilm pH because of the risk of contamination of the samples. Since the fluorescence of porphyrins (the assumed fluorophores in the biofilm) decreases when the pH decreases (Citation47), it could be interesting for future research to perform pH measurements on biofilms and relate this to its fluorescence.
In this study, we used a single donor to inoculate the biofilm model. Using a single donor has its limitations; however, the biofilm model itself determines for the largest part which bacteria grow in an in vitro model. Studies on biofilms from different donors show very similar phenotypic characteristics after prolonged exposure to the same environmental conditions (Citation48), and the phenotype of the biofilm determines whether a microcosm biofilm fluoresces red rather than the presence of specific species (Citation10).
The fact that we did not find a correlation between biofilm age and red fluorescence for the thinnest biofilm might be explained either by the differences in structure or composition between thin and thick biofilms. Similarly, the thickness of biofilms was not linearly correlated with red fluorescence, possibly due to differences in biomass concentration (cell density) between the samples from the different experimental groups. Pratten et al. (Citation49) reported that structural differences in biofilms grown in a CDFF depended on both age of the biofilm and nutrients available.
The introduction of challenges associated with both high and low caries in this study by administering sucrose at two different frequencies resulted in a shift in the composition of the biofilms. The frequency of the use of sugar(s) in the diet is significantly related to the development of dental caries (Citation50). By adding sucrose in different frequencies, we disrupted the homeostasis and created biofilms with different cariogenic potential. The difference in cariogenicity between the two groups was reflected in the measured mineral loss of the dentin. With applying a resting period of 8 h in both sucrose groups, we mimicked the clinical situation which has a day and night rhythm with a recovery period during the night. The lack of a clear increase in demineralization of dentin over time after 7–10 days in the three times-a-day sucrose group was consistent with the literature (Citation51). In the eight times-a-day sucrose group, demineralization increased strongly over time. Both the three- and eight-times-a-day sucrose groups fitted the correlation between mineral loss and the amount of red fluorescence of the biofilms at each time point (), indicating a relationship between cariogenicity and biofilm red fluorescence.
The current study shows that a thicker, older, or more cariogenic biofilm results in a higher intensity of red fluorescence. The strongest and linear effect on fluorescence was related with the parameter of sucrose frequency. This influence of sucrose frequency on red fluorescence could clarify clinical results which are difficult to explain at first sight: in some individuals, the dental plaque fluoresces red after a few days, while in other patients it may take a prolonged time before fluorescing red. The rate of plaque formation as well as the diet of the patient differs per person, reflecting a different composition, thickness, and metabolism of the dental plaque. Together with differences in oral hygiene performances, red fluorescence could vary considerably per person in a clinical situation. Once a clinical relationship between red fluorescence and the caries risk of patients proves true, fluorescence assessment could be used to assess caries risk prior to caries lesion formation and when caries lesions exist, the risk of caries progression. Therefore, it would be interesting to perform clinical studies, alongside in vitro studies, to determine factors influencing red plaque fluorescence.
Conflict of interest and funding
This research was supported by the Dutch Technology Foundation STW (project number 10948) and Inspektor Research Systems BV, the Netherlands. The funders had no role in study design, data collection and analysis, decision to publish, or preparation of the manuscript.
Monique van der Veen is a co-inventor of several patents related to quantitative light-induced fluorescence. The authors declare that there is otherwise no conflict of interest pertaining to the data presented in this article.
Supplementary Material
Download MS Word (424.8 KB)Notes
To access the supplementary material to this article, please see Supplementary files under ‘Article Tools’.
Related Research Data
References
- WHO. World Health Organization: oral health fact sheet N°318. 2012. World Health Organization Media Centre. Available from: http://www.who.int/mediacentre/factsheets/fs318/en/ [cited 8 November 2015].
- Marsh PD. Microbial ecology of dental plaque and its significance in health and disease. Adv Dent Res. 1994; 8: 263–71. [PubMed Abstract].
- Selwitz RH, Ismail AI, Pitts NB. Dental caries. Lancet. 2007; 369: 51–9.
- Kolenbrander PE, Palmer RJ Jr., Periasamy S, Jakubovics NS. Oral multispecies biofilm development and the key role of cell-cell distance. Nat Rev Microbiol. 2010; 8: 471–80.
- Takahashi N, Nyvad B. The role of bacteria in the caries process. J Dent Res. 2011; 90: 294–303.
- Hope C, de Josselin de Jong E, Field M, Valappil S, Higham S. Photobleaching of red fluorescence in oral biofilms. J Periodontal Res. 2011; 46: 228–34.
- Coulthwaite L, Pretty IA, Smith PW, Higham SM, Verran J. The microbiological origin of fluorescence observed in plaque on dentures during QLF analysis. Caries Res. 2006; 40: 112–16.
- Heinrich-Weltzien R, Kuhnisch J, van der Veen M, de Josselin de Jong E, Stosser L. Quantitative light-induced fluorescence (QLF) – a potential method for the dental practitioner. Quintessence Int. 2003; 34: 181–8. [PubMed Abstract].
- Pretty IA, Edgar WM, Smith PW, Higham SM. Quantification of dental plaque in the research environment. J Dent. 2005; 33: 193–207.
- van der Veen MH, Thomas RZ, Huysmans MC, de Soet JJ. Red autofluorescence of dental plaque bacteria. Caries Res. 2006; 40: 542–5.
- König K, Hibst R, Meyer H, Flemming G, Schneckenburger H. Laser-induced autofluorescence of carious regions of human teeth and caries-involved bacteria. SPIE. 1993; 2080: 170–80.
- Thomas RZ, van der Mei HC, van der Veen MH, de Soet JJ, Huysmans MC. Bacterial composition and red fluorescence of plaque in relation to primary and secondary caries next to composite: an in situ study. Oral Microbiol Immunol. 2008; 23: 7–13.
- Bjurshammar N, Johannsen A, Buhlin K, Tranæus S, Östman C. On the red fluorescence emission of Aggregatibacter actinomycetemcomitans. Open J Stomatol. 2012; 2: 299–306.
- Lee E-S, Kang S-M, Ko H-Y, Kwon H-K, Kim B-I. Association between the cariogenicity of a dental microcosm biofilm and its red fluorescence detected by Quantitative Light-induced Fluorescence-Digital (QLF-D). J Dent. 2013; 41: 1264–70.
- König K, Schneckenburger H, Hibst R. Time-gated in vivo autofluorescence imaging of dental caries. Cell Mol Biol (Noisy-le-grand). 1999; 45: 233–9.
- Lennon AM, Buchalla W, Switalski L, Stookey GK. Residual caries detection using visible fluorescence. Caries Res. 2002; 36: 315–19.
- Shigetani Y, Takenaka S, Okamoto A, Abu-Bakr N, Iwaku M, Okiji T. Impact of Streptococcus mutans on the generation of fluorescence from artificially induced enamel and dentin carious lesions in vitro. Odontology. 2008; 96: 21–5.
- Claman DBL, Leys EJ, Griffen AL. Identification of red-fluorescing caries-associated bacteria. IADR/AADR/CADR 83rd General Session, Baltimore, MD, 9–12 March 2005.
- Kim Y-S, Lee E-S, Kwon H-K, Kim B-I. Monitoring the maturation process of a dental microcosm biofilm using the Quantitative Light-induced Fluorescence-Digital (QLF-D). J Dent. 2014; 42: 691–6.
- Bittar DG, Pontes LR, Calvo AF, Novaes TF, Braga MM, Freitas PM, etal. Is the red fluorescence of dental plaque related to its cariogenicity?. J Biomed Opt. 2014; 19: 065004.
- Simonsson T, Ronstrom A, Rundegren J, Birkhed D. Rate of plaque formation – some clinical and biochemical characteristics of “heavy” and “light” plaque formers. Scand J Dent Res. 1987; 95: 97–103. [PubMed Abstract].
- Pratten J. Growing oral biofilms in a constant depth film fermentor (CDFF). Curr Protoc Microbiol 2007. Chapter 1: Unit 1B 5.
- Deng DM, van Loveren C, ten Cate JM. Caries-preventive agents induce remineralization of dentin in a biofilm model. Caries Res. 2005; 39: 216–23.
- Wong L, Sissons C. A comparison of human dental plaque microcosm biofilms grown in an undefined medium and a chemically defined artificial saliva. Arch Oral Biol. 2001; 46: 477–86.
- Sissons CH. Artificial dental plaque biofilm model systems. Adv Dent Res. 1997; 11: 110–26.
- Volgenant CMC, van der Veen MH, de Soet JJ, ten Cate JM. Effect of metalloporphyrins on red autofluorescence from oral bacteria. Eur J Oral Sci. 2013; 121: 156–61.
- van Strijp AJ, Buijs MJ, ten Cate JM. Contact microradiography of dentine under wet conditions to prevent lesion shrinkage. Caries Res. 1995; 29: 107–10.
- Marsh PD. Dental plaque as a biofilm and a microbial community – implications for health and disease. BMC Oral Health. 2006; 6(Suppl 1): 14.
- Crielaard W, Zaura E, Schuller A, Huse S, Montijn R, Keijser B. Exploring the oral microbiota of children at various developmental stages of their dentition in the relation to their oral health. BMC Med Genomics. 2011; 4: 22.
- Kraneveld EA, Buijs MJ, Bonder MJ, Visser M, Keijser BJ, Crielaard W, etal. The relation between oral Candida load and bacterial microbiome profiles in Dutch older adults. PLoS One. 2012; 7: e42770.
- Koopman JE, Roling WF, Buijs MJ, Sissons CH, ten Cate JM, Keijser BJ, etal. Stability and resilience of oral microcosms toward acidification and Candida outgrowth by arginine supplementation. Microb Ecol. 2015; 69: 422–33.
- Reeder J, Knight R. Rapid denoising of pyrosequencing amplicon data: exploiting the rank-abundance distribution. Nat Methods. 2010; 7: 668.
- Edgar RC, Haas BJ, Clemente JC, Quince C, Knight R. UCHIME improves sensitivity and speed of chimera detection. Bioinformatics. 2011; 27: 2194–200.
- Pruesse E, Quast C, Knittel K, Fuchs BM, Ludwig W, Peplies J, etal. SILVA: a comprehensive online resource for quality checked and aligned ribosomal RNA sequence data compatible with ARB. Nucleic Acids Res. 2007; 35: 7188–96.
- Chen T, Yu W-H, Izard J, Baranova OV, Lakshmanan A, Dewhirst FE. The Human Oral Microbiome Database: a web accessible resource for investigating oral microbe taxonomic and genomic information. Database. 2010; 2010: 013.
- Hammer Ø, Harper D, Ryan P. PAST: paleontological statistics software package for education and data analysis. Palaeontol Electron. 2001; 4. Available from: http://palaeo-electronica.org/2001_1/past/past.pdf [cited 8 November 2015].
- Clarke KR. Non-parametric multivariate analyses of changes in community structure. Aust J Ecol. 1993; 18: 117–43.
- He X, McLean JS, Edlund A, Yooseph S, Hall AP, Liu SY, etal. Cultivation of a human-associated TM7 phylotype reveals a reduced genome and epibiotic parasitic lifestyle. Proc Natl Acad Sci USA. 2015; 112: 244–9.
- Soro V, Dutton LC, Sprague SV, Nobbs AH, Ireland AJ, Sandy JR, etal. Axenic culture of a candidate division TM7 bacterium from the human oral cavity and biofilm interactions with other oral bacteria. Appl Environ Microbiol. 2014; 80: 6480–9.
- Dewhirst FE, Chen T, Izard J, Paster BJ, Tanner AC, Yu W-H, etal. The human oral microbiome. J Bacteriol. 2010; 192: 5002–17.
- Iwai S, Fei M, Huang D, Fong S, Subramanian A, Grieco K, etal. Oral and airway microbiota in HIV-infected pneumonia patients. J Clin Microbiol. 2012; 50: 2995–3002.
- Kolenbrander PE, Palmer RJ Jr., Rickard AH, Jakubovics NS, Chalmers NI, Diaz PI. Bacterial interactions and successions during plaque development. Periodontol 2000. 2006; 42: 47–79. [PubMed Abstract].
- Klein MI, DeBaz L, Agidi S, Lee H, Xie G, Lin AH, etal. Dynamics of Streptococcus mutans transcriptome in response to starch and sucrose during biofilm development. PLoS One. 2010; 5: e13478.
- Ehrmann E, Jolivet-Gougeon A, Bonnaure-Mallet M, Fosse T. Antibiotic content of selective culture media for isolation of Capnocytophaga species from oral polymicrobial samples. Lett Appl Microbiol. 2013; 57: 303–9. [PubMed Abstract].
- Zaura E, Buijs MJ, ten Cate JM. The effects of the solubility of artificial fissures on plaque pH. J Dent Res. 2002; 81: 567–71.
- Deng DM, Buijs MJ, ten Cate JM. The effects of substratum on the pH response of Streptococcus mutans biofilms and on the susceptibility to 0.2% chlorhexidine. Eur J Oral Sci. 2004; 112: 42–7.
- Polo CF, Frisardi AL, Resnik ER, Schoua AE, Batlle AM. Factors influencing fluorescence spectra of free porphyrins. Clin Chem. 1988; 34: 757–60. [PubMed Abstract].
- Janus MM, Keijser BJ, Bikker FJ, Exterkate RA, Crielaard W, Krom BP. In vitro phenotypic differentiation towards commensal and pathogenic oral biofilms. Biofouling. 2015; 31: 503–10.
- Pratten J, Andrews CS, Craig DQ, Wilson M. Structural studies of microcosm dental plaques grown under different nutritional conditions. FEMS Microbiol Lett. 2000; 189: 215–18.
- Sheiham A, James WP. Diet and dental caries: the pivotal role of free sugars reemphasized. J Dent Res. 2015; 94: 1341–7.
- Deng DM, ten Cate JM. Demineralization of dentin by Streptococcus mutans biofilms grown in the constant depth film fermentor. Caries Res. 2004; 38: 54–61.