
Abstract
Background
It is well known that nutrient availability can alter the gut microbiota composition, while the effect on diversity and temporal stability remains largely unknown.
Methods
Here we address the equine caecal microbiota temporal stability, diversity, and functionality in response to diets with different levels of nutrient availability. Hay (low and slower nutrient availability) versus a mixture of hay and whole oats (high and more rapid nutrient availability) were used as experimental diets.
Results
We found major effects on the microbiota despite that the caecal pH was far from sub-clinical acidosis. We found that the low nutrient availability diet was associated with a higher level of both diversity and temporal stability of the caecal microbiota than the high nutrient availability diet. These observations concur with general ecological theories, suggesting a stabilising effect of biological diversity and that high nutrient availability has a destabilising effect through reduced diversity.
Conclusion
Nutrient availability does not only change the composition but also the ecology of the caecal microbiota.
To access the supplementary material for this article, please see Supplementary files under ‘Article Tools’
For mammals, the function and stability of the gastrointestinal (GI) microbiota are important for health and survival. The GI microbiota supplies the host with volatile fatty acids (VFAs) (Citation1, Citation2), modulates the host GI immune responses, and forms a barrier against invasion of pathogens (Citation3). It is well established that diet modulates the GI microbiota (Citation2), while our knowledge is limited with respect to how diet affects the functionality, stability, and diversity of the gut microbiota. A particularly intriguing unresolved question is how these factors are affected by postprandial nutrient availability.
The GI microbiota is crucial for efficient nutrient utilisation in equines, since up to 60% of the forage is digested by microbial fermentation – mostly occurring in the hindgut (Citation4, Citation5). The equine caecum is an enlargement of the hindgut, containing a highly complex microbial ecosystem mainly dominated by members of the bacterial phyla Firmicutes and Bacteroides (Citation6, Citation7). The effects of a single meal on the hindgut microbiota and fermentation pattern will be most significant in the caecum (Citation8).
Horse forage is commonly supplemented with whole oats to increase the energy intake. Whole oats consists of a core of easily fermentable starch that can partly be defined as resistant starch (Citation9–Citation11), since the starch-rich endosperm is encapsulated in a hull delaying the access of digestive enzymes to the starch (Citation12). Thus, if not entirely chewed, a part of the starch given in the oat diet will escape small intestinal digestion, being a source for rapid hindgut fermentation.
The aim of our work was to evaluate the effect of high and low available nutrient diets on the equine caecal microbiota function and stability. We did this in an in vivo experiment with horses fed hay (low and slower nutrient availability) or a hay/whole oats diet (high and more rapid nutrient availability). We used 16S rRNA gene deep sequencing and direct mixed sequencing for determining the microbiota composition in combination with measurements of VFA, NH3N, and pH for functional analyses of the caecum.
We present results showing that the high available nutrient diet reduces both the diversity and the temporal stability of the caecal microbiota. These results are discussed in the light of general ecological theories and potential health consequences.
Materials and methods
Horses, diets, and sampling
This experiment was conducted at the Norwegian University of Life Sciences. According to The Norwegian Regulation relating experiments in animals (1996-01-15 No.23), approval was not needed since the normal physiology of the horses was not affected during the experimental execution. However, the permanent caecum cannulation of the horses (four geldings of Norwegian Cold-blooded Trotter; age 4–14 years; BW 538±8 kg) has previously been approved by Norwegian Animal Research Authority (NARA) according to The Norwegian Regulation relating experiments in animals (1996-01-15 No.23). The horses were stabled in individual boxes (3×3m) bedded with wood shavings. Water was offered ad libitum from automatic bowls with individual flow meters (Gregen SPX – AxFlow). Water intake, body weight, and rectal temperatures were recorded each morning.
During the adaptation periods, all horses were daily exercised in an outdoor rotary exerciser (Kondi-Trainer, Jünck Maschinenbau, Borken, Germany) for 40 minutes at speeds varying in intervals from 2 m/s (walk) to 6 m/s (trot). During the periods of data collection, the horses were daily exercised in the evening on a high-speed treadmill (Haico, Loimaa, Finland) after having finished the caecal sampling. The treadmill was inclined to 3% and speed varied in intervals from 1.8 m/s (walk) to 4.2 m/s (fast trot).
The geldings were fed either hay or a mixture of hay and whole oats to meet the daily energy requirements in a crossover design of two consecutive 21-day experimental periods that included an adaptation period of 17 days to each diet.
The chemical composition of the timothy hay and whole oats used in the present experiment is presented in . The total daily rations were (H): 14.5 kg timothy hay, or (O): 6 kg timothy hay and 4.3 kg whole oats. The horses were fed at 06:00, 16:00, and 22:00 hours, and the morning meal consisted of (H): 4.5 kg timothy hay (equivalent to 0.15 g starch/kg BW), and (O): 2 kg timothy hay and 2 kg whole oats (equivalent to 1.68 g starch/kg BW). Thus, the morning meal of the H diet consisted of 81 g starch and 1,607 g neutral detergent fibre (NDF), whereas the morning meal of the O diet provided 904 g starch and 1,204 g NDF. At 16:00 the meals were (H): 5.0 kg timothy hay, and (O): 2.0 kg timothy hay and 1.2 kg whole oats. Similarly, at 22:00 the meals were (H): 5.0 kg timothy hay, and (O): 2.0 kg timothy hay and 1.1 kg whole oats.
Table 1 Chemical composition of the dietary components
Caecal fluid was collected 0, 1, 2, 3, 4, 5, 6, 7, 8, and 9 hours after the morning feeding. Each time series (10 samples) were collected from each horse in two repetitions on days 18 and 20 for both the first and second experimental period. Caecal samples for microbiota analyses were immediately conserved in ethanol (diluted 1:4 in ethanol) and stored at −20°C until extraction of DNA. Samples for NH3 and VFA analyses (9 ml) were immediately conserved in 1ml 12 M formic acid and stored at 4°C until analysis (). The first time series from Horse 1 fed the hay diet is suspected to be biased due to oxygen leakage through the silicone rubber plug that was sealing the caecal cannula; thus, these results were excluded from statistical analyses and results shown in and .
Chemical analyses and pH measurements
pH was measured directly in the caecum with a pH meter (WTW, pH 340i) attached to the horse with recordings taken every minute for 9 hours post-feeding. The pH electrode (Hamilton, Polyplast DIN 60, Bonaduz, CR, Switzerland) was inserted into the caecum lumen through the cannula. The cannula was sealed by a silicone rubber plug to avoid oxygen exposure. Chemical composition of hay and oats () was determined using standard methods for the European Community; dry matter (71/393/EEC), ash (71/250/EEC), and crude protein (Kjeldahl-N x 6.25; 93/28/EEC). Crude lipid was determined by extraction with petroleum ether in an Accelerated Solvent Extractor from Dionex (ASE200; Sunnyvale, CA, USA). Analysis of dietary starch and NDF was performed according to McCleary et al. (Citation13) and Mertens et al. (Citation14), respectively. All caecal samples were analysed for individual VFAs by gas chromatography using the PerkinElmer Autosystem (PerkinElmer Inc., Norwalk, CT, USA) with a Restek Stabilwax® column (Restek, Bellefonte, PA, USA) and NH3N by flow injection-analysis (Citation15) based on Tecator-method no. ASTN 22/89 (Foss Tecator AB, Höganas, Sweden).
DNA extraction
Template DNA was prepared from ethanol-conserved caecal fluid (2ml) followed by centrifugation at 13,000 rpm for 10 minutes at 8°C. The supernatant was removed, and the pellet resuspended in 2ml of solution 1 (50mM glucose, 25mM Tris-HCL pH 8.0, and 10mM EDTA pH 8.0). Next, 200 µl of the caecal fluid-suspension was diluted 1:4 in 4 M guanidinium thiocyanate (GTC), and 500 µl were transferred to a FastPrep® tube (Qbiogene Inc., Carlsbad, CA, USA) containing 250 mg glass beads (>106 microns, Sigma-Aldrich, Steinheim, Germany). The samples were homogenised for 40 seconds in the FastPrep® instrument (Qbiogene Inc.) before automatic DNA extraction. DNA isolation and purification were performed using an automated procedure with silica particles (Bioclone Inc., San Diego, CA, USA) as described earlier by Skånseng et al. (Citation16).
Direct sequencing
Primers used in the 16S RNA gene amplification reactions were forward primer 5′-TCCTACGGGAGGCAGCAGT-3′ (Tm, 59.4°C) and reverse primer 5′-GGACTACCAGGGTATCTAATCCTGTT-3′ (Tm, 58,1°C) (Citation17). The polymerase chain reaction (PCR) mixture contained 0.2 µM of each primer, 1 U DyNAzyme™ II Hot Start DNA polymerase, 1x Hot Start Buffer, 200 µM dNTP mix, and 5.0 µl DNA in a 25 µl PCR reaction. The amplification profile consisted of an initial step of 94°C for 10 minutes, followed by 30 cycles of 94°C for 30 seconds, 60°C for 30 seconds, and 72°C for 30 seconds, and a final extension at 72°C for 7 minutes. A universally conserved primer 5′-GTGCCAGCMGCCGCGGTA-3′ (Citation18) with C-tail extension (U515Fc30) consisting of 30 bases on the 5′-end was used for sequencing of mixed PCR products without prior cloning of samples. Automatic capillary electrophoresis of the sequence products was performed using the instrument ABI PRISM® 3100 Genetic Analyzer according to the manufacturer's instructions (Applied Biosystems, Foster City, CA, USA).
The mixed sequence spectra were resolved by Multivariate Curve Resolution – Alternating Least Squares (MCR-ALS; The Unscrambler X® software v10.1, CAMO Software Inc., Woodbridge Township, NJ, USA). Signature sequences obtained by direct sequencing and MCR-ALS were assigned to a hierarchical taxonomy using Seq Match in the Ribosomal Database Project II (www.rdp.cme.msu.edu/).
Deep microbiota pyrosequencing
Samples collected 0, 4, and 9 hours post-feeding were analysed by FLX-pyrosequencing. Pyrosequencing was targeted to a variable region of V4 in 16S rDNA (Citation18). The primers used for PCR amplification were 5′-ACTGGGCGTAAAGCG-3′ and 5′-GGATTAGATACCCTGGTA-3′. Their 5′-ends were flanked by specific adaptors, 5′ CCATCTCATCCCTGCGTGTCTCCGACTCAG -3′ (forward) and 5′-CCTATCCCCTGTGTGCCTTGGCAGTCTCAG-3′ (reverse). The PCR products were titrated and pyrosequencing was performed with a Genome Junior Sequencer system (Roche Diagnostics, Mannheim, Germany) by the microbial laboratory facility of Nofima (Ås, Norway).
Filtering analysis of sequencing data on each sample was conducted using OTUpipe available at the homepage of QIIME. OTUpipe is a pipeline script built using USEARCH (high-throughput biological sequence analysis) (www.drive5.com/usearch/) to perform filtering of noisy sequences, chimera checking (Citation19), and OTU picking (qiime.org/tutorials).
Ecological analysis
The resolved mixed sequences for all the time-points were used for the temporal stability analyses. We use a slight modification of the stability index described by Lehman et al. (Citation20) excluding the effect of biomass (Eq. 1).1
For the α-diversity analyses, we used the pyrosequencing data due to the higher taxonomic resolution. We used Simpsons index (Eq. 2) estimated at a 3% phylogenetic distance level.2
Simpsons indexes were chosen as measurement for diversity, because it takes into account both the number of species present (richness) as well as the relative abundance of each species (evenness) (Citation21, Citation22).
Results
Caecal physiology
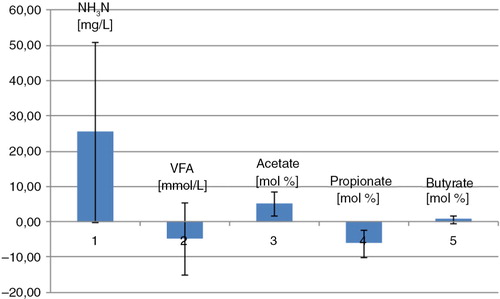
On average when horses were fed the oat diet, the caecal NH3N level was lower, the VFA level was higher, the acetate level was lower, and the propionate level was higher than in horses fed the hay diet ().
Fig. 1 Caecal VFA and NH3-N. Mean difference between the two diets. The barplot is illustrating the mean difference between the two diets in NH3N, VFA, acetate, propionate, and butyrate. Mean difference values above the zero line imply a higher mean value in the hay-fed horses than in whole oats–fed horses, whereas mean difference values under the zero line imply a lower mean value in the hay-fed horses than in whole oats–fed horses. Error bars represent standard deviations.
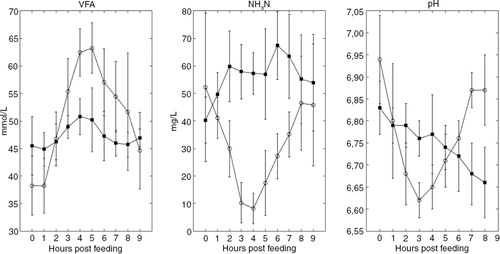
Horses fed the oat diet showed a prominent postprandial increase in the caecal VFA concentration 4 hours post-feeding, while in horses fed the hay diet the postprandial caecal VFA profiles showed only minor fluctuations (). The caecal NH3N concentration in horses fed the oat diet showed a decline 3 hours post-feeding, whereas the NH3N profiles in horses fed the hay diet were slightly increasing post-feeding (). For the caecal pH, there was a constant postprandial decrease for the hay diet, while there was an absolute minimum at 3 hours post-feeding for the oat diet (). There were, however, quite large individual differences (Supplementary Fig. 1).
Fig. 2 Caecal VFA and NH3-N. Temporal differences. Head titles indicate VFA, NH3N, and pH values. Caecal measurements related to the oat diet are marked with ◯, and caecal measurements related to a hay diet are marked with ■. Each time point represents mean values. Error bars represent standard deviations.
Microbiota composition
A total of 79,160 sequences were generated from the pyrosequencing, from which 38,949 were removed, mainly due to short sequence length (<200 bp) and mismatch in primer and barcode sequence. After filtration, the average sequence length was 218, and the number of sequences per sample ranged from 583 to 1,453, with a mean value of 957. A total of 757 OTUs were identified at the 3% distance level. The main caecal bacterial families were: Porphyromonadaceae (overall mean abundance was 27%), Prevotellaceae (9%), Lachnospiraceae (7%), Ruminococcaceae (7%), and Verrucomicrobiaceae (7%). At the phylum level, the most dominating phylums were bacteroides and firmicutes. Overall abundance of bacteroides was 65%, while the average abundance of firmicutes was 20%.
The mean dietary effect on difference in abundances was calculated, and only OTUs with significant dietary effect are shown in . In horses fed the oat diet, the caecal abundance of several bacterial families in the order of Bacteroidetes (Porphyromonadacae, unknown Bacteroidetes Cluster II), Veillonellaceae and several bacterial families in the order of Proteobacteria (Alcaligenaceae, Oxalobacteraceae, Deltaproteobacteria, and Succinivibrionaceae) increased (). In horses on the hay diet, the caecal abundance of several families inside the firmicutes phylum were higher than in horses fed the oat diet (Catabacteriaceae, Clostridiaceae, Lachnospiraceae, and Ruminococcaceae). In addition, the family Spirochaceae and several families inside the Tenericutes phylum (Spirochataceae, Erysipelotrichaceae, Anaeroplasmataceae, and unknown Tenericutes) also showed increased abundances in the caecum of horses fed the oat diet.
Fig. 3 OTU's. Mean difference between the two diets. Bar plot illustrating the mean difference between the two diets in abundances of bacterial representatives of the phyla: Bacteroidetes, Firmicutes, Proteobacter, Spirochaetes, and Tenericutes. Bacterial representatives with mean difference values above the zero line imply that they showed a higher mean abundance in the hay-fed horses than in whole oats–fed horses, whereas bacterial representatives with mean difference values under the zero line imply that they had a higher mean abundance in the whole oats–fed horses. Bacterial representatives marked with a star (*) means that the OTUs were not identified down to the family level. Error bars represent standard deviations.

Microbiota stability and diversity
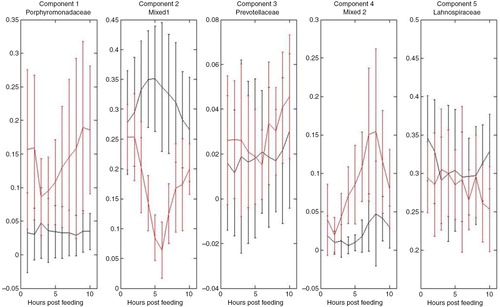
Direct sequencing and MCR of the mixed sequences, identified three main caecal bacterial groups at the family level (Porphyromonadaceae, Prevotellaceae, and Lachnospiraceae). Two resolved sequences represented mixed bacterial groups belonging to the phylum Proteobacteria (Mixed Groups 1 and 2) but these could not be identified down to family levels (Supplementary Table 1; ).
Fig. 4 Postprandial microbial concentration profiles in caecum of horses fed the hay diet (black) and the oat diet (red). Estimated Multivariate Curve Resolution (MCR) concentration profiles obtained PCR amplification of the variable V3 and V4 regions of 16S rRNA gene, direct sequencing, and automatic capillary electrophoresis. Main resolved bacterial groups of the mixed sequences at the family level were Porphyromonadaceae, Prevotellaceae, and Lachnospiraceae. Two of the components (Mixed 1 and 2) could not be resolved at a family level, but belong to the phylum Proteobacter. Error bars represent standard deviations.
For the stability analyses, we investigated the individual differences for each time point using the mixed sequence data. The reason why we did not use the pyrosequencing data for stability analyses is that we did not have complete time series. The mixed sequence data revealed both major individual and dietary differences (Supplementary Fig. 2). There was a statistically significant difference in the temporal stability index of the microbiota for the two diets, with the stability index being highest for the hay diet ().
Fig. 5 Community stability and diversity. (a) Stability index was calculated for each time series including the five resolved MCR components. Mean of community stability in caecum of horses fed a hay diet compared to horses fed an oat diet were significantly different (p<0.01). (b) Simpsons index was calculated for each sample and the mean value was calculated for each diet and found to be significantly different (p<0.01). Error bars represent standard deviations.
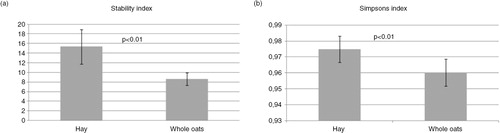
The α-diversity analyses were based on the pyrosequencing data due to the more complete coverage compared to the direct sequencing. We found that the hay diet had a statistically significant higher diversity of the microbiota compared to the oat diet ().
Discussion
Horses rely largely on high intake of fibre that can be fermented to VFAs, which in turn can be utilised as energy or for gluconeogenesis (propionic acid) by the host. To minimise digestive disturbances, it has been suggested that the amount of starch fed per meal should be limited to 1–1.5 g/kg BW (Citation23). However, considerable amounts of high starch ingredients (cereal grains) are often included in diets for high-performing horses. This can increase the risk of many diseases, including fermentative acidosis, laminitis, and colic (Citation24). The morning meal of the oat diet provided 1.68 g starch/kg BW, whereas the total daily oat ration provided 3.67 g starch/kg BW. Our data showed higher microbial fermentation activity in the caecum of horses fed the oat diet as compared to the hay diet (i.e. increased level of VFA, lower level of ammonia, and a rapid decline in pH post-feeding). These observations were in line with previous studies comparing caecal parameters in horses on a high starch versus a low starch diet (Citation8, Citation25–Citation27). However, the caecal pH did not go below 6.5 for any of the horses, thus, the temporal postprandial instability in the caecal microbial community structure was induced at a caecal pH far from sub-clinical acidosis (pH below 6) (Citation28). Thus the high nutrient availability diet (whole oats) in the present study caused only small variations in both microbial structure and functionality that returned to its original state 9 hours post-feeding.
Of the five main caecal bacterial families identified in the present study (Porphyromonadaceae, Prevotellaceae, Lachnospiraceae, Ruminococcaceae, and Verrucomicrobiaceae), four have recently been reported as members of the caecal core bacteria community by Dougal et al. (Citation29). The five most abundant bacteria that could be identified in all animals examined were Lachnospiraceae, Prevotellaceae, Erysipelotrichaceae, Ruminococcaceae, and Porphyromonadaceae (Citation29). Although Verrucomicrobiaceae was not identified as a core member of the caecal microbiota, several members of the order of Verrucomicrobia are frequently identified in the equine caecum and have also recently been reported to be more abundant in horses with chronic laminitis (Citation30). Erysipelotrichaceae and other members of the phylum Tenericutes were present in lower numbers in the present study, but with higher abundances in horses fed the hay diet.
The co-occurrence between the overrepresentation of the bacterial family Porphyromonadaceae and the high caecal concentration of propionate in horses fed the oats diet (i.e. high nutrient availability), can be explained by the fact that this family often has propionic acid as a main metabolic end product. Corroborating this is that it has recently been shown that members of this family do produce mainly propionic acid upon glucose metabolism (Citation31). For the diet low in available nutrients (hay diet), we found a combined overrepresentation of unclassified Clostridiales and acetate. Acetate production, however, is associated with a wide range of bacteria (Citation32), so it is difficult to pinpoint the actual producers in the horse caecum. In accordance with general ecological theory, it has been proposed that increased diversity has a community stabilising effect (Citation33). Our observation of a positive relationship between increased diversity and community stability is therefore in accordance with these theories. In addition, it has been demonstrated within a range of ecological communities that a high level of available nutrients initiates a higher level of inter specific competition favouring rapid growth and metabolic activity (Citation34). This is in contrast to a more complex environment with lower levels of available energy that is favouring microbial specialisation and niche differentiation (Citation35–Citation37). The increased fermentation activity, as observed by increased VFA level, decreased NH3H concentration and lower pH, support the hypothesis of a more rapid growth and metabolic activity, and increased inter special competition for the caecal microbiota.
Families belonging to the class Clostrida were overrepresented for the hay diet. Most of these, however, are poorly characterised, and it is thus difficult to deduce their role in the caecum. Interestingly, in sheep rumen the clotridial families Catabacteriaceaerum, Ruminococcus, and Lachnospiraceae have been associated with high methane emission (Citation38), suggesting an important role of these families in metabolism of feeds with low digestibility.
In conclusion, we found an increased abundance of Porphyromonadaceae in the equine caecal microbiota associated with a decreased acetate: propionate ratio in horses fed the oat diet as compared to a hay diet. Since horses with hindgut acidosis are more susceptible to laminitis and colic than those with a healthy hindgut environment, it is essential to study both the microbiota and the general hindgut physiology. Here we show that feeding different diets resulted in significant changes in both the caecal fermentation parameters and the bacterial microbiome. Large individual variation was observed, suggesting that bacterial populations may be influenced by other factors such as genetic background, age, and body condition, which were not taken into account in this study. Furthermore, we propose that the increased diversity and stability of the caecal microbiota in horses on the hay diet with low and slower nutrient availability can be explained by general ecological theories.
Conflict of interest and funding
The authors have not received any funding or benefits from industry or elsewhere to conduct this study.
Acknowledgements
We thank Tonje Marie Storlien and Inger Johanne Karlengen for valuable discussions and Signe Drømtorp for instructions regarding the practical work in the laboratory. Nofima is thanked for their financial support. Naja C. K. Hansen was supported by a PhD grant from the Norwegian University of Life Sciences, Ås, Norway.
Notes
To access the supplementary material for this article, please see Supplementary files under ‘Article Tools’
References
- Topping DL , Clifton PM . Short-chain fatty acids and human colonic function: roles of resistant starch and nonstarch polysaccharides. Physiol Rev. 2001; 81: 1031–64. [PubMed Abstract].
- Louis P , Scott KP , Duncan SH , Flint HJ . Understanding the effects of diet on bacterial metabolism in the large intestine. J Appl Microbiol. 2007; 102: 1197–208.
- Sekirov I , Russell SL , Antunes LCM , Finlay BB . Gut microbiota in health and disease. Physiol Rev. 2010; 90: 859–904.
- Stevens CE , Hume ID . Contributions of microbes in vertebrate gastrointestinal tract to production and conservation of nutrients. Physiol Rev. 1998; 78: 393–427.
- Hansen NCK , Mydland LT , Næsset JA , Austbø D , Måge I , Rudi K . Molecular diversity of the equine caecal microbiota and its correlation to postprandial fermentation metabolites: a preliminary approach. Acta Agric Scand A Anim Sci. 2013; 63: 208–16.
- Perkins GA , den Bakker HC , Burton AJ , Erb HN , McDonough SP , McDonough PL , etal. The equine stomach harbors an abundant and diverse mucosal microbiota. Appl Environ Microbiol. 2012; 78: 2522–32.
- Shepherd ML , Swecker WS , Jensen RV , Ponder MA . Characterization of the fecal bacteria communities of forage-fed horses by pyrosequencing of 16S rRNA V4 gene amplicons. Fems Microbiol Lett. 2012; 326: 62–8.
- Hintz HF , Argenzio RA , Schryver HF . Digestion coefficients, blood glucose levels and molar percentage of volatile acids in intestinal fluid of ponies fed varying forage-grain ratios. J Anim Sci. 1971; 33: 992–5.
- Englyst HN , Kingman SM , Cummings JH . Classification and measurement of nutritionally important starch fractions. Eur J Clin Nutr. 1992; 46(Suppl 2): S33–50.
- Cummings JH , Beatty ER , Kingman SM , Sabahn E . Digestion and physiological properties of resistant starch in the human large bowel. Br J Nutr. 1995; 75: 132–747.
- Kienzle E . Small-intestinal digestion of starch in the horse. Rev Med Vet-Toulouse. 1994; 145: 199–204.
- Morrison IN , Dushnicky L . Structure of the covering layers of the wild oat (Avena fatua) caryopsis. Weed Sci. 1982; 30: 352–9.
- Mccleary BV , Solah V , Gibson TS . Quantitative measurement of total starch in cereal flours and products. J Cereal Sci. 1994; 20: 51–8.
- Mertens DR , Allen M , Carmany J , Clegg J , Davidowicz A , Drouches M , etal. Gravimetric determination of amylase-treated neutral detergent fiber in feeds with refluxing in beakers or crucibles: collaborative study. J AOAC Int. 2002; 85: 1217–40.
- Ruzicka J , Hansen EH , Sons JW . Flow injection analysis. Second edition. 1988; New York: Wiley-Interscience publications. 464.
- Skånseng B , Kaldhusdal M , Rudi K . Comparison of chicken gut colonisation by the pathogens Campylobacter jejuni and Clostridium perfringens by real-time quantitative PCR. Mol Cell Probe. 2006; 20: 269–79.
- Nadkarni MA , Martin FE , Jacques NA , Hunter N . Determination of bacterial load by real-time PCR using a broad-range (universal) probe and primers set. Microbiology. 2002; 148: 257–66.
- Baker GC , Smith JJ , Cowan DA . Review and re-analysis of domain-specific 16S primers. J Microbiol Methods. 2003; 55: 541–55.
- Edgar RC , Haas BJ , Clemente JC , Quince C , Knight R . UCHIME improves sensitivity and speed of chimera detection. Bioinformatics. 2011; 27: 2194–200.
- Lehman CL , Tilman D . Biodiversity, stability, and productivity in competitive communities. Am Nat. 2000; 156: 534–52.
- Hunter PR , Gaston MA . Numerical index of the discriminatory ability of typing systems: an application of Simpson's index of diversity. J Clin Microbiol. 1988; 26: 2465–6.
- Lyons NI , Hutcheson K . A stopping rule based on Simpson's index of diversity. J Theor Biol. 1979; 77: 497–503.
- Geor RJ , Ellis AD , Longland AC , Coenen M , Miraglia N . Digestive strategy and flexibility in horses with reference to dietary carbohydrates. The impact of nutrition on the health and welfare of horses. 2010; Wagenen, The Netherlands: Wageningen Academic Publishers. 17–28.
- Dicks LMT , Botha M , Dicks E , Botes M . The equine gastro-intestinal tract: an overview of the microbiota, disease and treatment. Livestock Sci. 2014; 160: 69–81.
- Swyers KL , Burk AO , Hartsock TG , Ungerfeld EM , Shelton JL . Effects of direct-fed microbial supplementation on digestibility and fermentation end-products in horses fed low- and high-starch concentrates. J Anim Sci. 2008; 86: 2596–608.
- Julliand V , de Fombelle A , Drogoul C , Jacotot E . Feeding and microbial disorders in horses: Part 3 – Effects of three hay: grain ratios on microbial profile and activities. J Equine Vet Sci. 2001; 21: 543–6.
- Medina B , Girard ID , Jacotot E , Julliand V . Effect of a preparation of Saccharomyces cerevisiae on microbial profiles and fermentation patterns in the large intestine of horses fed a high fiber or a high starch diet. J Anim Sci. 2002; 80: 2600–9.
- Milinovich GJ , Trott DJ , Burrell PC , van Eps AW , Thoefner MB , Blackall LL , etal. Changes in equine hindgut bacterial populations during oligofructose-induced laminitis. Environ Microbiol. 2006; 8: 885–98.
- Dougal K , de la Fuente G , Harris PA , Girdwood SE , Pinloche E , Newbold CJ . Identification of a core bacterial community within the large intestine of the horse. PLoS One. 2013; 8: e77660.
- Steelman SM , Chowdhary BP , Dowd S , Suchodolski J , Janecka JE . Pyrosequencing of 16S rRNA genes in fecal samples reveals high diversity of hindgut microflora in horses and potential links to chronic laminitis. BMC Vet Res. 2012; 8: 231.
- Shkoporov AN , Khokhlova EV , Chaplin AV , Kafarskaia LI , Nikolin AA , Polyakov VY , etal. Coprobacter fastidiosus gen. nov., sp. nov., a novel member of the family Porphyromonadaceae isolated from infant feces. Int J Syst Evol Microbiol. 2013; 63: 4181–8.
- Macfarlane GT , Macfarlane S . Fermentation in the human large intestine: its physiologic consequences and the potential contribution of prebiotics. J Clin Gastroenterol. 2011; 45(Suppl): S120–7.
- Cooper TF , Beaumont HJE , Rainey PB . Biofilm diversity as a test of the insurance hypothesis. Microbiology. 2005; 151: 2815–16.
- Freilich S , Kreimer A , Borenstein E , Yosef N , Sharan R , Gophna U , etal. Metabolic-network-driven analysis of bacterial ecological strategies. Genome Biol. 2009; 10: R61.
- Cameron TC , Wearing HJ , Rohani P , Sait SM . Two-species asymmetric competition: effects of age structure on intra- and interspecific interactions. J Anim Ecol. 2007; 76: 83–93.
- Weiner J . Asymmetric competition in plant populations. Trends Ecol Evol. 1990; 5: 360–4.
- Freckleton RP , Watkinson AR . Asymmetric competition between plant species. Funct Ecol. 2001; 15: 615–23.
- Kittelmann S , Pinares-Patino CS , Seedorf H , Kirk MR , Ganesh S , McEwan JC , etal. Two different bacterial community types are linked with the low-methane emission trait in sheep. PLoS One. 2014; 9: e103171.