Abstract
Significant changes in Arctic systems are underway, which are attributed to global warming. An important example is reduction in snow and ice coverage due to intensified melting in many regions. Active microwave instruments are used to detect surface melt and freeze-up based on the high sensitivity of radar backscatter to liquid water in the snow. We monitor two snowmelt parameters, the annual total of melt days and the date of summer melt onset across the archipelago of Svalbard using microwave backscatter measurements from the Ku-band scatterometer SeaWinds onboard the QuikSCAT satellite. Our analysis covers a nine-year time span from 2000 to 2008. Meteorological data from synoptic and automatic weather stations at several locations in Svalbard are used to investigate climatologic controls on pattern and timing of snowmelt. Svalbard temperature and precipitation regimes are highly variable throughout the year due to the location of the archipelago within a zone that is characterized by the convergence of atmospheric fronts from the Arctic Ocean, Nordic seas and the Barents Sea. Accordingly, our results show pronounced regional and interannual variability in snowmelt dynamics. However, we do find a trend towards earlier summer melt onset and an increasing number of melt days per year over the nine-year period of study. Our findings agree with climate-model predictions that project increasingly warmer and wetter conditions in the Arctic.
Observational evidence of ongoing widespread changes in Arctic climate and environment has been accumulating over the last decades as summarized by Serreze et al. (Citation2000) among others. Documented changes include a warming of the troposphere (Alexandrov & Maistrova Citation1998), increase in glacier retreat (see Kaser et al. Citation2006 and references therein), decline in sea-ice extent (e.g., Johannessen et al. Citation1999; Stroeve et al. Citation2007; Comiso et al. Citation2008), decrease in snow-covered area (Groisman et al. Citation1994; Comiso Citation2006) and accelerated thawing of permafrost (Pavlov Citation1994; Osterkamp Citation2007). Melting land ice is expected to contribute significantly to sea-level rise over the 21st century (Church et al. Citation2001), and on a more local scale impact on the hydrological regime of rivers as well as on the freshwater flux to fjords (Hagen et al. Citation2003). Achieving a better understanding of natural fluctuations and developing ways to predict trends of glacier geometry and dynamics have become a major topic of current research activities. Monitoring the spatial and temporal variability of snow-cover melt is thereby important with respect to glacier surface-energy balance and melt-water runoff (Wiscombe & Warren Citation1980; Winther Citation1993).
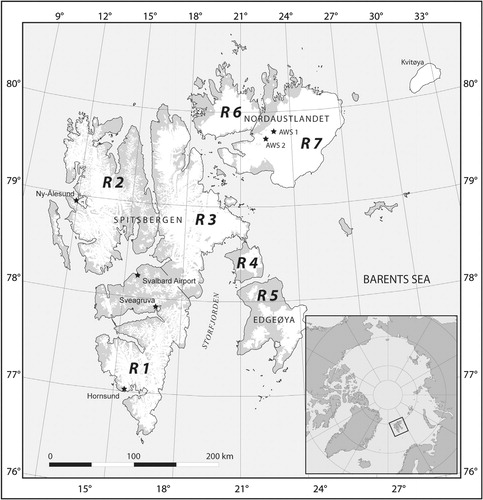
Here we focus on the archipelago of Svalbard, located in the North Atlantic sector of the Arctic Ocean from 74° to 81°N and 10° to 35°E (). The region is characterized by highly variable temperature and precipitation regimes throughout the year due to its position at the polar front, where warm and cold oceanic and atmospheric currents from the Arctic Ocean, Nordic seas and Barents Sea meet. The climate in Svalbard is relatively wet and mild for its latitude as a result of its maritime environment and heat provided from the North Atlantic (Hisdal Citation1985). The occurrence of melt events during winter is not unusual. The atmospheric circulation over Svalbard is determined by cold north-easterly polar winds from the Barents Sea frequently interrupted by passages of low-pressure systems from the south-west, drawing moist, maritime air northward. In consequence, there are both west–east and south–north gradients of snow accumulation and air temperature in Svalbard (Sand et al. Citation2003), onto which large year-to-year variations are superimposed (Førland & Hanssen-Bauer Citation2003). The distribution and size of glacier-covered areas (see ) reflect colder conditions in combination with higher winter accumulation rates in north-eastern regions than along the west coast and in central parts of Svalbard (Winther et al. Citation1998).
Fig. 1. Area of investigation: the archipelago of Svalbard between 74° and 81°N and 10° and 35°E, for the purpose of this study subdivided into regions R1–R7. About 60% (3.6×10⁴ km2) of the total land surface is glaciated with most continuous ice coverage to be found in north-eastern regions (R6 and R7). The location of automatic weather stations (AWS) on Nordaustlandet is shown.
With over 2200 glaciers and ice caps of various types and sizes (Hagen et al. Citation1993; Liestøl Citation1993), covering 60% of its land-mass, Svalbard offers an ideal study ground to observe the impacts of recent climate change on glacier mass balance. At present, however, in situ mass-balance measurements are only available for about 0.5% of Svalbard's glaciers. There are only a few long-term programmes, mostly operating along the better accessible west coast (Hagen & Liestøl Citation1990; Hagen et al. Citation2003). The need for complementary methods to capture spatial variability is evident. Over the last decades, satellite remote sensing has become a highly relevant tool for monitoring cryospheric parameters. Microwave instruments have shown their capacity for snowmelt detection based on their strong sensitivity to liquid water in the snowpack even when the snow surface is frozen (Stiles & Ulaby Citation1980; Koskinen et al. Citation1997; Ashcraft & Long Citation2006). Active microwave (i.e., radar) sensors were found to detect melt earlier and to be more sensitive to surface melt than passive microwave sensors (Forster et al. Citation2001; Steffen et al. Citation2004). The advantage of satellite radars is their ability to obtain data independent of daylight and unhampered by clouds. Scatterometers differ from other satellite radars in that they obtain data at a high temporal resolution, at the cost of coarser spatial resolution. Such instruments have been employed in previous studies to map annual melt extent and duration across major Arctic ice caps (Smith et al. Citation2003; Wang et al. Citation2005), the Greenland Ice Sheet (e.g., Wismann Citation2000; Nghiem et al. Citation2001; Steffen et al. Citation2004) or sea ice (Forster et al. Citation2001; Haarpaintner & Spreen Citation2007). Resolution enhancement by means of the scatterometer image reconstruction (SIR) algorithm (Early & Long Citation2001; Long & Hicks Citation2005) enables melt studies to be carried out at finer spatial scales, as demonstrated by Sharp & Wang (Citation2009), for example.
Following such approaches we aim at evaluating the potential of QuikSCAT enhanced resolution products (Long & Hicks Citation2005) for operational monitoring of melt–refreeze cycles and melt patterns over the entire ice-covered area of Svalbard. Since in Svalbard melt can occur at any time of the year even in winter, this study is not restricted to a specific summer melt period only. Instead, we register all detectable melt events and map the annual total number of melt days (ATMD). In addition, we identify the annual summer melt onset (SMO). To better assess spatial differences, the archipelago was subdivided into seven geographical regions (). Meteorological data from weather stations are used to validate the derived quantities at a local scale.
Data
The data employed in this study to evaluate and monitor Svalbard's snowmelt dynamics were acquired by the SeaWinds scatterometer operated onboard the QuikSCAT satellite since June 1999. The instrument uses a conically scanning active microwave system to collect normalized radar backscatter signatures (σo) of the Earth's surface at a frequency of 13.4 GHz (Ku-band). Measurements are carried out in both horizontal and vertical polarization with fixed incidence angles of 46° (inner beam over a 1400-km swath) and 54° (outer beam over a 1800-km swathe), respectively. Due to its orbit geometry and wide swathe, QuikSCAT provides coverage of polar regions multiple times a day. For our analysis we use daily composites; that is, combined σo-measurements from multiple orbit passes collected over the imaging period in the form of vertically polarized, slice-based SIR products with a nominal pixel resolution of 2225 km (estimated effective resolution ca. 4 km) (Long et al. Citation1993; Early & Long Citation2001; Long & Hicks Citation2005). These data are publicly available at http://www.scp.byu.edu (Long et al. Citation2001). Since snow is more likely to be melting later during the day, we base our analysis on evening images with effective measurement times between 1700 and 2100 LST for Svalbard.
Several meteorological data sets are available for calibrating and validating our melt detection scheme (). Local weather stations in Svalbard operated by the Norwegian Meteorological Institute provide continuous records of air temperature and precipitation over the entire period of observation, but are restricted to southern and western Spitsbergen (). These data are complemented by two automatic weather stations located on the Austfonna ice cap (R7) at 360 and 540 m a.s.l. (locations shown in ). The stations are maintained by the University of Oslo and record time series of air temperature and humidity, radiation components, wind speed and direction at hourly intervals since April 2004 (Schuler et al. Citation2007). In addition, two sonic rangers at the automatic weather stations measure surface displacement and thus provide a good indicator of melting. On a regional scale, we used model estimates of surface air temperature and circulation fields from the US National Centers for Environmental Prediction and US National Center for Atmospheric Research (NCEP/NCAR) Reanalysis data (Kalnay et al. Citation1996; Kistler et al. Citation2001), provided by the Physical Sciences Division of the National Oceanic and Atmospheric Administration's Earth System Research Laboratory in Boulder, Colorado.
Table 1. Meteorological data available for calibrating and validating the melt analysis of this study.
Melt detection
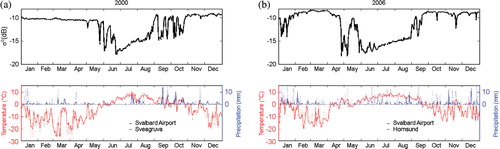
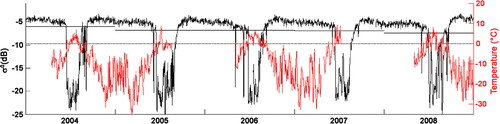
A pronounced backscatter contrast between dry and wet snow enables snowmelt detection using scatterometers (e.g., Nghiem & Tsai Citation2001; Steffen et al. Citation2004; Wang et al. Citation2005; Ashcraft & Long Citation2006; Wang et al. Citation2007; Sharp & Wang Citation2009). shows a nine-year time series (2000–08) of the average backscatter (σomean) from glacier-covered areas of two individual Svalbard regions compared to corresponding temperature records from local weather stations. Here, σomean varies over the course of a year between around −10 and −20 dB with highest and lowest values measured during freezing conditions in winter and during summer melt, respectively. A dry snowpack (i.e., at a temperature below 0°C) is easily penetrated by microwaves; backscatter contributions from surface scattering at the air/snow interface can therefore be neglected. From field measurements, Rott et al. (Citation1993) found the penetration depth to be around 8 m at a frequency of 10.3 GHz (X-band) for a dry winter snowpack. The intensive backscattering in winter is thus largely a function of volume scattering, i.e., multiple reflections of the radar waves on snow grains and internal layers within the snowpack (e.g., Stiles & Ulaby Citation1980). Regional differences as well as smaller temporal fluctuations in σomean arise from topography and variations in snowpack morphology, i.e., snow density, dielectric properties, internal layering, effective grain size and surface roughness (Rott et al. Citation1993; Long & Drinkwater Citation1994; Wismann & Boehnke Citation1997; Legrésy & Rémy Citation1998) as caused by fresh snow fall, snow compaction, grain growth, forming of sun or wind crusts or changes in snow temperature. For wet snow, which is highly absorptive for microwaves (Ulaby et al. Citation1982), volume scattering is absent due to the strongly reduced penetration into the snowpack (Mätzler & Hüppi Citation1989). Backscatter levels are therefore significantly reduced, as illustrated in . Here, the two σomean-time series show strong and sudden backscatter reductions whenever air temperatures exceed 0°C; that is, when liquid water forms as snow starts melting. Radar instruments are thus excellent tools to record onset, duration and spatial extent of snowmelt.
Fig. 2. Nine-year time series (2000–08) of the average backscattering (σomean) for all ice-covered areas within Region 1 and Region 2 (for boundaries see Fig. 1) compared to corresponding temperature records from local weather stations.
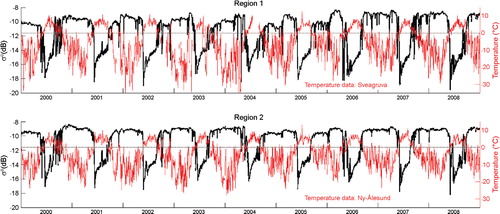
Characteristic seasonal backscatter variations for snow-covered areas of Svalbard can be summarized as follows: (1) relatively stable and high backscatter values during cold and dry winter conditions; (2) sharp backscatter reduction as snow starts melting in spring; (3) weak, but gradually increasing backscatter during the course of summer as the wet snow layer diminishes; (4) saw-tooth like frequent alternation of backscatter reduction and increase as snow melts and refreezes in consequence of temperature fluctuations around the melting point before cold winter conditions finally stabilize and the snowpack remains completely frozen.
For melt detection we use an empirical thresholding method that is commonly applied, for example, by Steffen et al. (Citation2004) and Sharp & Wang (Citation2009). To account for spatial variations in backscatter resulting from differences in snowpack morphology and topology, a dynamic σo-threshold (σoTr) was used. For this purpose, we first calculate the average winter backscatter σowm in dB for each image pixel from daily backscatter measurements over the January–March period. Liquid water is then assumed to be present within the snowpack when the local σo-value drops below c σowm. Based on available air temperature records from different locations in Svalbard, consecutive adjustment yields a factor of c=1.35 to achieve best agreement between detected melt days and observed temperatures >0°C over a wide span of local and regional differences in backscattering. The annual total number of melt days (ATMD) over glaciated regions of Svalbard is then mapped for the period 2000–08. In addition, a specific summer melt onset (SMO) was defined as the day of the year when σo first remained below σoTr for 10 or more consecutive days. In doing so, we distinguish SMO from earlier short-term melt events that cause significant backscatter fluctuations. Due to the sharp backscatter reduction as snow starts melting in spring (), SMO is not sensitive to smaller changes in c. Conversely, in autumn, when σo recovers slowly in a saw-tooth fashion the choice of c impacts somewhat on ATMD, depending on signal noise and slope as well as on glacier-surface type (bare ice, firn or snow) at the end of the melt season. From the examples in , we estimate ATMD to vary at most by +/− 6–7 days for a +/ − 10% modification of c. Results that differed clearly from neighbouring grid cells and/or showed unreasonably high or low values for ATMD/SMO were removed from further analysis.
Results
Spatio-temporal variability of melt patterns and melt anomalies
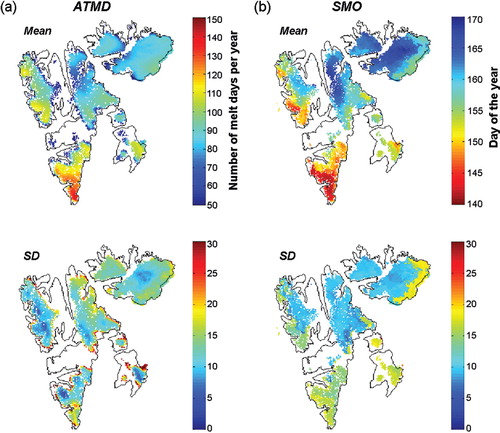
Applying the threshold-based melt detection approach described above, we mapped ATMD and SMO for the nine-year period 2000–08 (). Even though there is considerable year-to-year variability in the magnitude of ATMD and SMO, the general spatial melt pattern remains stable and reflects the climatic gradient across the archipelago. Warm currents keep the climate on the west coast of Svalbard relatively mild and free from sea ice during most of the year. In contrast, sea ice normally disappears from the eastern coast only late in the melt season. Accordingly, we generally find highest ATMD as well as earliest SMO in southernmost and western parts of Svalbard (R1 and R2 in a). On average, SMO occurs from south to north with an offset of about two weeks, between 28 May (day 148) in southern Spitsbergen (R1) and 12 June (day 163) in Nordaustlandet (R7). North-eastern regions R3, R6 and R7 experience a generally lower number of ATMD as well as a higher interannual variability in melt duration reflected by higher ATMD standard deviations (SD) plotted in . In general, the SD for SMO is larger in coastal areas, except in northern regions R3 and R6. Average SD values for the entire glacier-covered area of Svalbard with respect to the 2000-08 observation period are 12.0 days for SMO and 14.3 days for ATMD. The latter is consistent with findings of Sharp & Wang (Citation2009) in a similar study, which reported that summer melt varies by 13.2 days during 2000–04.
Fig. 3. Svalbard annual total number of melt days (ATMD) and summer melt onset (SMO).
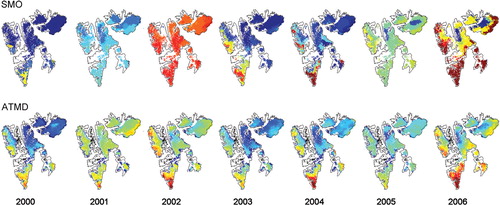
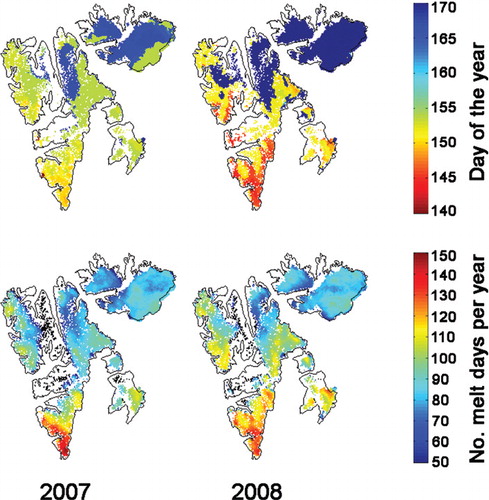
Fig. 4. Mean and standard-deviation patterns of (a) annual total number of melt days (ATMD) and (b) summer melt onset (SMO) with respect to the 2000–08 period of observation.
Annual anomalies (i.e., the difference between each annual value and the nine-year average) for ATMD and SMO are presented in . Longer-than-average melt during 2000–08 occurred in the years 2001, 2002 and 2006, whereas Svalbard was subject to a relatively low number of melt days in 2000 and 2003. Anomalies generally reach their largest positive and negative values in north-eastern Regions 6, 7 and 3. In 2006, however, melt dynamics deviated significantly from the average picture across the entire archipelago. Both, ATMD and SMO exceeded their normal span of annual fluctuations substantially, in particular in southern Svalbard and eastern coastal regions (Regions 1, 4 and 5). Here, summer melt commenced more than one month earlier than average, starting mid-May instead of mid-June. and summarize regional average ATMD and SMO values for each year from 2000–08.
Fig. 5. Svalbard annual total number of melt days (ATMD) and summer melt onset (SMO) anomalies relative to the 2000–08 average.
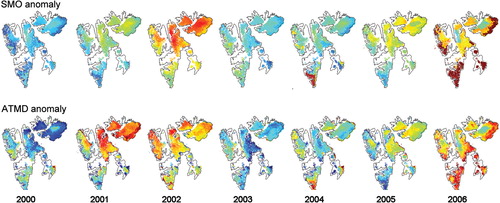
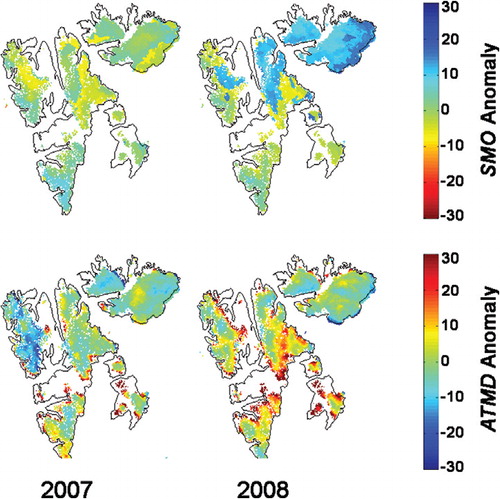
Fig. 6. Regional averages of (a) annual total number of melt days (ATMD) and (b) summer melt onset (SMO) from 2000 to 2008.
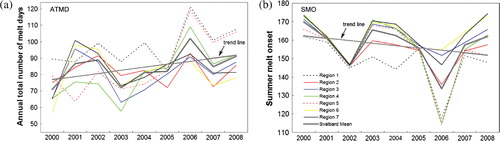
Table 2. Regional annual total number of melt days and summer melt onset from 2000 to 2008.
In spite of a considerable interannual variability in ATMD and SMO we observe an increasing number of melt days per year and a forward shift of summer melt onset for the observation period. However, a regression analysis indicates regional differences: southernmost and eastern regions R1, R4 and, in particular, R5 are mostly affected by increasing snowmelt (ATMD: R1 = 2.5 days a−1, R4 = 3.9 days a−1, R5 = 5 days a−1 and SMO: R1 = − 2.1 days a−1, R4 = − 2.4 days a−1, R5 = − 2.5 days a−1). R2 shows the lowest amplitude in year-to-year fluctuations and no clear trend; this is in accordance with R2 experiencing a relatively stable climate provided by the warm North Atlantic current to the west of Svalbard.
Extreme melt event in 2006
As described by Isaksen et al. (Citation2007), the early melt onset in May 2006 was preceded by a regional-scale temperature anomaly during winter and spring 2005–06. This temperature anomaly was associated with an unusual synoptic situation due to long periods of strong mild southerlies. January and April were the most striking months, when mean monthly air temperatures recorded at the Svalbard airport weather station were above the climatic average by more than 12°C. According to Isaksen et al. (Citation2007), the thermal response in permafrost was detectable to a depth of at least 15 m. shows the anomalous 2006 situation contrasted to the drier-than-average year 2000, in terms of σomean within a sample region (R1), and temperature and precipitation data available from local weather stations.
Fig. 7. Average QuikSCAT backscatter response for Region 1 in (a) 2000 and (b) 2006 compared to air temperature and precipitation data from local weather stations.
Above-freezing temperatures recorded in January and April 2006 coincided with significant precipitation events (likely rain) as humid, maritime air was brought in with low-pressure systems from the south-west. According to Winther (Citation2003), such events are characteristic for the climate in Svalbard throughout the year. In response, the intensive QuikSCAT winter-backscatter signal experiences several sudden and strong reductions as the temperature increased rapidly and the snow surface eventually reached melting conditions. During winter 2000, when temperatures remained below 0°C without interruption, precipitation events did not have such effect. From energy-balance modelling, Boike et al. (Citation2003) concluded that melting processes due to warm weather events occurring during the winter period are dominated by the sensible heat flux and heat supplied by rain.
Synchronous SMO
In some years (2001, 2002 and 2005), prominent synchronous melt onsets can be observed over wide areas of Svalbard (see ). These result likely from the advection of energy associated with the arrival of warm airflow, often accompanied by regional-scale rainfall. For example, we identify a synchronous SMO that occurred on 10 to 11 June 2001 (day 161/162) over the entire archipelago. NCEP/NCAR reanalysis data (Kalnay et al. Citation1996) indicate for this time an inflow of mild and moist air from the Barents Sea to the south-west, with temperatures rising to well above 0°C across Svalbard within only one day. The event is illustrated in , where a sharp and sudden reduction of σomean within all seven regions coincides with the arrival of the warm airflow (also apparent in b, a and ).
Fig. 8. Synchronous melt onset over all of Svalbard: (a) σomean-time series for seven Svalbard regions in 2001, and (b) US National Centers for Environmental Prediction and US National Center for Atmospheric Research (NCEP/NCAR) maps of air-temperature fields from 9 to 15 June 2001.
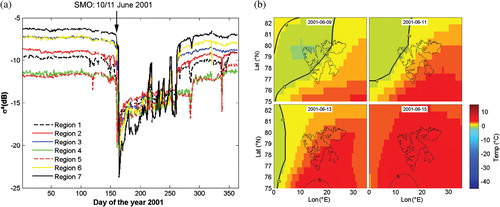
Fig. 9. Regional σomean as a function of elevation and time for all regions in (a) 2001, (b) 2006 and (c) from January 2000 to December 2008 in Region 3.
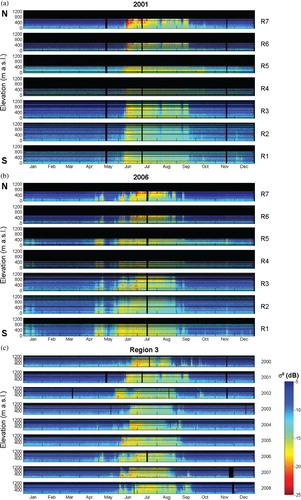
Apart from these events, altitude and latitude determine snowmelt onset to a large degree. However, we observe only a weak correlation between those parameters. In some years or some regions an expected gradual melt onset with altitude and latitude is entirely missing as illustrated in . Regional σomean backscatter values were computed for each elevation level and plotted over the course of a year. Warm colours represent low backscattering linked to melting snow, while cold colours correspond to high backscatter during freezing conditions. In a sudden backscatter reductions across all elevation levels and regions from north (top panel) to south (bottom panel) mark the archipelago-wide simultaneous SMO described above. The anomalously early SMO of April 2006 is clearly visible in b, followed by a colder period leading to an intermittent freeze-up in May. Subsequently, a second melt onset occurs gradually from south to north and from lower to higher elevations. Short-term melt events in January 2006 can also be identified in b, in particular regarding regions R1, R2 and R5. The generally high year-to-year variability in SMO and ATMD during 2000–08 is illustrated in c for a sample region (R3).
Case study Ny-Ålesund
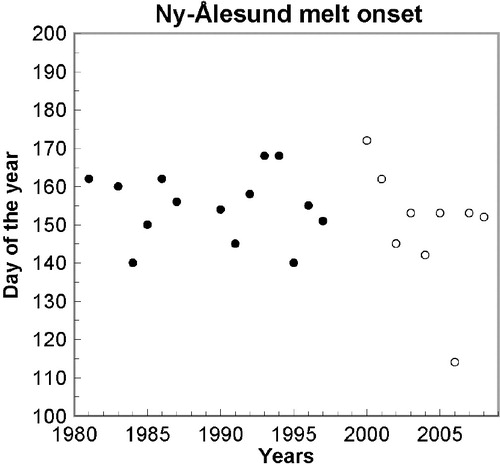
We examined the possibility for extending our findings backwards in time by combining QuikSCAT-derived SMO with melt onset dates derived from albedo studies at Ny-Ålesund (in Region 2) reported by Winther et al. (Citation2002) for a 17-year period from 1981 to 1997 (). At this location, SMO usually occurs within a one-month time-span between 20 May and 19 June. Within the combined 28-year record, the exceptional early SMO in 2006 (day 114 or 24 April) stands out clearly. The latest SMO occurred in 2000 (day 172, or 20 June). Contrary to other Svalbard regions, but in accordance with the conclusions of Winter et al. (2002), we see no significant trend in SMO at Ny-Ålesund. This seems reasonable, since Ny-Ålesund is located in the western coast of Svalbard and is, therefore, less affected by large scale sea-ice edge fluctuations due to relatively stable climate conditions provided by the North Atlantic current.
Fig. 10. SMO as derived from albedo studies (filled dots) presented by Winther et al. (2002), and from QuikSCAT backscatter signature (circles) at Ny-Ålesund.
Discussion
Our results generally agree well with a five-year record of melt-season anomalies presented by Sharp & Wang (Citation2009) for 2000–04. We extend these findings in time, analyse in more detail the regional differences in melt dynamics over Svalbard and use a wide range of ground truth data for validation. According to Benestad et al. (Citation2002), air temperatures in Svalbard are highly sensitive to the varying extent of sea ice surrounding the archipelago that impacts on both local albedo and heat transfer from the ocean back to the atmosphere. Consequently, the large interannual variability in melt onset and duration observed in this study can be attributed to year-to-year variations in sea-ice edge location. As in Sharp & Wang (Citation2009), we find anomalously early (late) summer melt onset and long (short) melt seasons associated with below (above) average concentrations of sea ice along the coast of Svalbard (e.g., Spreen et al. Citation2008). Northern and eastern coastal areas are most affected by sea-ice variability, so that we find highest standard deviations in ATMD and SMO for Regions 3, 6 and 7.
For instance in 2001, satellite observations (Fetterer et al. Citation2002) show that there was an unusually long open-water fraction in the ocean to the north of the archipelago, which coincided with a prolonged melt season in northern Svalbard. Here, sea ice only returned about a month later than on average at the end of September instead of August. In contrast, during shorter-than-average melt years (2000 and 2003) sea ice persisted along Svalbard's north-eastern coastline throughout most of the summer. Likewise, the remarkably early SMO anomaly in 2006 coincided with an unusually large extent of marine open water around Svalbard during winter, spring and summer 2005–06, which was unlike anything observed in previous low ice seasons.
Local sea-ice extent as a driving factor for interannual snowmelt fluctuations has been recognized elsewhere in the Arctic (e.g., Serreze et al. Citation2007). Hence, melt anomalies observed in nearby geographical regions need not be coherent. For example, in summer 2007 record melting was observed on the Greenland Ice Sheet (e.g., Tedesco et al. Citation2008) while rather normal conditions prevailed in Svalbard. Also, in 2001 a very low melt index observed over the Greenland Ice Sheet falls together with higher-than-average ATMD in Svalbard. Likewise, the unusually large extent of open water around Svalbard in 2006 caused anomalously high air temperature and related melt anomalies in Svalbard that have not been observed in other Arctic regions.
In addition to local annual variations in melt dynamics likely due to fluctuations of the sea-ice boundary, a general warming takes place in the Arctic associated with a well-documented decline in sea-ice extent taking place since at least 1978 (Johannessen et al. Citation1999). In Svalbard, warming is observed since 1960 (Førland & Hanssen-Bauer Citation2003), particularly for the spring months (Christensen et al. Citation2007). Kohler et al. (Citation2007) reported mean June–August temperature increasing by 0.17°C a−1 for the 10-year period 1997–2006. The forward shift of SMO and increasing ATMD from 2000 to 2008 that we find in this study for some regions are consistent with this observed warming. Given a relatively short observation period together with a high interannual variability in ATMD and SMO, observed trends are not statistically significant at normally quoted levels. They do, however, fit recorded warming and model predictions for Svalbard, as well as observed changes in sea-ice coverage around the archipelago.
Upon closer inspection, the melt maps presented in reveal an unusual melt pattern in 2000 when ATMD reaches significantly higher values in the upper part of the Austfonna (R7) ice cap than at its margins. Such a result seems unrealistic given that temperatures are usually inversely related to altitude and that climate gets colder and drier with distance to the moisture and heat source—the open ocean. Hence, we might face an artefact that points to a drawback of scatterometer-derived melt mapping such as carried out in this study. The area in question is situated within the long-term accumulation zone of the ice cap in which water-permeable firn remains at the glacier surface by the end of the melt season. Observations of summer firn temperatures close to 0°C in the upper part of Austfonna (Schuler unpubl. data) suggest that melt water is stored and can percolate within the near-surface firn. Due to the strong sensitivity of microwaves to liquid water, a moist firn may be detected even after air temperatures have dropped below 0°C and the firn surface is frozen. It is therefore questionable whether the end of the melt season can still be determined precisely on large ice caps using QuikSCAT. In contrast, impermeable bare ice further down-glacier is eventually exposed on the surface as melt progresses. Melt water penetrates via crevasses or moulins and disappears from the surface into deeper glacier regions (Paterson Citation1998). In autumn the ice-surface then dries out quickly as air temperatures fall below the freezing point. A dry and rough ice surface acts as a strong scatterer for microwaves, causing a quick recovery of σo to high winter values.
Consequently, the capability of firn to store water could cause a delay in backscatter recovery at the end of the melt season and result in an apparently higher number of melt days. When comparing to QuikSCAT measurements with temperature data available since 2004 from Austfonna summit (), a general delay in the recovery of QuikSCAT backscatter to high winter values due to water storage in the firn is not apparent. Instead, σo recovers quickly and exceeds the chosen dynamic threshold σoTr as soon as air temperatures fall below 0°C and vice versa. A suspected general overestimation of melt duration in firn areas cannot be confirmed. We are therefore not able to explain the unusual melt pattern in 2000 on Austfonna.
Fig. 11. Comparison of daily backscatter and air temperature measurements from 2004–08 at Austfonna summit. Horizontal lines mark σoTr in each year.
In similar studies, grid cells in which bare glacier ice is exposed during the melt season were removed from the analysis because freeze-up dates could not be detected reliably (e.g., Wang et al. Citation2007). When comparing to with air temperature measured at the automatic weather station and sonic ranger data from the ablation area on Austfonna ice cap, we do indeed find a significant increase in backscatter intensity as the wet snow cover thins and finally disappears during the melt season. However, we also still see a clear response to temperatures crossing the freezing point (). This shows that our basic melt-detection approach works correctly and freeze-up dates are detected reliably even in bare ice grid cells.
Fig. 12. Comparison of daily air temperatures and corresponding QuikSCAT-backscatter time series from 2004 to 2007 at the location of automatic weather station 1 (AWS 1) on Etonbreen, Austfonna. Vertical lines mark dates at which winter snow had disappeared and bare ice was exposed at the surface according to local sonic ranger measurements.
Summary and conclusions
With this study we map and analyse the spatio-temporal variability of snowmelt in Svalbard using QuikSCAT SIR images available for nine consecutive melt–refreeze cycles from 2000 to 2008. Results were validated by means of near-surface air temperature records from different locations around Svalbard. The sparse distribution of weather stations and measuring problems hamper analyses of climatic conditions in the Arctic (Førland & Hanssen-Bauer Citation2003). The use of remotely sensed data in this study permitted mapping the spatial variability of the investigated melt characteristics over the entire archipelago of Svalbard at high temporal and medium spatial resolution. Thus, we also capture the timing and geographical extent of short-lived melt events caused by transient temperature variations common for Svalbard even in winter as a consequence of influx of moist, mild air from the Norwegian and Barents seas. Hence, the study represents a valuable approach complementary to existing point measurements. Our method is based on publicly available QuikSCAT data and thus offers the possibility to operationally monitor melt characteristics.
Svalbard experiences highest ATMD connected to earlier SMO in its southernmost and western parts (R1 and R2), which is in accordance to the distribution of warm and cold oceanic currents flowing along the coastline of Svalbard. We find large year-to-year variability in melt onset and duration superimposed on a general warming trend, likely connected to annual fluctuations in local sea-ice extent and an overall sea-ice decline currently observed in the Arctic, respectively. Mostly affected are southern and eastern regions, while western Svalbard experiences relatively stable climate conditions provided by the North Atlantic current. Our findings agree well with a warming trend observed in Svalbard since 1960, as well as with climate-model results that predict increasingly warmer and wetter conditions in the Arctic (Kattsov & Walsh Citation2000; Førland & Hanssen-Bauer Citation2003; Christensen et al. Citation2007). From simultaneous SMOs in some years over larger areas of Svalbard, we conclude that summer melt is often initiated by the arrival of warm air flow and associated advection of energy, presumably accompanied by regional-scale rainfall. Thus, only for some years and/or some regions an expected gradual melt onset and shorter melt duration with increasing altitude is observed in our study. However, radar-based melt studies are limited to an assessment of timing and spatial extent rather than melt intensities. Nevertheless, the analysis demonstrates the potential of coarse resolution scatterometer data to trace consequences of a warming climate in Svalbard. Since QuikSCAT failed in November 2009, we plan to continue our melt monitoring in Svalbard based on follow-up missions like the Indian Oceansat-2 scatterometer and other missions to be launched in the future.
Acknowledgements
This study is part of the project Svalbard Ice Cores and Climate Variability, financed by the Norwegian Polar Institute and the Research Council of Norway, as well as the International Polar Year project GLACIODYN: the Dynamic Response of Arctic Glaciers to Global Warming financed by the Research Council of Norway. The authors also thank Dr D.G. Long and one anonymous reviewer for their careful revisions and comments on the manuscript.
References
- Alexandrov Y.I. Maistrova V.V. The comparison of the air temperature measurements for the polar regions. The Antarctica. 1998; 34: 60–72.
- Ashcraft I.S. Long D.G. Comparison of methods for melt detection over Greenland using active and passive microwave measurements. International Journal of Remote Sensing. 2006; 27: 2469–2488.
- Benestad R.E. Førland E.J. Hanssen-Bauer I. Empirically downscaled temperature scenarios for Svalbard. Atmospheric Science Letters. 2002; 3: 71–93.
- Boike J, Roth K. & Ippisch O. 2003. Seasonal snow cover on frozen ground: energy balance calculations of a permafrost site near Ny-Ålseund, Spitsbergen. Journal of Geophysical Research—Atmospheres. 108, 8163., 10.3402/polar.v30i0.5963.
- Christensen J. Hewitson B. Busuioc A. Chen A. Gao X. Held I, Jones R, Kolli R.K. Kwon W.T. Laprise R. Magaña Rueda V. Mearns L. Menndez C. Räisänen J. Rinke A. Whetton P. Regional climate projections. Climate change 2007. The physical science pasis. Contribution of Working Group I to the fourth assessment report of the Intergovernmental Panel on Climate Change. Solomon S. et al.. Cambridge University Press. New York, 2007; 849–940.
- Church J.A. Gregory J.M. Huybrechts P. Kuhn M. Lambeck K. Nhuan M.T. Qin D. Woodworth P.L. Changes in sea level. Climate change 2001. The scientific pasis. Contribution of Working Group I to the third assessment report of the Intergovernmental Panel on Climate Change. Houghton J.T. et al.. Cambridge University Press. Cambridge, 2001; 639–693.
- Comiso J. Arctic warming signals from satellite observations. Weather. 2006; 61: 70–76.
- Comiso J.C, Parkinson C.L, Gersten R. & Stock L. 2008. Accelerated decline in the Arctic sea ice cover. Geophysical Research Letters. 35, L01703., 10.3402/polar.v30i0.5963.
- Early D.S. Long D.G. Image reconstruction and enhanced resolution imaging from irregular samples. IEEE Transactions on Geoscience and Remote Sensing. 2001; 39: 291–302.
- Fetterer F, Knowles K, Meier W. & Savoie M. 2002. Sea ice index. BoulderCO: National Snow and Ice Data Center. Digital media. Accessed on the internet at http://nsidc.org/data/seaice_index/; updated 2007.
- Førland E.J. Hanssen-Bauer I. Past and future climate variations in the Norwegian Arctic: overview and novel analyses. Polar Research. 2003; 22: 113–124.
- Forster R.R. Long D.G. Jezek K.C. Drobot S.D. Anderson M.R. The onset of Arctic sea-ice snowmelt as detected with passive- and active-microwave remote sensing. Annals of Glaciology. 2001; 33: 85–93.
- Groisman P.Y. Karl T.R. Knight R.W. Stenchikov G.L. Changes of snow cover, temperature, and radiative heat balance over the Northern Hemisphere. Journal of Climate. 1994; 7: 1633–1656.
- Haarpaintner J. Spreen G. Use of enhanced-resolution QuikSCAT/SeaWinds data for operational ice services and climate research: sea ice edge, type, concentration, and drift. IEEE Transactions on Geoscience and Remote Sensing. 2007; 45: 3131–3137.
- Hagen J.O. Kohler J. Melvold K. Winther J.-G. Glaciers in Svalbard: mass balance, runoff and freshwater flux. Polar Research. 2003; 22: 145–159.
- Hagen J.O. Liestøl O. Long term glacier mass balance investigations in Svalbard 1950–1988. Annals of Glaciology. 1990; 14: 102–106.
- Hagen J.O. Liestøl O. Roland E. Jørgensen T. Glacier atlas of Svalbard and Jan Mayen. Norsk Polarinstitutt Meddelelser 129. Norwegian Polar Institute. Oslo, 1993
- Hisdal V. Geography of Svalbard. Norwegian Polar Institute. Oslo, 1985
- Isaksen K, Benestad R.E, Harris C. & Sollid J.L. 2007. Recent extreme near-surface permafrost temperatures on Svalbard in relation to future climate scenarios. Geophysical Research Letters. 34, L17502., 10.3402/polar.v30i0.5963.
- Johannessen O.M. Shalina E.V. Miles M.W. Satellite evidence for an Arctic sea ice cover in transformation. Science. 1999; 286: 1937–1939.
- Kalnay E. Kanamitsu M. Kistler R. Collins W. Deaven D. Gandin L. Iredell M. Saha S. White G. Woollen J. Zhu Y. Chelliah M. Ebisuzaki W. Higgins W. Janowiak J. Mo K.C. Ropelewski C. Wang J. Leetma A. Reynolds R. Jenne R. Joseph D. The NCEP–NCAR 40-year Reanalysis Project. Bulletin of the American Meteorological Society. 1996; 77: 437–471.
- Kaser G, Cogley J.G, Dyurgerov M.B, Meier M.F. & Ohmura A. 2006. Mass balance of glaciers and ice caps: consensus estimates for 1961–2004. Geophysical Research Letters. 33, L19501., 10.3402/polar.v30i0.5963.
- Kattsov V.M. Walsh J.E. Twentieth-century trends of Arctic precipitation from observational data and a climate model simulation. Journal of Climate. 2000; 13: 1362–1370.
- Kistler R. Kalnay E. Collins W. Saha S. White G. Woollen J. Chelliah M. Ebisuzaki W. Kanamitsu M. Kousky V. Van Den Dool H. Jenne R. Fiorino M. The NCEP–NCAR 50-year reanalysis: monthly means CD-ROM and documentation. Bulletin of the American Meteorological Society. 2001; 82: 247–267.
- Kohler J, James T.D, Murray T, Nuth C, Brandt O, Barrand N.E, Aas H.F. & Luckman A. 2007. Acceleration in thinning rate on western Svalbard glaciers. Geophysical Research Letters. 34, L18502., 10.3402/polar.v30i0.5963.
- Koskinen J.T. Pulliainen J.T. Hallikainen M.T. The use of ERS-1 SAR data in snow melt monitoring. IEEE Transactions on Geoscience and Remote Sensing. 1997; 35: 601–610.
- Legrésy B. Rémy F. Using the temporal variability of satellite radar altimetric observations to map surface properties of the Antarctic ice sheet. Journal of Glaciology. 1998; 44: 197–206.
- Liestøl O. Glaciers of Svalbard, Norway. Satellite image atlas of glaciers of the world: Europe. United States Geological Survey Professional Paper 1386-E. Williams Jr. R.S. Ferrigno J.G. US Geological Survey. Denver, 1993; E127–E151.
- Long D.G. Drinkwater M.R. Greenland ice-sheet surface properties observed by the Seasat-A scatterometer at enhanced resolution. Journal of Glaciology. 1994; 40: 213–230.
- Long D.G, Drinkwater M.R, Holt B, Saatchi S. & Bertoia C. 2001. Global ice and land climate studies using scatterometer image data. EOS, Transactions of the American Geophysical Union 82. , 503 and electronic supplement available at http://www.agu.org/eos_elec/010126e.html.
- Long D.G. Hardin P.J. Whiting P.T. Resolution enhancement of spaceborne scatterometer data. IEEE Transactions of Geoscience and Remote Sensing. 1993; 31: 700–715.
- Long D.G. & Hicks B.R. 2005. Standard BYU QuikSCAT/SeaWinds land/ice image products. ProvoUT: Brigham Young University. Accessed on the internet at http://www.scp.byu.edu/docs/pdf/MERS0504.pdf.
- Mätzler C. Hüppi P.S. Review of signature studies for microwave remote sensing of snowpacks. Advances in Space Research. 1989; 9: 253–265.
- Nghiem S.V. Steffen K. Kwok R. Tsai W.-Y. Detection of snow melt regions on the Greenland Ice Sheet using diurnal backscatter change. Journal of Glaciology. 2001; 47: 539–547.
- Nghiem S.V. Tsai W.-Y. Global snow cover monitoring with spaceborne Ku-band scatterometer. IEEE Transactions on Geoscience and Remote Sensing. 2001; 39: 2118–2134.
- Osterkamp T.E. 2007. Characteristics of the recent warming of permafrost in Alaska. Journal of Geophysical Research. 112, F02S02., 10.3402/polar.v30i0.5963.
- Paterson W.S.B. The physics of glaciers3rd edn. Elsevier. Oxford, 1998
- Pavlov A.V. Current changes of climate and permafrost in the Arctic and sub-Arctic of Russia. Permafrost and Periglacial Processes. 1994; 5: 101–110.
- Rott H. Sturm K. Miller H. Active and passive microwave signatures of Antarctic firn by means of field measurements and satellite data. Annals of Glaciology. 1993; 17: 337–343.
- Sand K. Winther J.-G. Maréchal D. Bruland O. Melvold K. Regional variations of snow accumulation on Spitsbergen, Svalbard, 1997–99. Nordic Hydrology. 2003; 32: 17–32.
- Schuler T.V. Loe E. Taurisano A. Eiken T. Hagen J.O. Kohler J. Calibrating a surface mass-balance model for Austfonna ice cap, Svalbard. Annals of Glaciology. 2007; 46: 241–248.
- Serreze M.C. Holland M.M. Stroeve J. Perspectives on the Arctic's shrinking sea ice cover. Science. 2007; 315: 1533–1536.
- Serreze M.C. Walsh J.E. Chapin F.S. Osterkamp T. Dyurgerov M. Romanovsky V. Oechel W.C. Morison J. Zhang T. Barry R.G. Observational evidence of recent change in the northern high-latitude environment. Climate Change. 2000; 46: 159–207.
- Sharp M. Wang L. A five-year record of summer melt on Eurasian Arctic ice caps. Journal of Climate. 2009; 22: 133–145.
- Smith L.C, Sheng Y, Forster R.R, Steffen K, Frey K.E. & Alsdorf D.E. 2003. Melting of small Arctic ice caps observed from ERS scatterometer time series. Geophysical Research Letters. 30, 2034., 10.3402/polar.v30i0.5963.
- Spreen G, Kaleschke L. & Heygster G. 2008. Sea ice remote sensing using AMSR-E 89 GHz channels. Journal of Geophysical Research—Oceans 113. C02S03., 10.3402/polar.v30i0.5963.
- Steffen K, Nghiem S.V, Huff R. & Neumann G. 2004. The melt anomaly of 2002 in the Greenland Ice Sheet from active and passive microwave satellite observations. Geophysical Research Letters. 31, L20402., 10.3402/polar.v30i0.5963.
- Stiles W.H. Ulaby F.T. The active and passive microwave response to snow parameters. 1. Wetness. Journal of Geophysical Research—Oceans. 1980; 85: 1037–1044.
- Stroeve J, Holland M.M, Meier W, Scambos T. & Serreze M.C. 2007. Arctic sea ice decline: faster than forecast. Geophysical Research Letters. 34, L09501., 10.3402/polar.v30i0.5963.
- Tedesco M. Serreze M. Fettweis X. Diagnosing the extreme surface melt event over southwestern Greenland in 2007. The Cryosphere Discussion. 2008; 2: 383–397.
- Ulaby F.T., Moore R.K. & Fung A.K. 1982. Microwave remote sensing active and passive. Vol. II. Radar remote sensing and surface scattering and emission theory. Reading: Addison-Wesley Publishing.
- Wang L, Sharp M.J, Rivard B, Marshall S. & Burgess D. 2005. Melt season duration on Canadian Arctic ice caps, 2000–2004. 32, L19502., 10.3402/polar.v30i0.5963.
- Wang L, Sharp M.J, Rivard B.& Steffen K. 2007. Melt season duration and ice layer formation on the Greenland ice sheet, 2000–2004. Journal of Geophysical Research—Earth Surface. 112, F04013., 10.3402/polar.v30i0.5963.
- Winther J.-G. Short- and long-term variability of snow albedo. Nordic Hydrology. 1993; 24: 199–212.
- Winther J.-G. Snow research in Svalbard—an overview. Polar Research. 2003; 22: 125–144.
- Winther J.-G. Bruland O. Sand K. Killingtveit Å. Maréchal D. Snow accumulation distribution on Spitsbergen, Svalbard, in 1997. Polar Research. 1998; 17: 155–164.
- Winther J.-G. Godtliebsen F. Gerland S. Isachsen P.E. Surface albedo in Ny-Ålesund, Svalbard: variability and trends during 1981–1997. Global and Planetary Change. 2002; 32: 127–139.
- Wiscombe W.J. Warren S.G. A model for the spectral albedo of snow. I. Pure snow. Journal of Atmospheric Sciences. 1980; 37: 2712–2733.
- Wismann V.R. Monitoring of seasonal snowmelt on Greenland with ERS scatterometer data. IEEE Transactions on Geoscience and Remote Sensing. 2000; 38: 1821–1826.
- Wismann V.R. & Boehnke K. 1997. Monitoring snow properties on Greenland with ERS scatterometer and SAR. European Space Agency Special Publication SP-414. 857–862.