Abstract
We describe the upper ocean thermal structure and surface nutrient concentrations between New Zealand and Antarctica along five transects that cross the Subantarctic Front, the Polar Front (PF) and the southern Antarctic Circumpolar Current (ACC) front. The surface water thermal structure is coupled with variations in surface nutrient concentrations, making water masses identifiable by both temperature and nutrient ranges. In particular, a strong latitudinal gradient in orthosilicate concentration is centred at the PF. On the earlier sections that extend south-west from the Campbell Plateau, orthosilicate increases sharply southward from 10–15 to 50–55 µmol l−1 between 58° S and 60° S, while surface temperature drops from 7°C to 2°C. Nitrate increases more regularly toward the south, with concentrations ranging from 10–12 µmol l−1 at 54° S to 25–30 µmol l−1 at 66° S. The same features are observed during the later transects between New Zealand and the Ross Sea, but the sharp silica and surface temperature gradients are shifted between 60° S and 64° S. Both temporal and spatial factors may influence the observed variability. The January transect suggests an uptake of silica, orthophosphate and nitrate between 63° S and 70° S over the intervening month, with an average depletion near 37%, 44% and 29%, respectively. An N/P (nitrite + nitrate/orthophosphate) apparent drawdown ratio of 8.8±4.1 and an Si/N (silicic acid/nitrite + nitrate) apparent drawdown ratio >1 suggest this depletion results from a seasonal diatom bloom. A southward movement of the oceanic fronts between New Zealand and the Ross Sea relative to prior measurements is consistent with reports of recent warming and changes in the ACC.
The Antarctic Circumpolar Current (ACC) is the largest coherent current structure in the world's oceans. A pronounced meridional gradient in surface properties that separate waters of the Southern Ocean from the warmer and saltier waters to the north is called the Subtropical Front (STF) (Clifford Citation1983; Hofmann Citation1985). South of the STF is the strong eastward flow of the ACC, the primary means by which water is exchanged between the major ocean basins. In particular, the ACC plays an essential role in the thermohaline circulation and the global redistribution of heat and other properties (Rintoul & Bullister 1999). Deacon (Citation1937) was the first to note that the southward transition from warm, light subtropical water occurred in a step-like manner, rather than as a gradual change across the breadth of the Southern Ocean. These steps are associated with strong surface currents (Nowlin et al. Citation1997), characterized by two or three narrow jets associated with sharp fronts (Nowlin & Klinck Citation1986; Orsi et al. Citation1995; Belkin & Gordon Citation1996; Sokolov & Rintoul Citation2009a). The fronts extend through the upper ocean and usually separate zones of relatively uniform water properties (Budillon & Rintoul Citation2003). This paper describes the evolution of nutrient concentrations and thermal structures in the surface waters between New Zealand and Antarctica, using data collected during five transects completed from mid-October 2004 into early January 2005.
In the region south of New Zealand the zonal orientation and latitudinal separation of the physical and chemical fronts minimize the effects of convergence and divergence. The sections cross the Subantarctic Front (SAF), the Polar Front (PF) and the southern Antarctic Circumpolar Current front (SACCF) (Whitworth Citation1980; Russo et al. Citation1999; Chaigneau & Morrow Citation2002; Budillon & Rintoul Citation2003). A variety of criteria has been used to identify the fronts (Peterson & Stramma Citation1991; Belkin & Gordon Citation1996). Here we use definitions based on temperature since we rely on expendable bathythermograph (XBT) sections to identify the fronts. The SAF is identified by the maximum gradient in the range of 3–8°C at the depth of 300 m (Belkin & Gordon Citation1996). Its northern part (NSAF) is associated with a maximum temperature gradient in the range of 4–7°C at 300 m and its southern part (SSAF) with a maximum temperature gradient in the range of 3–4°C at 300 m (Rintoul et al. Citation1997). The PF is identified where temperatures to the south are colder than 2°C at 200 m (Orsi et al. Citation1995). The SACCF displays temperatures to the south below 0°C at depths lower than 150 m and to the north above 1.8°C at depths >500 m (Orsi et al. Citation1995).
The sea floor underneath the ACC is the most important area where biogenic silica accumulates in the world ocean (DeMaster Citation1981). Although relatively rich in major nutrients, most of the ACC is less than optimally productive (Jaques Citation1989; Banse Citation1996), rendering it one of the most prominent high-nutrient, low-chlorophyll regions. In the South Atlantic sector it has been estimated that the total productivity of organic matter is low, which would imply a rather low drawdown of carbon dioxide (CO2) by phytoplankton (Arrigo et al. Citation1999; Hoppema et al. Citation2000). However, the Polar Front Zone (PFZ), located between the SAF and the PF (Orsi et al. Citation1995), is a unique oceanographic environment exhibiting some of the highest phytoplankton biomass and primary productivity in the Southern Ocean (De Baar et al. Citation1995). The PF separates the Antarctic Zone to the south, where high winter silicic acid concentrations result from upwelling of Circumpolar Deep Water (CDW) and from the PFZ to the north, where silica-depleted Antarctic Intermediate Water sinks and begins its northward transit (Morrison et al. Citation2001).
Most similar ACC studies have focused on the physical and chemical conditions encountered during a single cruise or temporal changes between data collected in different years and seasons. Morrison et al. (Citation2001) show that the evolution of water properties is consistent with the seasonal biological cycle, so that data collected at one location represent temporal variability within a dynamic zonal current. Here we describe nitrate, silicic acid and orthophosphate levels in the surface layer and temperatures in the upper 700 m of the ACC south of New Zealand. The aim of this work is to determine the spatial and temporal variability of the physical and chemical properties of the major ocean fronts in that region during spring and summer.
Methods
Hydrographic data were obtained during cruises aboard the RV N.B. Palmer (during the Antarctic Slope project) and the RV Italica (). Two of the transects are located between the Campbell Plateau and George V Land and three between New Zealand and the Western Ross Sea (). Vertical temperature profiles were obtained with T4 and T7 XBTs (Lockheed Martin Sippican, Marion, MA, USA) deployed to maximum depths of 460 m and 760 m, respectively. Seawater samples were collected at the surface underway from the ship's clean seawater flow-through systems, keyed to XBT launches spaced ca. 15′ in latitude (30′ in latitude during the third transect; ). The XBT profiles recorded at a resolution of 0.7 m were despiked and averaged at 5-m depth intervals. The XBT accuracy is ca. 0.1°C. Sea surface temperature and salinity were measured continuously by a thermosalinograph connected to the ship's seawater intake line.
Fig. 1. Geographic locations of five expendable bathythermograph (XBT) sections between New Zealand and Antarctica made by the research vessels N.B. Palmer and Italica from mid-October 2004 into early January 2005. The positions of main fronts—the Polar Front (PF) and the southern Antarctic Circumpolar Current front (SACCF)—are plotted.
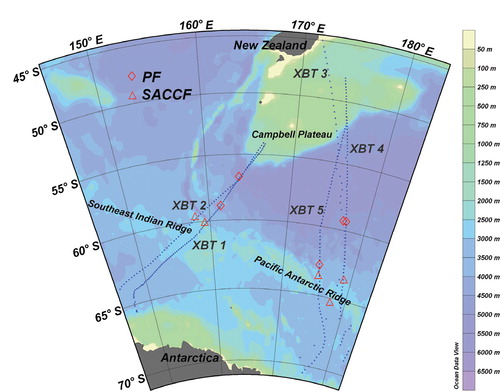
Table 1. Summary of the expendable bathythermograph (XBT) stations and seawater samples collected at each transect during the Antarctic Slope (AnSlope3) cruise and the RV Italica (ITA05) cruise in 2005.
Most nutrient samples from RV N.B. Palmer were filtered (GF/F grade 25-mm glass microfibre filter with a nominal pore size of 0.7 µm; Whatman, Maidstone, Kent, UK), stored at –70°C in polyethylene vials and analysed on board as soon as possible after collection. However, orthophosphate samples were analysed in our Italian laboratory six months after collection because of technical problems on board. Nutrient samples from RV Italica were similarly filtered and analysed ashore four months later, after storage at –20°C in polyethylene vials. The nutrients (nitrite [NO2], nitrate [NO3], orthophosphate [PO4] and silicic acid-Si[OH]4) were analysed with an AutoAnalyzer trAAcs 800 system (Technicon Corporation, New York, NY, USA) and the resulting data processed with AACE® 5.24 software. Nutrient concentrations were determined employing a modification of procedures developed by Strickland & Parsons (Citation1972).
For nitrite (NO2) and nitrate (NO3) we used the procedure whereby nitrate is reduced to nitrite at pH 8 in a copper–cadmium reductor. The nitrite then reacts under acid conditions with sulfanililamide to form a diazo compound that then couples with N-(1-naphthyl)-ethilenediamine, to form a reddish-purple azo dye that is measured at 550 nm. Nitrate is corrected for nitrite contribution by correcting for the efficiency of nitrate reduction and subtracting the nitrite concentration measured in an unreduced portion of the sample. Here we consider only nitrite plus nitrate (NO2+NO3) and the coefficient of variability is 0.44%. The determination of orthophosphate (PO4) is based on the colourimetric method in which a blue compound is formed by the reaction of phosphate, molybdate and antimony followed by reduction with ascorbic acid. The reduced blue phosphor–molybdenum complex is read at 880 nm, with a coefficient of variability of 0.57%. Measurement of soluble silicic acid (Si[OH]4) is based on the reduction of a silico molybdate in acid solution to molybdenum blue by ascorbic acid. Oxalic acid is introduced to the sample to minimize interference from orthophosphate and the absorbance is measured at 660 nm with a coefficient of variability of 0.59%.
Estimates of surface chl-a concentration (level 3, eight-day composites) were derived from data from the National Aeronautics and Space Administration (NASA) Sea-viewing Wide Field-of-view Sensor (SeaWiFS) project. Data were obtained from the Goddard Distributed Active Archive Center using the standard OC4v5.2 chlorophyll algorithm (http://oceancolor.gsfc.nasa.gov/REPROCESSING/SeaWiFS/R5.2/). Estimates of sea surface temperature derived from level 3, eight-day composite images from the Moderate Resolution Imaging Spectroradiometer launched on the Aqua satellite have been obtained from the Goddard Distributed Active Archive Center using a K-490v1.1 algorithm (http://oceancolor.gsfc.nasa.gov/REPROCESSING/Aqua/R1.1/). Finally, diatom surface concentrations were obtained from NASA's Ocean Biogeochemical Model (NOBM; http://reason.gsfc.nasa.gov/Giovanni/) (Gregg Citation2008).
Results
Thermal structure and variability
shows the upper ocean temperature field in mid-October and early November 2004 between the south-west end of the Campbell Plateau and George V Land. In October the SAF is split into a NSAF (55.9° S) and a SSAF (56.6° S). The PF is centred at 58.9° S and the SACCF at 60.1° S. A cold core with PF characteristics evident to the north at 57.5° S could be an eddy or meander.
Fig. 2. Temperature sections between New Zealand and George V Land during (a) 15–20 October 2004 and (b) 1–4 November 2004. Expendable bathythermograph locations are indicated above the plot. Positions of the northern Subantarctic Front (NSAF), the southern Subantarctic Front (SSAF), the Polar Front (PF) and the southern Antarctic Circumpolar Current front (SACCF) are also shown. Latitudinal ranges: 54° S–64° S.
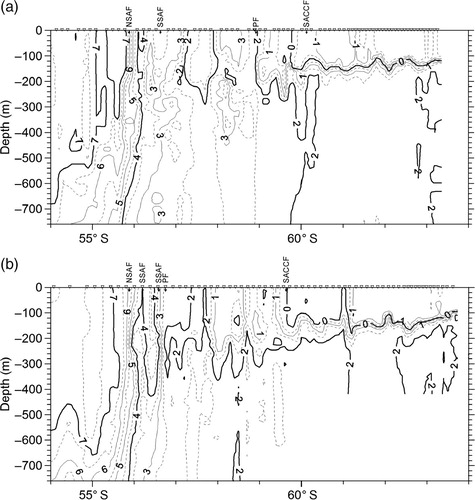
Less than three weeks later, the November section is characterized again by an intense NSAF centred at 55.9° S, with temperatures decreasing from 7°C to 5°C in <80 km. The SSAFs can also be seen both at 56.2° S and at 56.6° S, suggesting the presence of a cold eddy/meander in this area, as observed by Budillon & Rintoul (Citation2003). The PF has shifted to the north (56.7° S), nearly coinciding with the southern SSAF. The SACCF is also shifted to the north, ca. 0.5° of latitude, compared to the previous period.
shows a sequence of three sections taken in mid-November and early December 2004 and in early January 2005 between New Zealand and the Ross Sea. In November, before summer surface heating had begun, the SAF appears at 55.5° S but also displays a northern branch at 52.9° S. Southern branches of the SAF are detected at 56° S as 58.5° S, suggesting the presence of a cold meander. The SAF, NSAF and SSAF extend to the sea surface where fronts also appear in sea surface temperature. The PF is located at 59.3° S and the SACCF at 65.3° S. By the beginning of December (b) the NSAF has shifted northward and is located at 52° S. The SSAF has shifted from 58.5° S to 57.9° S and the cold eddy/meander is not present. No fronts are present at the surface, where their expression appears to be eroded by the initial summer warming. The PF is in about the same position as in November, while the SACCF has moved north to 63.5° S, by 1.8°.
Fig. 3. Temperature sections between New Zealand and the western Ross Sea during (a) 7–15 November 2004, (b) 30 November–5 December 2004 and (c) 1–6 January 2005. Station locations are indicated above the plot. Positions of the Subantarctic Front (SAF), the northern Subantarctic Front (NSAF), the southern Subantarctic Front (SSAF), the Polar Front (PF) and the southern Antarctic Circumpolar Current front (SACCF) are also shown. Latitudinal ranges: 47° S–73° S.
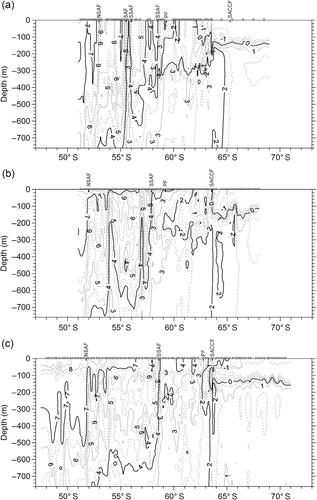
In early January (c) the NSAF (51.7° S) has moved slightly northward, the SSAF southward to 58.6° S and the PF has shifted southward to 62.8° S closer to the SACCF (63.6° S). These positions are within the ranges reported by Budillon & Rintoul (Citation2003) for 1994–2001. The PF tracks sea floor topography into the Pacific and is intensified at major bathymetric features, including the Pacific–Antarctic Ridge and Southeast Indian Ridge (Moore et al. Citation1999). They found a lower seasonal variability where topographic steering of the PF is strong and more seasonality from 175° E to 170° W, where the PF moved southward during the summer and farthest north during winter. While their seasonal variations in PF properties were relatively small compared with the spatial variability, the PF mean width and temperature gradient were highest during the spring, as in this study.
Surface variations in nutrients
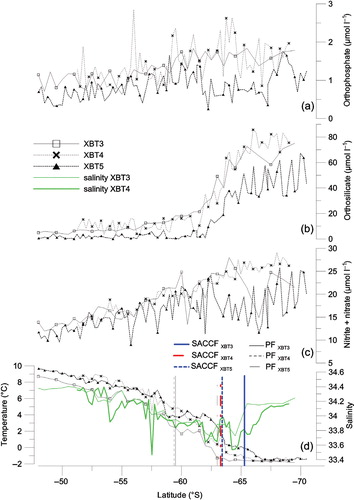
During the period of study, surface water temperature and salinity change is coupled with variations in nutrient concentrations. shows the surface concentrations of nutrients, temperature and salinity on the XBT 1 and XBT 2 sections between New Zealand and George V Land. In October orthophosphates increase irregularly southward, ranging from 0.8–1.1 µmol l−1 at 54° S to 1.9–2.2 µmol l−1 at 65.5° S. Nitrate concentrations range between 12–13 µmol l−1 at 54° S and 24–28 µmol l−1 at 65.5° S, with two abrupt increases: the first from 12.2 µmol l−1 to 19.5 µmol l−1 is observed between 55.5° S and 56.4° S as temperature decreases from 7.4°C to 3.1°C across the NSAF. A further sharp increase in nitrate concentrations occurs as temperature decreases between 58.6° S (T = 3.4°C; NO3=19.1 µmol l−1) and 61.8° S (T = –1.6°C; NO3=26.2 µmol l−1) where the PF and the SACCF are intercepted (a). Silicic acid concentrations show a sharp increase from 11 µmol l−1 to 55 µmol l−1 as latitude changes from 58° S to 61° S and temperature decreases from 3.4°C to –1.3°C in correspondence with the second nitrate increase. A silica maximum (20.1 µmol l−1) is observed in the cold core centred at latitude 57° S and 58° S. Temperature and nutrient concentrations are roughly constant south of the SACCF (60.1° S).
Fig. 4. Distribution of surface temperature (°C), salinity (green line) and nutrients (silicic acid, orthophosphate and nitrite + nitrate [µM]) between New Zealand and George V Land from 15 to 20 October 2004 (XBT 1) and from 1 to 4 November 2004 (XBT 2). (a) Orthophosphate, (b) orthosilicate and (c) nitrite + nitrate. The symbols represent every third sampling event. In (d) the vertical lines represent the Polar Front (PF) and the southern Antarctic Circumpolar Current front (SACCF) positions along the transects.
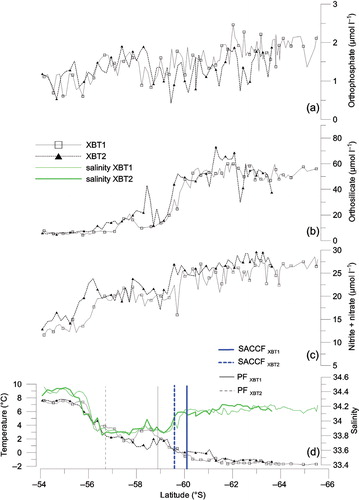
In November the XBT 2 section shows features similar to those in October. Orthophosphates increase more regularly moving southward, while nitrates and silicic acid are strongly correlated with temperature change (R=0.89, n=66, P<0.001) and (R=0.95, n=66, P<0.001), respectively. Nitrate concentrations generally increase from 13 µmol l−1 to 28–29 µmol l−1 along the section, in particular rising from 14.1 µmol l−1 at 55.2° S to 23.8 µmol l−1 at 56.2 °S as temperature quickly drops from 7.5 °C to 4.1 °C and where the surface expression of the NSAF (55.9 °S) is present. Silicic acid values increase regularly up to 58 °S, after which abrupt changes in silicate and temperature are observed. Surface salinity in transects 1 and 2 (c) decreases sharply from 34.40 to 33.85 as temperature cools across the SAF near 55.6–56.0 °S, is stable between 56.0 °S and 59.4 °S and then increases to a plateau of ca. 34.15 from 60 °S to 65 °S. Similar features are evident in transects 3–5 () between New Zealand and the western Ross Sea, but the sharp silicate and temperature gradients are shifted between 60 °S and 64 °S as the PF follows the Pacific–Antarctic Ridge. In November (XBT 3) orthophosphate concentrations show a general increase southward, from values of 0.6–0.8 µmol l−1 at 54 °S to values of 1.8 µmol l−1 at 70 °S, as temperature changes from 6–7°C to –1.8°C. The NO2+NO3 and silicic acid concentrations show a more irregular gradient relative to transects 1 and 2. Silicate, in particular, shows a sharp gradient from 18 µmol l−1 (60° S) to 72.5 µmol l−1 (65.5° S), while temperatures decrease from 1.7°C to –1.6°C. The abrupt change coincides with the surface expression of the PF.
Fig. 5. Distribution of surface temperature (°C), salinity (green line) and nutrients (silicic acid, orthophosphate and nitrite + nitrate [µM]) between New Zealand and western Ross Sea from 7 to 15 November 2004 (XBT 3), from 30 November to 5 December 2004 (XBT 4) and from 1 January to 6 January 2005 (XBT 5). (a) Orthophosphate, (b) orthosilicate and (c) nitrite + nitrate. The symbols represent every third sampling event. In the lower panel (d) the vertical lines represent the Polar Front (PF) and the southern Antarctic Circumpolar Current front (SACCF) positions along the transects.
Orthophosphate concentrations show more variability along the section in December (XBT 4), ranging between 0.8 µmol l−1 and 2.8 µmol l−1, with a slight increase southward. The NO2+NO3 concentrations present a regular increase southward. Silicic acid concentrations increase sharply from 61° S to 64° S as temperature decreases from 3.4°C to –0.9°C, again corresponding to the surface expression of the PF. The salinity gradients in transects 3 and 4 (c) are more regular than in transects 1 and 2, decreasing from 34.35 at 50° S to 33.8 at 60° S, less variable between 60° S and 65° S and increasing to 34.10–34.15 at 67° S and southward, with an overall accompanying temperature decline from +9°C to ca. –1.1°C.
In early January (XBT 5), nutrient concentrations are lower along the entire transect. The NO2+NO3 and orthophosphate show a more or less regular increase to 62° S (the PF). The NO2+NO3 range between 10–11 µmol l−1 at 48° S and 23–24 µmol l−1 at 62° S, while orthophosphates range between 0.4–0.6 µmol l−1 and 1.3–1.4 µmol l−1 in the same latitude range. South of the PF both nutrients show a slight decrease and then increase regularly. Silicates show different trends, being low between 48° S and 62° S, 0.5–6 µmol l−1. The silicate concentrations then show a sharp increase from 3–4 µmol l−1 at 62° S to 30–35 µmol l−1 at 65° S as temperature changes from approximately 4°C to 0°C.
Discussion
Fronts are circumpolar features of the Southern Ocean. On every transect the property fields are found to be organized in such a manner that the transition from warm water in the north to cold water in the south occurs in a series of steps or fronts. These fronts accomplish most of the transport of the ACC and delineate zones characterized by distinct biogeochemical distributions (Sokolov & Rintoul Citation2007).
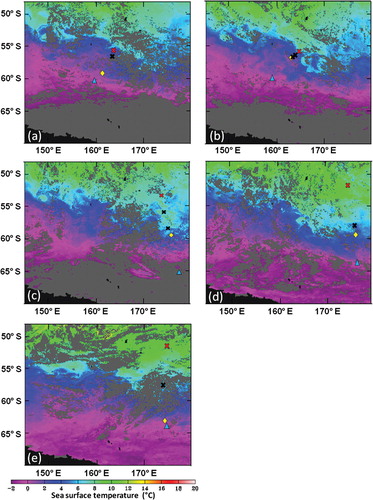
It has been shown that there are three distinct circumpolar fronts within the ACC: the SAF, PF and SACCF. The most conspicuous feature in our sections is the SAF, across which temperature at 300 m increases from <4°C to >7°C, south to north. The structure of the SAF is complex with the increase in temperature usually occurring in two steps and the presence of northern and southern branches (see also Russo et al. Citation1999; Budillon & Rintoul Citation2003). Locating the front is complicated by possible eddies or meanders associated with these branches, as showed by satellite images of sea surface temperatures (). Following Budillon & Rintoul (Citation2003), we take the northernmost and southernmost expressions of the NSAF and SSAF to define locations of the northern and southern branches. The NSAF can be identified on all XBT sections and is almost always found over the continental slope at the southern edge of Campbell Plateau. This suggests a NSAF slight northward shift from November to January along the New Zealand–Ross Sea track. The SSAF shows two expressions in the XBT 2 section, probably due to a meander (b). On the other hand, two expressions of the SSAF along the XBT 3 transect do not appear in the XBT 4 and XBT 5 transects. The position of the PF appears more variable, with a northward shift in the XBT 2 versus XBT 1 and a southward movement in the XBT 3–5 sections. However, XBT 1 displays a core of cold water with PF characteristics to its north, which should be a meander (a). The SACCF is more stable through time and, to the extent that frontal positions are linked to the underlying bathymetry (Pollard et al. Citation2002), their apparent seasonal movements could relate to spatial offsets in the ship tracks.
Fig. 6. Eight-day composites of sea surface temperature (°C) from Moderate Resolution Imaging Spectroradiometer (MODIS) images for the study site during the five expendable bathythermograph (XBT) transects: (a) XBT 1, 15–22 October 2004; (b) XBT 2. 31 October–8 November 2004; (c) XBT 3, 8–15 November 2004; (d) XBT 4, 2–9 December 2004 and (e) XBT 5, 1–8 January 2005 (images from http://poet.jpl.nasa.gov/). Grey areas represent missing data, primarily due to cloud cover. The positions of the northern Subantarctic Front (red cross), the southern Subantarctic Front (black cross), the Polar Front (yellow diamond) and the southern Antarctic Circumpolar Current front (blue triangle) are indicated.
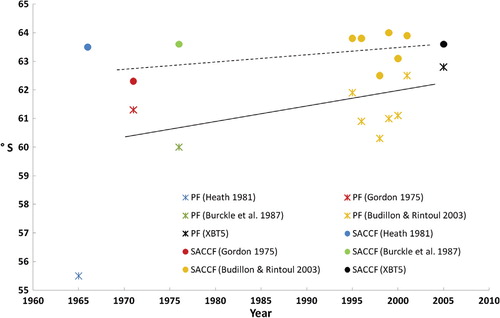
To evaluate the frontal variability in the studied area through the years, we plotted the positions of the PF and the SACCF found by other researchers working on this topic (Gordon Citation1975; Heath Citation1981; Burckle et al. Citation1987; Budillon & Rintoul Citation2003) during the same region and season as XBT 5 (). The above authors used different definitions of the PF and the SACCF so all the positions have been recalculated here using the same definitions. While the Heath (Citation1981) transect along 160° E is less comparable because of the different longitude, the position of the PF moved southward in the period 1965–2005 and the SACCF did not. A southward movement by 2° of the PF is quite evident between 1975 and 2005 and may correspond to warming of the Southern Ocean and/or changes in the ACC position during recent decades (Gille Citation2002). The SACCF shifted less (by 1° of latitude southward), but these changes are comparable to those reported over the Australian–Antarctic Basin (70–150° E) between 1993 and 2006 (Sokolov & Rintoul Citation2009b). Unfortunately, the relatively poor data from this region that have been published did not permit us to obtain a statistical significant correlation for performing the regression analysis (PF: n=9, R 2=0.22, P > 0.005; SACCF: n=9, R 2=0.21, P > 0.005). More than 85% of the total change in heat content of the Earth's system has gone into warming the oceans (Levitus et al. Citation2005). Sokolov & Rintoul (Citation2009b) suggest that the warming of the Southern Ocean is largely caused by a southward shift of the fronts of the ACC. The warming is not uniform around the circumpolar belt as a result of both the spatial distribution of changes in wind forcing relative to the location of the fronts (Sallée et al. Citation2008) and to interactions between the fronts and bathymetry. By using a 17-year series of remotely sensed sea surface temperatures in the Southern Hemisphere, Kwok & Comiso (Citation2002) demonstrated that positive temperature anomalies and ice-edge retreat in the Pacific sector of the Southern Ocean were associated with large-scale circulation patterns such as El Niño episodes. Our observations indicate that the ACC fronts remained shifted to the south in 2004–05 compared to earlier positions (Gille Citation2002 Citation2008; Aoki et al. Citation2003; Böning et al. Citation2008; Morrow et al. Citation2008; Sprintall Citation2008; Sokolov & Rintoul Citation2009b), confirming the southward movement of the ACC.
Fig. 7. Latitude of the Polar Front (PF) and the front of the southern Antarctic Circumpolar Current (SACCF) as observed by Gordon (Citation1975), Heath (Citation1981), Burckle et al. (Citation1987), Budillon & Rintoul (Citation2003) and in our fifth transect. The PF is identified by temperatures below 2°C at 200 m and the SACCF by temperatures below 0°C at depths lower than 150 m and above 1.8°C at depths >500 m (Orsi et al. Citation1995). The solid line shows the PF regression over the past 40 yrs and the dotted line shows the regression of the SACCF over the same time span; the PF by Heath (Citation1981) was not used for the regression.
The surface thermal structure plays an important role in the meridional flux of nutrients, as inferred by Budillon & Rintoul (Citation2003). In addition, different surface water masses can be identified by both the temperature and the nutrient trends (, ), as noted by Morrison et al. (Citation2001). Here NO2+NO3 and orthosilicate show negative correlations with temperature (NO2+NO3: n=379, R 2=0.69, P<0.001; Si(OH)4: n=380, R 2=0.77, P<0.001). In the XBT 1 and XBT 2 transects an increase in surface orthophosphate and NO2+NO3 concentrations is evident in the location of the northern branches of the SAF, as in Rintoul & Bullister (Citation1999). On the XBT 3–5 transects an increase in orthophosphate and NO2+NO3 concentrations is not evident across the SAF, perhaps due to the increase in light irradiance and the relative increase in nutrient consumption by phytoplankton growth (Mitchell et al. Citation1991). The surface expression of the PF is well identified by the change in silicic acid concentrations in all the sections, as well as by the Redfield ratio (). On the XBT 1 transect, silicic acid is high in the cold core between 57° S and 58° S north of the PF as noted above. The NO2+NO3 also increases in the PF zone but less rapidly than silicate. The NO2+NO3 and orthophosphate concentrations increase southward but do not show clear correlations with the frontal positions. These nutrient increases are consistent with the presence of high-nutrient, low-chlorophyll water south of the PF, as is the Si/N Redfield ratio (). Moreover, during the winter period of ice cover, Rubin et al. (Citation1998) observed in the Ross Sea a low vertical stability that may increase the flux of macronutrients to the surface layer by enhanced deepwater upwelling.
Table 2. Ratio between silicic acid (Si), nitrite + nitrate (N) and orthophosphate (P) in the five expendable bathythermograph (XBT) transects in the different areas: from north to the first expression of the Subantarctic Front (SAF), from the SAF to the Polar Front (PF) and southward of the PF.
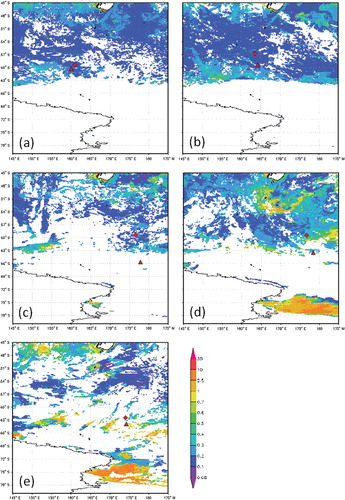
Southward increases in diatom abundance in the Subantarctic region have been reported by several workers in the past (Marumo Citation1957; Fukase & El Sayed Citation1965; Burckle et al. Citation1987; Eynaud et al. Citation1999). In comparison to XBT 3 and XBT 4, our XBT 5 transect reveals a significant decrease of NO2+NO3, phosphate and silicic acid between 63° S and 70° S, as also observed by Morrison et al. (Citation2001) in the same period. High nutrient concentration variability across the XBT 5 section may be due to sea-ice melting. South of 63° S, orthosilicates average 42.7±12.3 µmol l−1; phosphates 1±0.3 µmol l−1 and NO2+NO3 18.2±4 µmol l−1, corresponding to potential nutrient uptakes of 25 µmol l−1 (37%), 0.7 µmol l−1 (44%) and 7.4 µmol l−1 (29%), respectively. These depletions are probably associated with the seasonal phytoplankton bloom characteristic of this period (Moore & Abbot Citation2002; Green & Sambrotto Citation2006; Sokolov & Rintoul Citation2007). SeaWiFS Chlorophyll-a concentration images of the five periods evidenced low concentration of Chl-a southward of 50° S between mid-October and mid-November (a–c), while an increase is observed during XBT 4 and 5. Moreover, a phytoplankton increase south of 63° S can be seen during XBT 5 (e) with respect to the XBT 4 (d) and it is consistent with the observed nutrient depletion and the ice melting typical of the summer season. The use of satellite imagery has drastically changed our view of phytoplankton dynamics. Unfortunately, information gaps caused by cloud and sea-ice cover show the limitations of using remotely sensed data. Nevertheless, Sokolov (Citation2008) demonstrated that within the seasonal sea-ice zone and poleward of the southern branch of the SACCF in particular, the summer chlorophyll blooms are primarily driven by melting of the sea ice, causing formation of very shallow mixed layers, which improves light levels and the release of iron deposed on the sea ice by aeolian deposition during the winter season.
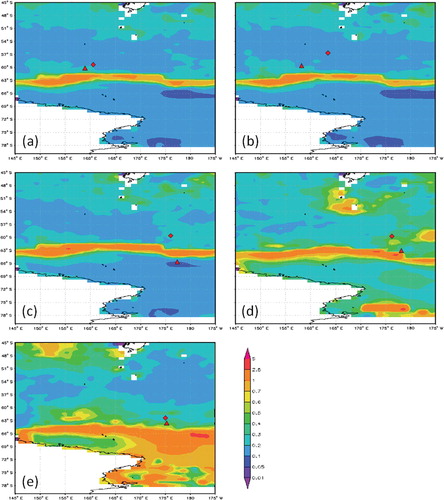
Fig. 8. Eight-day composites of the National Aeronautics and Space Administration's Sea-viewing Wide Field-of-view Sensor (SeaWiFS) project imagery of chl-a (mg m−3) for the study site during the five expendable bathythermograph (XBT) transects: (a) XBT 1, 15–22 October 2004; (b) XBT 2, 31 October–7 November 2004; (c) XBT 3, 8–15 November 2004; (d) XBT 4, 2–9 December 2004 and (e) XBT 5, 1–8 January 2005 (images from http://reason.gsfc.nasa.gov/Giovanni/). White areas represent missing data, primarily due to cloud and sea-ice cover. The positions of the Polar Front (red diamond) and the southern Antarctic Circumpolar Current front (red triangle) are indicated.
Ratios of apparent nutrient drawdown south of the PF are calculated for these transects in order to estimate bloom and regeneration processes. During the early summer the apparent N/P drawdown ratio is 8.8±4.1 (average±standard deviation) and the apparent Si/N drawdown ratio is 3.9±2.8. Both values are in accord with a diatom-dominated bloom, as in Sweeney et al. (Citation2000), Morrison et al. (Citation2001) and Green & Sambrotto (Citation2006). shows diatom concentrations derived from the NOBM for all the periods. The model application confirms a diatom growth south of 63° S that is particularly evident in January 2005 (e).
Fig. 9. Eight-day composites of the National Aeronautics and Space Administration's Ocean Biogeochemical Model (NOBM) imagery of diatoms (mg m−3) for the study site during the five expendable bathythermograph (XBT) transects: (a) XBT 1, 15–22 October 2004; (b) XBT 2, 31 October–7 November 2004; (c) XBT 3, 8–15 November 2004; (d) XBT 4, 2–9 December and (e) XBT 5, 1–8 January 2005 (images from http://reason.gsfc.nasa.gov/Giovanni/). The positions of the Polar Front (red diamond) and the southern Antarctic Circumpolar Current front (red triangle) are indicated.
Conclusions
The ACC is the major current in the Southern Ocean, isolating the warm stratified subtropical waters from the more homogeneous cold polar waters. Nutrient and XBT observations can be helpful in understanding possible links between thermal and chemical changes of its near-surface fronts and zones. A strong latitudinal gradient in orthosilicate concentration is centred near the PF but also extends well south of that feature as a result of the upwelling of the CDW. Orthophosphate and NO2+NO3 concentrations reveal the position of the SAF better than other nutrients during spring and better in spring than summer when phytoplankton growth causes the depletion of these macronutrients. This feature could be due to uptake by different phytoplankton groups not dominated by diatoms or silicoflagellates as well as to the absence of strong orthosilicate input at the surface, as happens south of PF.
Differences in the density of water masses probably lead to physical obstacles that limit chemical and biological mixing through the fronts within the ACC. During the seasonal phytoplankton bloom, nutrients are significantly depleted south of the PF. The N/P and Si/N nutrient drawdown ratios there suggest uptake by diatoms. While the majority of changes in surface nutrient distributions appear to be due to seasonal biological productivity, exact repeat sections along the same meridian would help to reduce uncertainties introduced by spatial variability.
The positions of ocean fronts in the upper ocean between New Zealand and the Ross Sea in spring–summer 2004–05 were within the ranges that have been observed by other authors (Budillon & Rintoul Citation2003). Over recent decades, however, the January positions of the PF and SACCF reveal a southward movement of these fronts, perhaps related to ocean warming and a more southward location of the ACC. In particular, the southward movements of the PF positions during 1975–2005 appear evident because in the summer period the ice melt is dominant and more dependent on ocean warming. Since the thermohaline properties of these fronts set the density field and are closely correlated with nutrient levels and gradients, we infer there have likely been associated ocean current and ecosystem changes.
Acknowledgements
This work was supported by the Antarctic Slope project and the Climatic Long-term Interactions for the Mass Balance in Antarctica project. We are grateful to the captains, officers, crew and scientists on the research vessels N.B. Palmer and Italica for their assistance with data and sample collection. We wish to give our thanks to anonymous reviewers for their insightful comments and suggestions that have served to significantly improve the paper.
References
- Aoki S, Yoritaka M. & Masuyama A. 2003. Multidecadal warming of subsurface temperature in the Indian sector of the Southern Ocean. Journal of Geophysical Research—Oceans 108. article no. 8081, 10.3402/polar.v30i0.7064.
- Arrigo K.R. Robinson D.H. Worthen D.L. Dunbar R.B. Ditullio G.R. Van Woert M. Lizotte M.P. Phytoplankton community structure and drawdown of nutrients and CO2 in the Southern Ocean. Science. 1999; 283: 365–367.
- Banse K. Low seasonality of low concentration of surface chlorophyll in the Subantarctic water ring: underwater irradiance, iron, or grazing?. Progress in Oceanography. 1996; 37: 241–291.
- Belkin I.M. Gordon A.L. Southern ocean fronts from the Greenwich meridian to Tasmania. Journal of Geophysical Research—Oceans. 1996; 101: 3675–3696.
- Böning C.W. Dispert A. Visbeck M. Rintoul S. Schwarzkoph F.U. The response of the Antarctic Circumpolar Current to recent climate change. Nature Geoscience. 2008; 1: 864–869.
- Budillon G. Rintoul S.R. Fronts and upper ocean thermal variability south of New Zealand. Antarctic Science. 2003; 15: 141–152.
- Burckle L.H. Jacobs S.S. Mclaughlin R.B. Late austral diatom distribution between New Zealand and the Ross Ice Shelf, Antarctica: hydrographic and sediment correlations. Micropaleontology. 1987; 33: 74–81.
- Chaigneau A. & Morrow R. 2002. Surface temperature and salinity variations between Tasmania and Antarctica, 1993–1999. Journal of Geophysical Research—Oceans 90. article no. 8020, 10.3402/polar.v30i0.7064.
- Clifford M.A. 1983. A descriptive study of the zonation of the Antarctic Circumpolar Current and its relation to wind stress and ice cover. Master's thesis, Texas A&M University, College Station.
- Deacon G.E.R. The hydrology of the Southern Ocean. Discovery Report 15. Discovery Committee. London, 1937
- De Baar H.J.M. De Jong J.T.M. Bakker D.C.E. Löscher B.M. Veth C. Bathmann U. Smetacek V. Importance of iron for phytoplankton spring blooms and CO2 drawdown in the Southern Ocean. Nature. 1995; 373: 412–415.
- DeMaster D.J. The supply and accumulation of silica in the marine environment. Geochimica et Cosmochimica Acta. 1981; 45: 1715–1732.
- Eynaud F. Girardeau J. Pichon J.J. Pudsey C.J. Sea-surface distribution of coccolithophores, diatoms, silicoflagellates and dinoflagellates in the South Atlantic Ocean during the late austral summer 1995. Deep-Sea Research Part I. 1999; 46: 451–482.
- Fukase S. El-Sayed S.Z. Studies on diatoms of the Argentine coast, the Drake Passage and the Bransfield Strait. Oceanographic Magazine. 1965; 17: 1–11.
- Gille S.T. Warming of the Southern Ocean since the 1950s. Science. 2002; 295: 1275–1277.
- Gille S.T. Decadal-scale temperature trends in the Southern Hemisphere ocean. Journal of Climate. 2008; 21: 4749–4765.
- Gordon A. An Antarctic oceanographic section along 170°E. Deep-Sea Research. 1975; 22: 357–377.
- Green S.E. Sambrotto R.N. Net community production in terms of C, N, P and Si in the Antarctic Circumpolar Current and its influence on regional water mass characteristics. Deep-Sea Research Part I. 2006; 53: 111–135.
- Gregg W.W. Assimilation of SeaWiFS ocean chlorophyll data into a three-dimensional global ocean model. Journal of Marine Systems. 2008; 69: 205–225.
- Heath R.A. Oceanic fronts around southern New Zealand. Deep-Sea Research Part A. 1981; 28: 547–560.
- Hofmann E.E. The large-scale horizontal structure of the Antarctic Circumpolar Current from FGGE drifters. Journal of Geophysical Research—Oceans. 1985; 90: 7087–7097.
- Hoppema M. Fahrbach E. De Baar H.J.W. Surface layer balance of the southern Antarctic Circumpolar Current (prime meridian) used to derive carbon and silicate consumptions and annual air-sea exchange for CO2 and oxygen. Journal of Geophysical Research—Oceans. 2000; 105: 11,359–11,371.
- Jaques G. Primary production in the open Antarctic ocean during the austral summer. A review. Vie Millieu. 1989; 39: 1–17.
- Kwok R. & Comiso J.C. 2002. Spatial patterns of variability in Antarctic surface temperature: connections to the southern hemisphere annular mode and the Southern Oscillation. Geophysical Research Letters. 29, article no. 1705, 10.3402/polar.v30i0.7064.
- Levitus S, Antonov J. & Boyer T. 2005. Warming of the world ocean, 1955–2005. Geophysical Research Letters. 32, L02604., 10.3402/polar.v30i0.7064.
- Marumo R. The surface distribution of phytoplankton diatoms in the western part of the Pacific Ocean and in the Antarctic Ocean in: 1954–1955. Oceanographic Magazine. 1957; 9: 143–147.
- Mitchell B.G. Brody E.A. Holm-Hansen O. Mcclain C. Bishop J. Light limitation of phytoplankton biomass and macronutrient utilization in the Southern Ocean. Limnology and Oceanography. 1991; 36: 1662–1677.
- Moore J.K. Abbot M.R. Surface chlorophyll concentrations in relation to the Antarctic Polar Front: seasonal and patterns from satellite observations. Journal of Marine Systems. 2002; 37: 69–86.
- Moore J.K. Abbott M. Richman J. Location and dynamics of the Antarctic Polar Front from satellite sea surface temperature data. Journal of Geophysical Research—Oceans. 1999; 104: 3059–3073.
- Morrison J.M. Gaurin S. Codispoti L.A. Takahashi T. Millero F.J. Gardner W.D. Richardson M.J. Seasonal evolution of hydrographic properties in the Antarctic Circumpolar Current at 170°W during 1997–1998. Deep-Sea Research Part II. 2001; 48: 3943–3972.
- Morrow R. Valladeau G. Sallée J.B. Observed subsurface signature of Southern Ocean sea level rise. Progress in Oceanography. 2008; 77: 351–366.
- Nowlin W.D. Jr. Klinck J.M. The physics of the Antarctic Circumpolar Current. Reviews of Geophysics. 1986; 24: 469–491.
- Nowlin W.D. Jr. Whitworth T. III, Pillsbury R.D. Structure and transport of the Antarctic Circumpolar Current at Drake Passage. Journal of Physical Oceanography. 1997; 7: 778–802.
- Orsi A.H. Whitworth T. III, Nowlin W.D. On the meridional extent and fronts of the Antarctic Circumpolar Current. Deep-Sea Research Part I. 1995; 42: 641–673.
- Peterson R.G. Stramma L. Upper-level circulation in the South Atlantic Ocean. Progress in Oceanography. 1991; 26: 1–73.
- Pollard R.T. Lucas M.I. Read J.F. Physical controls on biogeochemical zonation in the Southern Ocean. Deep-Sea Research Part II. 2002; 49: 3289–3305.
- Rintoul S.R. Bullister J.L. A late winter hydrographic section from Tasmania to Antarctica. Deep-Sea Research Part I. 1999; 46: 1417–1454.
- Rintoul S.R. Donguy J.R. Roemmich D.H. Seasonal evolution of upper thermal structure between Tasmania and Antarctica. Deep-Sea Research Part I. 1997; 44: 1185–1202.
- Rubin S.I. Takahashi T. Chipman D.W. Goddard J.G. Primary productivity and nutrient utilization ratios in the Pacific sector of the Southern Ocean based on seasonal changes in seawater chemistry. Deep-Sea Research Part I. 1998; 45: 1211–1234.
- Russo A. Artegiani A. Budillon G. Paschini E. Spezie G. Upper ocean thermal structure and fronts between New Zealand and the Ross Sea (austral summer 1994–95 and 1995–96). Oceanography of the Ross Sea. Spezie G. Manzella G.M.R. Springer. Milan, 1999; 67–75.
- Sallée J.B.K. Speer K. Morrow R. Response of the Antarctic Circumpolar Current to atmospheric variability. Journal of Climate. 2008; 21: 3020–3039.
- Sokolov S. 2008. Chlorophyll blooms in the Antarctic Zone south of Australia and New Zealand in reference to the Antarctic Circumpolar Current fronts and sea ice forcing. Journal of Geophysical Research—Oceans 113. C03022., 10.3402/polar.v30i0.7064.
- Sokolov S. Rintoul S.R. Structure of ocean fronts at 140°E. Journal of Marine Systems. 2002; 37: 151–184.
- Sokolov S. & Rintoul S.R. 2007. On the relationship between fronts of the Antarctic Circumpolar Current and surface chlorophyll concentration in the Southern Ocean. Journal of Geophysical Research—Oceans 112. C07030., 10.3402/polar.v30i0.7064.
- Sokolov S. & Rintoul S.R. 2009a. Circulation structure and distribution of the Antarctic Circumpolar Current fronts: 1. Mean circumpolar paths. Journal of Geophysical Research—Oceans 114. C11019., 10.3402/polar.v30i0.7064.
- Sokolov S. & Rintoul S.R. 2009b. Circumpolar structure and distribution of the Antarctic Circumpolar Current fronts: 2. Variability and relationship to sea surface height. Journal of Geophysical Research—Oceans 114. C11019., 10.3402/polar.v30i0.7064.
- Sprintall J. 2008. Long term trends and interannual variability of temperature in Drake Passage. Progress in Oceanography. 77, 316–330., 10.3402/polar.v30i0.7064.
- Strickland J.D.H. Parsons T.R. A practical handbook of seawater analysis. Fisheries Research Board of Canada. Ottawa, 1972
- Sweeney C. Smith W.O. Hales B. Bidigare R.R. Carlson C.A. Codispoti L.A. Gordon L.I. Hansell D.A. Millero F.J. Park M. Takahashi T. Nutrient and carbon removal ratios and fluxes in the Ross Sea, Antarctica. Deep-Sea Research Part II. 2000; 47: 3395–3421.
- Whitworth T. Zonation and geostrophic flow of the Antarctic Circumpolar Current at Drake Passage. Deep-Sea Research Part A. 1980; 27: 497–507.