
Abstract
A recently recovered and compiled set of inorganic carbon data collected in the Canadian Arctic since the 1970s has revealed substantial change, as well as variability, in the carbonate system of the Beaufort Sea and Canada Basin. Whereas the role of this area as a net atmospheric carbon sink has been confirmed, high pCO2 values in the upper halocline underscore the potential for CO2 outgassing as sea ice retreats and upwelling increases. In addition, increasing total inorganic carbon and decreasing alkalinity are increasing pCO2 and decreasing CaCO3 saturation states, such that undersaturation with respect to aragonite now occurs regularly in both deep waters and the upper halocline.
A Corrigendum has been published for this paper. Please see http://www.polarresearch.net/index.php/polar/article/view/31998
As we witness dramatic changes in the Arctic Ocean and its drainage basin, with rising temperatures, summer and multi-year sea-ice loss, permafrost thawing and coastal erosion, our attempts to understand what is occurring and deconvolute the results of natural versus anthropogenic processes are confounded by the lack of long time-series data that describe not only the climatic, but also the biogeochemical, state of the system. Numerical climate models (e.g., Meehl et al. Citation2007) indicate that the impacts of anthropogenic global warming are proceeding fastest in the Arctic, and the satellite sea-ice record (e.g., Perovich & Richter-Menge Citation2009; Stroeve et al. Citation2012) appears to confirm that prediction. Nevertheless, our ability to accurately project those changes into the future is still limited by our fragmented understanding of biogeochemical and physical processes in the Arctic (Stroeve et al. Citation2007; Schiermeier Citation2012; Stroeve et al. Citation2012), as well as by our inability to predict future human behaviour.
Although ocean carbonate system research has accelerated over the last two decades in response to public and political concern about climate change and ocean acidification, chemical oceanographers have been studying the marine inorganic carbon cycle for much longer. The Institute of Ocean Sciences began measuring total inorganic carbon (TIC) and total alkalinity (AT) in the Arctic Ocean in 1974. Logistics, protocols, and analytical methods have obviously changed since that time, hopefully improving data quality, but nonetheless, the early data are a valuable resource and contribute insight into how the system has evolved.
In this paper, we discuss what this 40-year time series tells us about the variability in the carbonate system of the Beaufort Sea, with particular reference to the atmospheric CO2 sink and CaCO3 stability. The data set, itself, has been compiled from both paper and electronic sources at the Institute of Ocean Sciences (Giesbrecht et al. Citation2014) and includes data from the Gulf of Alaska, through Bering Strait and the Canadian Archipelago, and into the Gulf of St. Lawrence. However, the bulk of the data, with multiple observations of the same stations and water masses over many years, are from the Beaufort Sea, and therefore, we focus our discussion on the western Canadian Arctic, including the Canada Basin, the Mackenzie Shelf and Amundsen Gulf (), using the data collected between 120 and 156°W. For insights into the carbonate system oceanography of the other North American polar and subpolar seas, see, for example, Wong et al. (Citation2007; Gulf of Alaska), Kaltin & Anderson (Citation2005; Bering Sea), Bates et al. (Citation2013; Chukchi Sea), Azetsu-Scott et al. (Citation2010; Canadian Archipelago and Labrador Sea), and Mucci et al. (Citation2011; St. Lawrence Estuary). Parts of this data set have already been published within the context of specific process studies (Yamamoto-Kawai et al. Citation2009; Mucci et al. Citation2010; Miller et al. Citation2011; Yamamoto-Kawai et al. Citation2011; Lansard et al. Citation2012), but this paper is the first to look at this internally consistent time series as a whole.
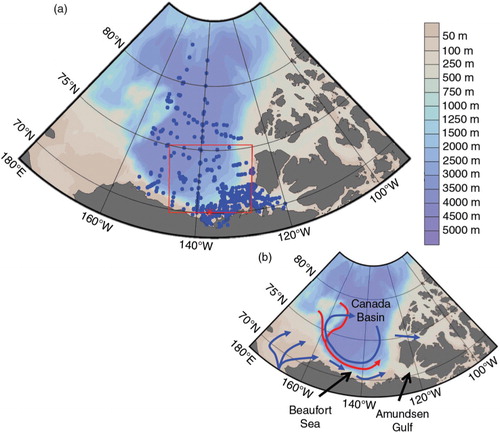
Fig. 1 Map of the western Arctic Ocean showing (a) sampling stations in (b) the Canada Basin, Beaufort Sea and Amundsen Gulf included in the discussion. The colour bar shows bathymetry, the red box in (a) represents the area used in and 8–10, and in (b) dominant surface currents are represented by blue arrows and subsurface currents by red arrows.
The Western Canadian Arctic
The southern Beaufort Sea, including the Mackenzie Shelf and Amundsen Gulf, has been studied more extensively for a longer period and is better understood than the Canada Basin. This is primarily a function of logistics and historical access, and is reflected in the distribution of our inorganic carbon data set (). For overviews of the oceanographic and meteorological conditions of this area, see Carmack et al. (Citation1997), Melling (Citation1998), Carmack & Macdonald (Citation2002), McLaughlin et al. (Citation2002), McLaughlin et al. (Citation2004), Barber & Hanesiak (Citation2004), Overland (Citation2009) and Bringué & Rochon (Citation2012).
Table 1 Number of carbonate system data points (individual bottle samples for total inorganic carbon, total alkalinity and/or pH) included in the data set by date and latitude.
Briefly, the circulation of surface waters and sea ice within the Canada Basin is generally clockwise (b), although the strength of this circulation, which defines the Beaufort Gyre, varies in time (McLaughlin et al. Citation2002; Asplin et al. Citation2009), apparently in response to the Arctic Oscillation (e.g., Thompson & Wallace Citation1998). The currents over the Beaufort Shelf and upper slope are variable, with frequent wind-driven reversals, although the mean flow is generally towards the east (Melling Citation1993). The upper water column, down to about 200 m, is primarily derived from Pacific Ocean waters (b) which are modified as they pass through the Bering and Chukchi seas and by seasonal local processes, specifically by mixing with river waters (both the Mackenzie River and Siberian rivers) and by sea-ice formation and melt (a; Coachman & Barnes Citation1961; Carmack & Macdonald Citation2002). The wide and shallow continental shelf, with the 80-m shelf break approximately 140 km from shore, is a crucial feature: a winter sea-ice stamukhi zone confines the Mackenzie River outflow in an extensive freshwater estuary over the inner shelf, and sea-ice formation in a shallow flaw-lead polynya on the middle shelf produces brine that promotes mixing and convection (Macdonald et al. Citation1995; Melling & Moore Citation1995; Carmack & Macdonald Citation2002). In summer, the complete loss of ice cover enables wind-influenced events, such as sediment resuspension (Lintern et al. Citation2005) and upwelling, particularly at shelf-edge canyons and headlands (Williams et al. Citation2006; Williams & Carmack Citation2008).
Fig. 2 Temperature–salinity diagrams for all stations shown in a. Note different temperature and salinity scales between (a) and (b). Salinity is given as the practical salinity (SP). Although the data set and the plot contain data from below 1000 dbar, the colour bar is truncated at that depth to maintain the higher resolution at shallower depths.
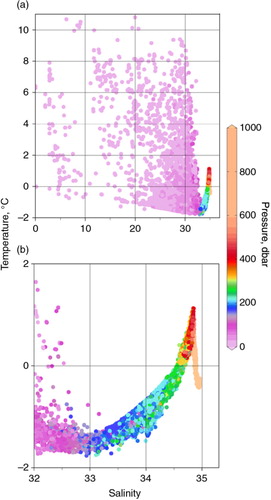
Below the surface layer, the upper halocline hosts nutrient and TIC maxima () originating from high-nutrient and high-TIC Pacific waters that have been further modified by organic matter remineralization beneath the high-productivity surface waters of the Chukchi Shelf (Bates et al. Citation2005; Bates et al. Citation2013) and possibly also the Bering Sea (Mathis et al. Citation2011). Below the upper halocline, the lower halocline overlays warmer Atlantic waters (T>0°C), the core of which is represented by a temperature maximum at 400–500 m (b). Below the temperature maximum, the deep Atlantic layer waters are the product of complex mixing between the high-salinity Atlantic waters and cold, brine-enriched waters derived from dense water production in the shallow flaw-lead polynyas of the pan-Arctic shelves (Östlund et al. Citation1987; Carmack et al. Citation1997; Swift et al. Citation1997; Anderson et al. Citation1999). The bottom waters of the Canada Basin below 2700 m are isolated, with warmer temperatures and older inorganic 14C values than are observed in the Eurasian Basin (Schlosser et al. Citation1994). At least some of the surface waters from the Beaufort Gyre exit through the Canadian Archipelago (Melling et al. Citation1984; McLaughlin et al. Citation2006), and the carbonate system signal of the Pacific waters can be identified throughout the archipelago and into Baffin Bay (Azetsu-Scott et al. Citation2010).
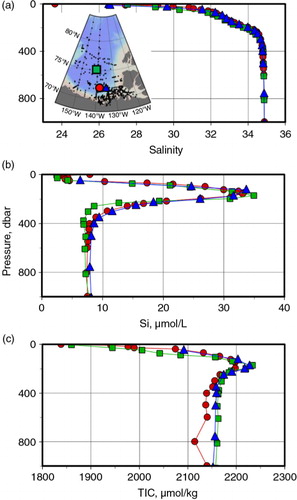
Fig. 3 Typical (a) salinity (SP), (b) silicate and (c) total inorganic carbon (TIC) profiles at depths above 1000 dbar from representative stations in the Beaufort Sea. The map inset in (a) shows the station locations: red circles, 71.87°N, 141.67°W, 24 August 1995; blue triangles, 71.70°N, 134.68°W, 18 August 2002; and green squares, 75.06°N, 140.37°W, 27 August 2005.
The Arctic carbonate system
Our ability to recover information about the state of the marine carbonate system in the past is facilitated by the fact that the carbonate system parameters (dissolved inorganic carbon [DIC]; AT; carbon dioxide partial pressure [pCO2]; and pH) are interdependent, and in seawater, only two need to be measured to fully characterize the system (e.g., Dickson et al. Citation2007), including calcium carbonate saturation states (Ω). Carbonate system chemistry in seawater, the global marine carbon cycle and many of the pitfalls of working in this field have been exhaustively reviewed by a number of people (in addition to Dickson et al. (Citation2007), Zeebe & Wolf-Gladrow (Citation2001) and Emerson & Hedges (Citation2008) are useful texts), but the Arctic Ocean has unique characteristics that need to be considered when trying to understand air–sea CO2 exchange and acidification processes.
The presence of sea ice has profound impacts on inorganic carbon geochemistry in the Arctic Ocean beyond the discredited paradigm that sea ice is a barrier to gas exchange (e.g., Loose et al. Citation2011). Arguably, one of the most important discoveries in the polar carbon cycle over recent years is that hydrodynamic processes associated with sea-ice formation and heat exchange in leads and polynyas appear to enhance direct air–sea gas exchange in the presence of a broken, mobile ice cover (Loose et al. Citation2009; Else et al. Citation2011). Therefore, as the relatively solid multi-year pack ice of the Arctic is replaced with a thinner, more mobile and more seasonal ice cover, atmospheric CO2 drawdown into cold, undersaturated surface waters continues throughout the year and could be increasing (e.g., Steiner et al. Citation2013). An important caveat to that potential increase in the sink of atmospheric CO2 is that summertime sea-ice melt and river outflow stratify the surface waters, limiting the capacity for sustained CO2 drawdown. Not only are many Arctic river waters supersaturated in CO2 (e.g., Pipko et al. Citation2008; Vallières et al. Citation2008), but thin fresh surface mixed layers quickly equilibrate with the atmosphere and then release CO2 as the temperature rises in late summer (Bates & Mathis Citation2009; Cai et al. Citation2010; Mucci et al. Citation2010; Else et al. Citation2013). In addition, when low-salinity surface waters refreeze the following winter, the brine released is insufficient to substantially deepen the mixed layer or form dense shelf waters that can be exported into the deep basins (Melling & Moore Citation1995). On the other hand, greater fetch associated with reduced ice coverage increases the potential for wind mixing, which could offset melt-induced stratification. Finally, as the area of seasonal sea ice increases, total annual sea-ice production also increases, potentially enhancing dense water export to intermediate and deep waters in some areas. How intermediate- and deep-water formation rates respond to the changing ice environment in the Arctic is a critical question in the Arctic carbon cycle: only through deep convection can a more efficient air–sea gas exchange contribute to the solubility pump.
The impact of changing sea-ice conditions on the biological pump is even more ambiguous. On one hand, increasing light availability to surface pelagic communities in the presence of thinner ice and more open water, along with increasing nutrient inputs from upwelling and rivers would be expected to increase primary production (e.g., Bates & Mathis Citation2009). On the other hand, increased stratification limits nutrient supply from subsurface waters (e.g., Tremblay et al. Citation2008; Cai et al. Citation2010; McLaughlin & Carmack Citation2010). In addition, while enhanced river flows may increase nutrient inputs, rivers contribute only a small fraction of the total nutrients supplied to Arctic Ocean surface waters (Macdonald et al. Citation2010), and any benefit from additional nutrients provided by rivers could be offset by the associated increase in turbidity (Macdonald et al. Citation1987) or shading by coloured dissolved organic matter (Granskog et al. Citation2007). Also, much of the primary production in the Arctic Ocean, particularly in the Canadian Arctic, appears to occur below the low-nutrient, relatively fresh surface waters, in subsurface chlorophyll maxima (Carmack et al. Citation2004; Martin et al. Citation2010), where the carbon consumption cannot draw down atmospheric CO2 unless the stratification is eroded by high winds or freezing. Presently, the biological pump in the interior of the Canada Basin seems to be exceptionally weak (Honjo et al. Citation2010), with low productivity and low export, although the south-east Beaufort Sea appears to export a substantial fraction of locally produced biogenic carbon, despite relatively low productivity in the surface waters (Shadwick et al. Citation2011). Because the biological pump is based on carbon removal from surface into deep waters, a vigorous but recycling ecosystem that retains carbon in the surface waters does not contribute to CO2 drawdown over timescales longer than a few months. Therefore, even if primary production in the Arctic Ocean does increase, a sustained increase in atmospheric CO2 drawdown requires a concomitant increase in export production, and it is not clear whether that will happen (e.g., Honjo et al. Citation2010).
As a whole, the Arctic Ocean currently appears to serve as a net atmospheric CO2 sink, with cold surface waters able to absorb carbon dioxide when sea-ice and meteorological conditions allow (e.g., Miller & DiTullio Citation2007; Bates & Mathis Citation2009). Notable localized exceptions, where CO2 outgassing occurs, include the waters along the Siberian coast, where large quantities of terrigenous organic matter are delivered and metabolized (e.g., Semiletov et al. Citation2012) and upwelling areas along coasts and ice edges (Mucci et al. Citation2010; Mathis et al. Citation2012). The geographic diversity of the Arctic Ocean, with different processes dominating carbon cycling in different areas, coupled with opposing climate-change feedbacks, make it difficult to predict how the Arctic Ocean CO2 source/sink balance will change as the climate warms.
The data set
Giesbrecht et al. (Citation2014) give a detailed description of the data set, including quality control and discussions of the analytical methods used and how they changed through time, as well as the temporal and spatial distribution of the data. In brief, because of the high variability in Arctic water masses, coupled with a dearth of deep samples, the internal consistency of this data set is based mainly on the fact that all the TIC and alkalinity measurements were conducted by the same laboratory, with careful intercalibrations whenever methods changed. Although the total data set spans 35 years, from 1974 to 2009, the sampling intensity increased dramatically through that period, from 65 stations during the 1970s to more than 1400 during the period from 2000 to 2009. Most of the samples were analysed for TIC and AT, with pH analyses only from 2003–04. Although more samples were analysed for AT, TIC has a greater temporal coverage. The vast majority of the data is from the summer months (July, August and September) and the only winter data (January, February and March) included are from 1987 and 2004. This data set therefore carries a strong summer bias, and any further analysis and interpretation, particularly if focussed on surface waters, needs to take that bias into consideration.
The total inorganic carbon time series
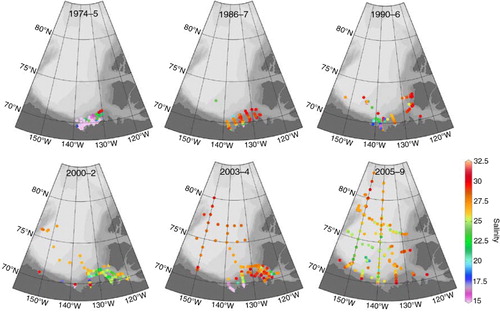
The total inorganic carbon (TIC; in seawater, generally assumed to be primarily DIC) data are the most complete in our data set, with coverage in all four decades between 1974 and the present (). The most striking characteristic of this data set is how the sampling coverage has expanded through time, both in terms of sampling frequency and area. In addition, the surface values are extremely variable, which is largely a product of the complex hydrography of the region, but also of a large interannual variability coupled with varying cruise dates between years. The surface TIC concentrations have generally decreased as we entered the 21st century, mainly as a result of freshening and dilution due to sea-ice melt and river runoff (; Yamamoto-Kawai et al. Citation2009). The large number of low TIC values from 1974 and 1975 primarily reflects a dominance of low-salinity river waters at the stations sampled during those mid-summer expeditions. Note that during the 1986–87 and 2003–04 periods, when winter data are included, a number of higher TIC and salinity values were measured.
Fig. 4 Maps of surface (0–20 dbar) total inorganic carbon (TIC) by date intervals.
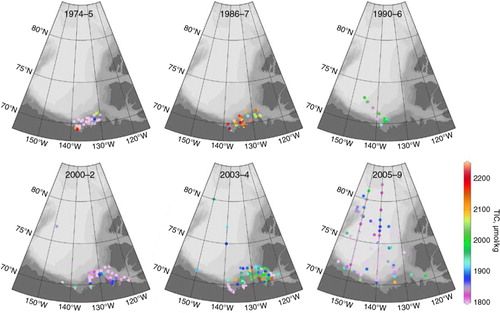
Fig. 5 Maps of surface (0–20 dbar) salinity (SP), by date intervals.
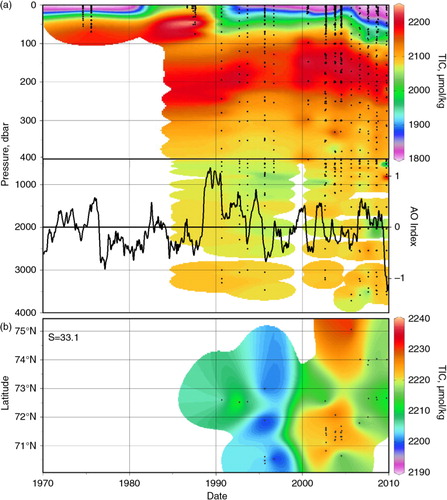
The characteristic profiles for the Beaufort Sea and southern Canada Basin (based on the box in a) show substantial variability in the TIC maximum within the upper halocline, with TIC concentrations intermittently varying by up to 50 µmol/kg (a). The change from high values in 1990–92 to lower values in 1995 is coincident with observations of large-scale water-mass changes, with an increasing Atlantic Water volume and attendant shoaling of the upper halocline in the Canada Basin, as described by McLaughlin et al. (Citation2002). They attributed those changes to atmospheric circulation patterns associated with a positive shift in the Arctic Oscillation that occurred around 1990. However, despite another TIC peak in the upper halocline following an increase in the Arctic Oscillation (AO) index at the turn of the millennium (a), there does not appear to be a relationship between upper halocline TIC and the AO index after that time, and this data set does not support a strong relationship between the AO and the CO2 system chemistry of the halocline. A plot showing TIC at the core of the Pacific Winter Water layer (b) reveals that although TIC is generally increasing, there is no clear geographical pattern in that increase.
Fig. 6 (a) Vertical total inorganic carbon (TIC) distributions in the Beaufort Sea and Canada Basin (within red box on a) through time overlaid with the Arctic Oscillation (AO) index, defined as the difference in sea-level atmospheric pressure anomalies of opposite sign between the Arctic and 37–45°N (data from the US National Oceanic and Atmospheric Administration Climate Prediction Center). (b) TIC on the 33.1 salinity surface, corresponding to the Pacific Water core and defined as salinities between 32.9 and 33.3. Note the different TIC colour scales between (a) and (b).
pCO2 Variations
The CO2 partial pressure in seawater, pCO2SW , is defined as the CO2 partial pressure in a volume of air in equilibrium with that water. Thus, pCO2SW represents the potential for the water to either absorb CO2 from or release it to the atmosphere. The actual air–sea CO2 flux is not only dependent on the partial pressure gradient between the air and the seawater (i.e., the thermodynamic forcing) but also on the rate at which CO2 molecules are able to cross the air–sea boundary (the kinetic control), which is in turn dependent on boundary turbulence and the myriad factors that control it (e.g., Nightingale Citation2009). Although our data set does not contain any direct pCO2SW measurements, pCO2SW can be calculated from TIC, alkalinity, and/or pH with reasonable confidence (e.g., Dickson et al. Citation2007), and we have calculated pCO2SW for all the samples for which we have both TIC and AT measurements.
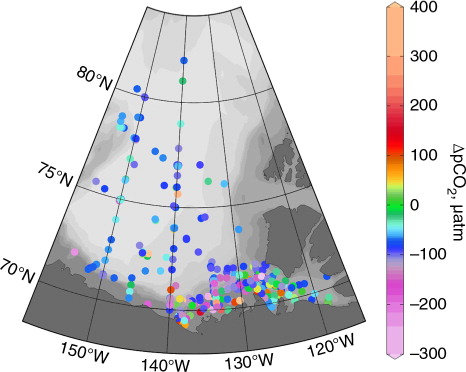
The surface waters in this area have been consistently undersaturated with respect to the atmosphere (). We note that this data set includes samples covering the full annual cycle (as described by Lansard et al. Citation2012), confirming the net CO2 drawdown potential of these waters postulated by other studies (Mucci et al. Citation2010; Shadwick et al. Citation2011; Else et al. Citation2012). Isolated instances of oversaturation are associated with warming ice-melt, coastal and ice-edge upwelling, or river waters, whereas stations showing severe undersaturation accompany phytoplankton blooms. Any trends in these surface pCO2 data associated with climate change are overshadowed by interannual variability and the seasonal distributions of the sampling programs; that is, this data set, alone, is too short and too seasonally biased to identify a climate-change signal in the surface waters.
Fig. 7 Air–sea pCO2 gradient, ▵pCO2, 1974–2009, where negative values indicate surface water (0–20 dbar) undersaturation, with respect to the atmosphere. pCO2SW calculated from measured total inorganic carbon and total alkalinity using the CO2SYS MatLab version (van Heuven et al. Citation2011), with the carbonate system constants of Mehrbach et al. (Citation1973), refit by Dickson & Millero (Citation1987), and the KSO4 constant of Dickson (Citation1990). Atmospheric pCO2 measured at Barrow, Alaska (Keeling et al. Citation2001); in the absence of atmospheric pressure data, mole fraction (in ppm) assumed to be equivalent to partial pressure (in µatm).
Perhaps more informative, from a climate-change perspective, are the variations in the subsurface waters. shows that although a pCO2SW maximum occurs in the upper halocline, at the same depths as the TIC maximum (a), the two parameters are at least somewhat decoupled. Alkalinity variations in this area are also important in setting pCO2SW , and alkalinity appears to have been generally decreasing in the halocline since at least 1994 (). As discussed by Giesbrecht et al. (Citation2014), the alkalinity data from the 1990s may be somewhat high, but that cannot be confirmed, and we have no reason to doubt the changes observed during the first decade of the 2000s. Assuming that the alkalinity data are generally robust, other possible explanations for the observed variations in the halocline include water-mass changes (as per McLaughlin et al. Citation2002) and variations in rates of transport and remineralization of shelf-derived organic carbon (e.g., Bates et al. Citation2013) or of sea-ice formation and brine rejection (as hypothesized by Rysgaard et al. Citation2011).
Fig. 8 Vertical pCO2SW distributions in the Beaufort Sea and Canada Basin (within red box on a) through time. Calculated from measured total inorganic carbon and total alkalinity using the CO2SYS MatLab version (van Heuven et al. Citation2011), with the carbonate system constants of Mehrbach et al. (Citation1973), refit by Dickson & Millero (Citation1987), and the KSO4 constant of Dickson (Citation1990).
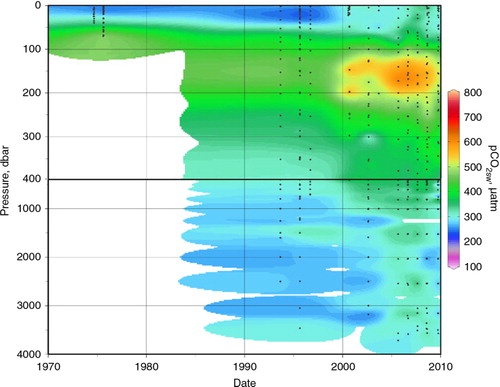
Fig. 9 Vertical distributions of total alkalinity (AT) in the Beaufort Sea and Canada Basin (within red box on a) through time.
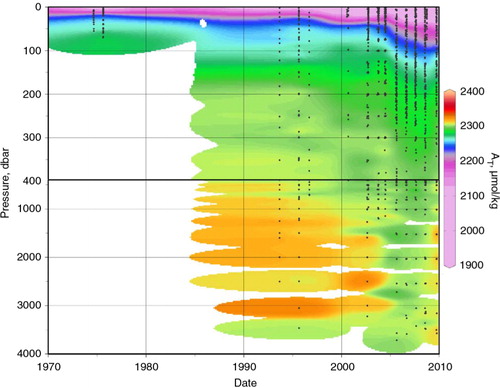
A deconstruction analysis, building on previous approaches pioneered by Takahashi et al. (Citation1993) and more recently used by Metzl et al. (Citation2010), provides additional insight into the causes of the pCO2 variations in the halocline. We parameterized the sensitivity of the calculated pCO2 to variations in temperature, salinity, TIC and AT over the ranges observed in the halocline of the Beaufort Sea using the CO2SYS program (). Using these sensitivity equations, we calculated the fractional impact of the average changes in T, S, TIC and AT between the time intervals 1990–96, 2000–04, and 2005–09 (). The observed changes in temperature and salinity played a negligible role in the pCO2SW increase (b), while both increasing TIC and decreasing alkalinity were important. Although the overall changes between the early 1990s and the 2005–09 period indicate that decreasing alkalinity was the dominant factor in increasing pCO2SW , dividing that time period into smaller intervals shows that increasing TIC concentrations were more important between the early 1990s and the 2000–04 period, and it was only during the first decade of the 2000s that decreasing alkalinity dominated the pCO2SW increase. We note that if the alkalinity data from the 1990s have been overestimated, the actual impact of alkalinity changes on pCO2SW between the 1990–95 and 2000–04 periods would be even lower than shown in b.
Table 2 Sensitivity of calculated pCO2SW to variations in temperature (T), salinity (S), total inorganic carbon (TIC) and total alkalinity (AT) in the Beaufort Sea halocline. We calculated pCO2SW using CO2SYS (Pierrot et al. [Citation2006]; carbonate system constants of Mehrbach et al. [Citation1973], refit by Dickson & Millero [Citation1987] and the KSO4 constant of Dickson [Citation1990]) by varying each parameter over the given range of values observed between 100 and 200 dbar and within the area of 70–75°N, 128–145°W, while holding the other three parameters constant at their average values. Regression lines were fit to plots of calculated pCO2SW versus each parameter to generate the sensitivity equations; second order regressions substantially improved the fits for TIC and AT, but not for T and S. Note that these sensitivity equations are only valid for conditions in the halocline of the Beaufort Sea.
Table 3 (a) Changes in average values of measured parameters and directly calculated pCO2SW within the Beaufort Sea halocline (100–200 dbar). (b) Changes in pCO2SW (µatm) calculated from the changes in measured parameters in (a) and sensitivities in . Comparison between ΔpCO2SW in (a) and ΔpCO2SW (Sum) in (b) indicates the error in our approach to estimating the independent effects of changes in temperature (T), salinity (S), total inorganic carbon (TIC) and total alkalinity (AT) on pCO2SW .
Resolving the specific physical and biogeochemical mechanisms of these changes in TIC and alkalinity within the halocline will require a focussed, station-by-station analysis of the data set, which we leave for future papers. Nonetheless, because the upper halocline waters feed coastal and ice-edge upwelling, further increases in pCO2SW in these waters could have significant implications for the net atmospheric CO2 sink in the Arctic, particularly if upwelling rates also increase with ice retreat (Carmack & Chapman Citation2003).
Carbonate mineral saturation state
While the oceanic CO2 source-versus-sink balance in individual Arctic Ocean regions may change in intensity or direction, the net inorganic carbon content of the oceans is increasing along with atmospheric CO2 levels. Consequently, both seawater pH and calcium carbonate mineral saturation states are decreasing, in a process termed ocean acidification (e.g., Gattuso & Hansson Citation2011). The calcium carbonate saturation state is defined as:1
where the brackets indicate molar concentrations and K'sp is the conditional solubility product of the CaCO3 mineral. Of the two most common CaCO3 polymorphs secreted by marine organisms, aragonite has a higher Ksp and higher solubility than calcite (Mucci Citation1983). Therefore, despite the fact that fewer organisms secrete aragonite than calcite, the aragonite saturation state, ΩAr, is often used as an indicator of seawater corrosiveness and acidification (both natural and anthropogenic).
In the Arctic Ocean, acidification caused by increasing CO2 is exacerbated by freshening resulting from sea-ice melt and river runoff, which also reduce CaCO3 saturation states in surface waters. Because of the relatively high CO2 solubility in the cold Arctic surface waters, in combination with the already high CO2 concentrations in the subsurface Pacific inflow waters, many Arctic Ocean waters are naturally more acidic than is typical of the global ocean, and waters undersaturated with respect to aragonite have already been identified at the surface in the Beaufort Sea (Yamamoto-Kawai et al. Citation2011) and the Canadian Archipelago (Chierici & Fransson Citation2009).
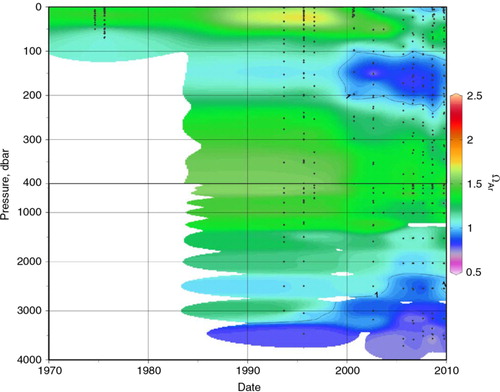
As noted in those earlier studies (Chierici & Fransson Citation2009; Yamamoto-Kawai et al. Citation2011), the Beaufort Sea/Canada Basin area is particularly inclined towards low CaCO3 saturation states, because of sea-ice melt and the high-pCO2SW Pacific water inflow. Therefore, even small direct anthropogenic acidification effects could tip the area into a biologically stressful state. Our time series () shows that the aragonite saturation state (ΩAr) is highly variable but has generally been decreasing in both the upper halocline and deep waters. Not surprisingly, the vertical ΩAr profiles mainly parallel those for pCO2SW , and an analysis similar to that shown in Table and 3 for pCO2SW gave the same results for ΩAr. Bottom water saturation states, which are also depressed by high hydrostatic pressure, are of particular concern, because benthic communities are generally less mobile than their pelagic neighbours, and organic matter remineralization in oxic surface sediments releases additional CO2 to the bottom waters (Anderson et al. Citation2011).
Fig. 10 Vertical distributions of aragonite saturation state (ΩAr; Eqn. 1) in the Beaufort Sea and Canada Basin (within red box in a) through time. ΩAr=1 contour shown, indicating undersaturated zones in dark blue and purple. ΩAr calculated from measured total inorganic carbon and total alkalinity using the CO2SYS MatLab version (van Heuven et al. Citation2011), with the carbonate system constants of Mehrbach et al. (Citation1973), refit by Dickson & Millero (Citation1987), and the KSO4 constant of Dickson (Citation1990).
Sustaining future observations
This data set results from the vision and tenacity of a handful of scientists, who have been driven to collect samples whenever they could, regardless of an explicit mandate or lack thereof. The effort has often been limited by budgetary and logistical constraints, and the benefits of the substantial upturn in resources (financial and infrastructure) and access (due to reduced coverage by thick ice) to conduct this research over the last decade are obvious; recent intensive process studies, including those during the 2007–08 International Polar Year, have dramatically increased our understanding of what currently controls the inorganic carbon system of the Arctic (e.g., Mucci et al. Citation2010; Anderson et al. Citation2011; Shadwick et al. Citation2011; Yamamoto-Kawai et al. Citation2011; Else et al. Citation2012; Semiletov et al. Citation2012). Nevertheless, although the insights derived from new data, traditional knowledge (e.g., Barber et al. Citation2012) and historical data, such as those presented here, are improving how processes are represented and parameterized in predictive models (Deal et al. Citation2014), the observations to date are still insufficient to distinguish between natural variability and climate change–associated trends (e.g., Burroughs Citation2007). For that, we need to systematically collect high-resolution (both in space and time) data, not only for the inorganic carbon system, but also for all the ancillary parameters necessary to understand those carbon data (e.g., δ18O, δ13C, Δ14C, dissolved and particulate organic carbon, vertical flux).
Although sea-ice retreat is easing our logistical constraints in some ways, in other ways, the loss of a stable ice cover is making it more difficult to access both coastal and open ocean waters, especially during the winter and shoulder seasons, periods that are still poorly represented in our data sets, resulting in a strong “summer” bias in our understanding of the Arctic Ocean. The high financial costs associated with research in remote areas also continue to be a limiting factor. Collecting the kind of data required to understand and ultimately predict carbonate system changes in the Arctic will require implementation of an extensive network of automated instruments (e.g., Dickson Citation2006). The stability and precision of in situ pCO2SW and pH sensors are approaching thresholds necessary for effective seawater monitoring, and although a more mobile ice pack continues to complicate bottom mooring deployments in the Arctic, ice-tethered profilers and gliders show promise (e.g., Jackson et al. Citation2012). Shipboard work will continue to be required for servicing the instrument network, ground-truthing the in situ data, and conducting process studies, but as is evident from the difficulty in interpreting the data set we present here, ship-based sampling, alone, will not generate the quantity and resolution of data required to answer the pressing questions we will face in the coming decades and centuries about how the Arctic is responding to climate change.
Acknowledgements
We thank the Fisheries and Oceans Canada International Governance Strategy for funding the rescue and compilation of this data set and Paul Lyon for pointing out the opportunity and then managing the funds. We also thank everyone who conceived and managed the scientific programmes that collected these data, particularly Eddy Carmack, Keith Johnson, C.S. Wong and Sarah Zimmermann. In addition, our truly heartfelt gratitude goes out to everyone who ever filled a DIC bottle or analysed a sample. In particular, while this manuscript was in revision, Marty Davelaar courageously unearthed and analysed more than 200 samples from the 1970s that were discovered in the Institute of Ocean Sciences sample archive during the data recovery project. We also thank two anonymous reviewers whose comments substantially improved the paper. The figures were created using the Ocean Data View software package (R. Schlitzer; http://odv.awi.de).
Notes
A Corrigendum has been published for this paper. Please see http://www.polarresearch.net/index.php/polar/article/view/31998
Related Research Data
References
- Anderson L.G., Björk G., Jutterström S., Pipko I., Shakhova N., Semiletov I., Wåhlström I. East Siberian Sea, an Arctic region of very high biogeochemical activity. Biogeosciences. 2011; 8: 1745–1754.
- Anderson L.G., Jones E.P., Rudels B. Ventilation of the Arctic Ocean estimated by a plume entrainment model constrained by CFCs. Journal of Geophysical Research—Oceans. 1999; 104: 13423–13429.
- Asplin M.G., Lukovich J.V., Barber D.G. Atmospheric forcing of the Beaufort Sea ice gyre: surface pressure climatology and sea ice motion. Journal of Geophysical Research—Oceans. 2009; 114: C00A06.
- Azetsu-Scott K., Clarke A., Falkner K., Hamilton J., Jones E.P., Lee C., Petrie B., Prinsenberg S., Starr M., Yeats P. Calcium carbonate saturation states in the waters of the Canadian Arctic Archipelago and the Labrador Sea. Journal of Geophysical Research—Oceans. 2010; 115: C11021.
- Barber D.G., Asplin M.G., Raddatz R.L., Candlish L.M., Nickels S., Meakin S., Hochheim K.P., Lukovich J.V., Galley R.J., Prinsenberg S.J. Change and variability in sea ice during the 2007–2008 Canadian International Polar Year program. Climatic Change. 2012; 115: 115–133.
- Barber D.G., Hanesiak J.M. Meteorological forcing of sea ice concentrations in the southern Beaufort Sea over the period 1979 to 2000. Journal of Geophysical Research—Oceans. 2004; 109: C06014.
- Bates N.R., Best M.H.P., Hansell D.A. Spatio-temporal distribution of dissolved inorganic carbon and net community production in the Chukchi and Beaufort seas. Deep-Sea Research Part II. 2005; 52: 3303–3323.
- Bates N.R., Mathis J.T. The Arctic Ocean marine carbon cycle: evaluation of air–sea CO2 exchanges, ocean acidification impacts and potential feedbacks. Biogeosciences. 2009; 6: 2433–2459.
- Bates N.R., Orchowska M.I., Garley R., Mathis J.T. Summertime calcium carbonate undersaturation in shelf waters of the western Arctic Ocean—how biological processes exacerbate the impact of ocean acidification. Biogeosciences. 2013; 10: 5281–5309.
- Bringué M., Rochon A. Late Holocene paleoceanography and climate variability over the Mackenzie Slope (Beaufort Sea, Canadian Arctic). Marine Geology. 2012; 291–294: 83–96.
- Burroughs W.J. Climate change: a multidisciplinary approach. 2007; Cambridge: Cambridge University Press.
- Cai W.-J., Chen L., Chen B., Gao Z., Lee S.H., Chen J., Pierrot D., Sullivan K., Wang Y., Hu X., Huang W.-J., Zhang Y., Xu S., Murata A., Grebmeier J.M., Jones E.P., Zhang H. Decrease in the CO2 uptake capacity in an ice-free Arctic Ocean basin. Science. 2010; 329: 556–559.
- Carmack E.C., Aagaard K., Swift J.H., Macdonald R.W., McLaughlin F.A., Jones E.P., Perkin R.D., Smith J.N., Ellis K.M., Killius L.R. Changes in temperature and tracer distributions within the Arctic Ocean: results from the 1994 Arctic Ocean section. Deep-Sea Research Part II. 1997; 44: 1487–1502.
- Carmack E., Chapman D.C. Wind-driven shelf/basin exchange on an Arctic shelf: the joint roles of ice cover extent and shelf-break bathymetry. Geophysical Research Letters. 2003; 30 article no. 1778.
- Carmack E.C., Macdonald R.W. Oceanography of the Canadian shelf of the Beaufort Sea: a setting for marine life. Arctic. 2002; 55(S1): 29–45.
- Carmack E.C., Macdonald R.W., Jasper S. Phytoplankton productivity on the Canadian Shelf of the Beaufort Sea. Marine Ecology Progress Series. 2004; 277: 37–50.
- Chierici M., Fransson A. Calcium carbonate saturation in the surface water of the Arctic Ocean: undersaturation in freshwater influenced shelves. Biogeosciences. 2009; 6: 2421–2431.
- Coachman L.K., Barnes C.A. The contribution of Bering Sea water to the Arctic Ocean. Arctic. 1961; 14: 146–161.
- Deal C.J., Steiner N., Christian J., Kinney J.C., Denman K., Elliott S., Gibson G., Jin M., Lavoie D., Lee S., Lee W., Maslowski W., Wang J., Watanabe E. Grebmeier J.M., Maslowski W. Progress and challenges in biogeochemical modeling of the Pacific Arctic Region. The Pacific Arctic region: ecosystem status and trends in a rapidly changing environment. 2014; Berlin: Springer. 393–445.
- Dickson A.G. Standard potential of the reaction: AgCl(s)+1/2H2(g)=Ag(s)+HCl(aq), and the standard acidity constant of the ion HSO4 − in synthetic sea water from 273.15 to 318.15 K. Journal of Chemical Thermodynamics. 1990; 22: 113–127.
- Dickson A.G., Millero F.J. A comparison of the equilibrium constants for the dissociation of carbonic acid in seawater media. Deep-Sea Research Part A. 1987; 34: 1733–1743.
- Dickson A.G., Sabine C.L., Christian J.R. Guide to best practices for ocean CO2 measurements. PICES Special Publication 3. 2007; Sidney, BC: North Pacific Marine Science Organization.
- Dickson B. The integrated Arctic Ocean Observing System (iAOOS): an AOSB-CliC observing plan for the International Polar Year. Oceanologia. 2006; 48: 5–21.
- Else B.G.T., Galley R.J., Lansard B., Barber D.G., Brown K., Miller L.A., Mucci A., Papakyriakou T.N., Tremblay J.-É., Rysgaard S. Further observations of a decreasing atmospheric CO2 uptake capacity in the Canada Basin (Arctic Ocean) due to sea ice loss. Geophysical Research Letters. 2013; 40: 1132–1137.
- Else B.G.T., Papakyriakou T.N., Galley R.J., Drennan W.M., Miller L.A., Thomas H. Wintertime CO2 fluxes in an Arctic polynya using eddy covariance: evidence for enhanced air–sea gas transfer during ice formation. Journal of Geophysical Research—Oceans. 2011; 116: C00G03.
- Else B.G.T., Papakyriakou T.N., Galley R.J., Mucci A., Gosselin M., Miller L.A., Shadwick E.H., Thomas H. Annual cycles of pCO2sw in the southeastern Beaufort Sea: new understandings of air–sea CO2 exchange in Arctic polynya regions. Journal of Geophysical Research—Oceans. 2012; 117: C00G13.
- Emerson S.R., Hedges J.I. Chemical oceanography and the marine carbon cycle. 2008; New York: Cambridge University Press.
- Gattuso J.-P., Hansson L. Gattuso J.-P., Hansson L. Ocean acidification: background and history. Ocean acidification. 2011; Oxford: Oxford University Press. 1–20.
- Giesbrecht K.E., Miller L.A., Davelaar M., Zimmermann S., Carmack E., Johnson W.K., Macdonald R.W., McLaughlin F., Mucci A., Williams W.J., Wong C.S., Yamamoto-Kawai M. Measurements of the dissolved inorganic carbon system and associated biogeochemical parameters in the Canadian Arctic, 1974–2009. Earth System Science Data. 2014; 6: 91–104.
- Granskog M.A., Macdonald R.W., Mundy C.-J., Barber D.G. Distribution, characteristics and potential impacts of chromophoric dissolved organic matter (CDOM) in Hudson Strait and Hudson Bay, Canada. Continental Shelf Research. 2007; 27: 2032–2050.
- Honjo S., Krishfield R.A., Eglinton T.I., Manganini S.J., Kemp J.N., Doherty K., Hwang J., McKee T.K., Takizawa T. Biological pump processes in the cryopelagic and hemipelagic Arctic Ocean: Canada Basin and Chukchi Rise. Progress in Oceanography. 2010; 85: 137–170.
- Jackson J.M., Williams W.J., Carmack E.C. Winter sea-ice melt in the Canada Basin, Arctic Ocean. Geophysical Research Letters. 2012; 39: L03603.
- Kaltin S., Anderson L.G. Uptake of atmospheric carbon dioxide in Arctic shelf seas: evaluation of the relative importance of processes that influence pCO2 in water transported over the Bering–Chukchi Sea shelf. Marine Chemistry. 2005; 94: 67–79.
- Keeling C.D., Piper S.C., Bacastow R.B., Wahlen M., Whorf T.P., Heimann M., Meijer H.A. Exchanges of atmospheric CO2 and 13CO2 with the terrestrial biosphere and oceans from 1978 to 2000. I. Global aspects. SIO Reference Series 01–06. 2001; San Diego, CA: Scripps Institution of Oceanography.
- Lansard B., Mucci A., Miller L.A., Macdonald R.W., Gratton Y. Seasonal variability of water mass distribution in the southeastern Beaufort Sea determined by total alkalinity and δ 18O. Journal of Geophysical Research—Oceans. 2012; 117: C03003.
- Lintern D.G., Hill P.R., Solomon S., Walker T.R., Grant J. Erodibility, sediment strength and storm resuspension in Kugmallit Bay, Beaufort Sea. Paper presented at the 12th Canadian Coastal Conference. 2005. 6–9 November, Dartmouth, Nova Scotia.
- Loose B., McGillis W.R., Schlosser P., Perovich D., Takahashi T. Effects of freezing, growth, and ice cover on gas transport processes in laboratory seawater experiments. Geophysical Research Letters. 2009; 36: L05603.
- Loose B., Miller L.A., Elliott S., Papakyriakou T. Sea ice biogeochemistry and material transport across the frozen interface. Oceanography. 2011; 24: 202–218.
- Macdonald R.W., Anderson L.G., Christensen J.P., Miller L.A., Semiletov I.P., Stein R. Liu K.-K. The Arctic Ocean. Carbon and nutrient fluxes in continental margins. 2010; Heidelberg: Springer. 291–303.
- Macdonald R.W., Paton D.W., Carmack E.C., Omstedt A. The freshwater budget and under-ice spreading of Mackenzie River water in the Canadian Beaufort Sea based on salinity and 18O/16O measurements in water and ice. Journal of Geophysical Research—Oceans. 1995; 100: 895–919.
- Macdonald R.W., Wong C.S., Erickson P.E. The distribution of nutrients in the southeastern Beaufort Sea: implications for water circulation and primary production. Journal of Geophysical Research—Oceans. 1987; 92: 2939–2952.
- Martin J., Tremblay J.-É., Gagnon J., Tremblay G., Lapoussière A., Jose C., Poulin M., Gosselin M., Gratton Y., Michel C. Prevalence, structure and properties of subsurface chlorophyll maxima in Canadian Arctic waters. Marine Ecology Progress Series. 2010; 412: 69–84.
- Mathis J.T., Cross J.N., Bates N.R. Coupling primary production and terrestrial runoff to ocean acidification and carbonate mineral suppression in the eastern Bering Sea. Journal of Geophysical Research—Oceans. 2011; 116: C02030.
- Mathis J.T., Pickart R.S., Byrne R.H., McNeil C.L., Moore G.W.K., Juranek L.W., Liu X., Ma J., Easley R.A., Elliot M.M., Cross J.N., Reisdorph S.C., Bahr F., Morison J., Lichendorf T., Feely R.A. Storm-induced upwelling of high pCO2 waters onto the continental shelf of the western Arctic Ocean and implications for carbonate mineral saturation states. Geophysical Research Letters. 2012; 39: L07606.
- McLaughlin F.A., Carmack E.C. Deepening of the nutricline and chlorophyll maximum in the Canada Basin interior, 2003–2009. Geophysical Research Letters. 2010; 37: L24602.
- McLaughlin F.A., Carmack E.C., Ingram R.G., Williams W.J., Michel C. Robinson A.R., Brink K.H. Oceanography of the Northwest Passage. The global coastal ocean: interdisciplinary regional studies and syntheses. 2006; Cambridge, MA: Harvard University Press. 1213–1244.
- McLaughlin F.A., Carmack E.C., Macdonald R.W., Melling H., Swift J.H., Wheeler P.A., Sherr B.F., Sherr E.B. The joint roles of Pacific and Atlantic-origin waters in the Canada Basin, 1997–1998. Deep-Sea Research Part I. 2004; 51: 107–128.
- McLaughlin F., Carmack E., Macdonald R., Weaver A.J., Smith J. The Canada Basin, 1989–1995: upstream events and far-field effects of the Barents Sea branch. Journal of Geophysical Research—Oceans. 2002; 107 article no. 3082.
- Meehl G.A., Stocker T.F., Collins W.D., Friedlingstein P., Gaye A.T., Gregory J.M., Kitoh A., Knutti R., Murphy J.M., Noda A., Raper S.C.B., Watterson I.G., Weaver A.J., Zhao Z.-C. Solomon S. Global climate projections. Climate change 2007. The physical science basis: contribution of Working Group I to the fourth assessment report of the Intergovernmental Panel on Climate Change. 2007; New York: Cambridge University Press. 747–845.
- Mehrbach C., Culberson C.H., Hawley J.E., Pytkowicz R.M. Measurement of the apparent dissociation constants of carbonic acid in seawater at atmospheric pressure. Limnology and Oceanography. 1973; 18: 897–907.
- Melling H. The formation of a haline shelf front in wintertime in an ice-covered arctic sea. Continental Shelf Research. 1993; 13: 1123–1147.
- Melling H. Hydrographic changes in the Canada Basin of the Arctic Ocean, 1979–1996. Journal of Geophysical Research—Oceans. 1998; 103: 7637–7645.
- Melling H., Lake R.A., Topham D.R., Fissel D.B. Oceanic thermal structure in the western Canadian Arctic. Continental Shelf Research. 1984; 3: 233–258.
- Melling H., Moore R.M. Modification of halocline source waters during freezing on the Beaufort Sea shelf: evidence from oxygen isotopes and dissolved nutrients. Continental Shelf Research. 1995; 15: 89–113.
- Metzl N., Corbière A., Reverdin G., Lenton A., Takahashi T., Olsen A., Johannessen T., Pierrot D., Wanninkhof R., Ólafsdóttir S.R., Olafsson J., Ramonet M. Recent acceleration of the sea surface fCO2 growth rate in the North Atlantic subpolar gyre (1993–2008) revealed by winter observations. Global Biogeochemical Cycles. 2010; 24: GB4004.
- Miller L.A., DiTullio G.R. Smith W.O., Barber D.G. Gas fluxes and dynamics in polynyas. Polynyas: windows to the world. 2007; Amsterdam: Elsevier. 163–191.
- Miller L.A., Papakyriakou T.N., Collins R.E., Deming J.W., Ehn J.K., Macdonald R.W., Mucci A., Owens O., Raudsepp M., Sutherland N. Carbon dynamics in sea ice: a winter flux time series. Journal of Geophysical Research—Oceans. 2011; 116: C02028.
- Mucci A. The solubility of calcite and aragonite in seawater at various salinities, temperatures, and one atmosphere total pressure. American Journal of Science. 1983; 283: 780–799.
- Mucci A., Lansard B., Miller L.A., Papakyriakou T.N. CO2 fluxes across the air–sea interface in the southeastern Beaufort Sea: ice-free period. Journal of Geophysical Research—Oceans. 2010; 115: C04003.
- Mucci A., Starr M., Gilbert D., Sundby B. Acidification of Lower St. Lawrence Estuary bottom waters. Atmosphere–Ocean. 2011; 49: 206–218.
- Nightingale P.D. Le Quéré C., Saltzman E.S. Air–sea gas exchange. Surface ocean–lower atmosphere processes. 2009; Washington, DC: American Geophysical Union. 69–97.
- Östlund H.G., Possnert G., Swift J.H. Ventilation rate of the deep Arctic Ocean from carbon 14 data. Journal of Geophysical Research—Oceans. 1987; 92: 3769–3777.
- Overland J.E. Meteorology of the Beaufort Sea. Journal of Geophysical Research—Oceans. 2009; 114: C00A07.
- Perovich D.K., Richter-Menge J.A. Loss of sea ice in the Arctic. Annual Review of Marine Science. 2009; 1: 417–441.
- Pierrot D., Lewis E., Wallace D.W.R. MS Excel program developed for CO2 system calculations. ORNL/CDIAC-105a. 2006; Oak Ridge, TN: Carbon Dioxide Information Analysis Center, Oak Ridge National Laboratory, US Department of Energy.
- Pipko I.I., Semiletov I.P., Tishchenko P. Ya., Pugach S.P., Savel'eva N.I. Variability of the carbonate system parameters in the coast–shelf zone of the East Siberian Sea during the autumn season. Oceanology. 2008; 48: 54–67.
- Rysgaard S., Bendtsen J., Delille B., Dieckmann G.S., Glud R.N., Kennedy H., Mortensen J., Papadimitriou S., Thomas D.N., Tison J.-L. Sea ice contribution to the air–sea CO2 exchange in the Arctic and Southern oceans. Tellus Series B. 2011; 63: 823–830.
- Schiermeier Q. Ice loss shifts Arctic cycles. Nature. 2012; 489: 185–186.
- Schlosser P., Kromer B., Östlund G., Ekwurzel B., Bönisch G., Loosli H.H., Purtschert R. On the 14C and 39Ar distribution in the central Arctic Ocean: implications for deep water formation. Radiocarbon. 1994; 36: 327–345.
- Semiletov I.P., Shakhova N.E., Sergienko V.I., Pipko I.I., Dudarev O.V. On carbon transport and fate in the East Siberian Arctic land–shelf–atmosphere system. Environmental Research Letters. 2012; 7: 015201.
- Shadwick E.H., Thomas H., Chierici M., Else B., Fransson A., Michel C., Miller L.A., Mucci A., Niemi A., Papakyriakou T.N., Tremblay J.-É. Seasonal variability of the inorganic carbon system in the Amundsen Gulf region of the southeastern Beaufort Sea. Limnology and Oceanography. 2011; 56: 303–322.
- Steiner N.S., Lee W.G., Christian J.R. Enhanced gas fluxes in small sea ice leads and cracks: effects on CO2 exchange and ocean acidification. Journal of Geophysical Research—Oceans. 2013; 118: 1195–1205.
- Stroeve J., Holland M.M., Meier W., Scambos T., Serreze M. Arctic sea ice decline: faster than forecast. Geophysical Research Letters. 2007; 34: L09501.
- Stroeve J.C., Serreze M.C., Holland M.M., Kay J.E., Malanik J., Barrett A.P. The Arctic's rapidly shrinking sea ice cover: a research synthesis. Climatic Change. 2012; 110: 1005–1027.
- Swift J.H., Jones E.P., Aagaard K., Carmack E.C., Hingston M., Macdonald R.W., McLaughlin F.A., Perkin R.G. Waters of the Makarov and Canada basins. Deep-Sea Research Part II. 1997; 44: 1503–1529.
- Takahashi T., Olafsson J., Goddard J.G., Chipman D.W., Sutherland S.C. Seasonal variation of CO2 and nutrients in the high-latitude surface oceans: a comparative study. Global Biogeochemical Cycles. 1993; 7: 843–878.
- Thompson D.W.J., Wallace J.M. The Arctic Oscillation signature in the wintertime geopotential height and temperature fields. Geophysical Research Letters. 1998; 25: 1297–1300.
- Tremblay J.-É., Simpson K., Martin J., Miller L., Gratton Y., Barber D., Price N.M. Vertical stability and the annual dynamics of nutrients and chlorophyll fluorescence in the coastal, southeast Beaufort Sea. Journal of Geophysical Research—Oceans. 2008; 113: C07S90.
- Vallières C., Retamal L., Ramlal P., Osburn C.L., Vincent W.F. Bacterial production and microbial food web structure in a large Arctic river and the coastal Arctic Ocean. Journal of Marine Systems. 2008; 74: 756–773.
- van Heuven S., Pierrot D., Rae J.W.B., Lewis E., Wallace D.W.R. MATLAB program developed for CO2 system calculations. ORNL/CDIAC-105b. 2011; Oak Ridge, TN: Carbon Dioxide Information Analysis Center, Oak Ridge National Laboratory, US Department of Energy.
- Williams W.J., Carmack E.C. Combined effect of wind-forcing and isobath divergence on upwelling at Cape Bathurst, Beaufort Sea. Journal of Marine Research. 2008; 66: 645–663.
- Williams W.J., Carmack E.C., Shimada K., Melling H., Aagaard K., Macdonald R.W., Ingram R.G. Joint effects of wind and ice motion in forcing upwelling in Mackenzie Trough, Beaufort Sea. Continental Shelf Research. 2006; 26: 2352–2366.
- Wong C.S., Xie L., Hsieh W.W. Variations in nutrients, carbon and other hydrographic parameters related to the 1976/77 and 1988/89 regime shifts in the sub-Arctic Northeast Pacific. Progress in Oceanography. 2007; 75: 326–342.
- Yamamoto-Kawai M., McLaughlin F.A., Carmack E.C. Effects of ocean acidification, warming and melting of sea ice on aragonite saturation of the Canada Basin surface water. Geophysical Research Letters. 2011; 38: L03601.
- Yamamoto-Kawai M., McLaughlin F.A., Carmack E.C., Nishino S., Shimada K., Kurita N. Surface freshening of the Canada Basin, 2003–2007: river runoff versus sea ice meltwater. Journal of Geophysical Research—Oceans. 2009; 114: C00A05.
- Zeebe R.E., Wolf-Gladrow D. CO2 in seawater: equilibrium, kinetics, isotopes. 2001; San Francisco, CA: Elsevier.