
Abstract
On the Antarctic Peninsula, lichens are the most diverse botanical component of the terrestrial ecosystem. However, detailed information on the distribution of lichens on the Antarctic Peninsula region is scarce, and the data available exhibit significant heterogeneity in sampling frequency and effort. Satellite remote sensing, in particular the use of the Normalized Difference Vegetation Index (NDVI), has facilitated determination of vegetation richness and cover distribution in some remote and otherwise inaccessible environments. However, it is known that using NDVI for the detection of vegetation can overlook the presence of lichens even if their land cover is extensive. We tested the use of known spectra of lichens in a matched filtering technique for the detection and mapping of lichen-covered land from remote sensing imagery on the Antarctic Peninsula, using data on lichen presence collected by citizen scientists and other non-specialists as ground truthing. Our results confirm that the use of this approach allows for the detection of lichen flora on the Antarctic Peninsula, showing an improvement over the use of NDVI alone for the mapping of flora in this area.
To access the supplementary material for this article, please see supplementary files under Article Tools online.
On the Antarctic Peninsula, lichens and bryophytes are the major botanical component of the terrestrial ecosystem (Smith Citation1984; Øvstedal & Smith Citation2001; Convey Citation2013). There are 404 described species of lichen documented in Antarctica, with 264 of these solely on the Antarctic Peninsula (Øvstedal & Smith Citation2001, Citation2009). Crustose, fruticose and foliose lichens are important or dominant elements in the extensive cryptogamic communities that form the typical vegetation of the Antarctic Peninsula region, especially along coasts (Øvstedal & Smith Citation2001; Convey Citation2013). However, even though the overall diversity of the Antarctic Peninsula flora is well known, most studies have focused on a limited number of locations. Detailed information on the distribution of lichens in the Antarctic Peninsula region is scarce, and the data available exhibit significant heterogeneity in sampling frequency and effort (Casanovas, Lynch & Fagan Citation2013), as is typical of existing biological data across the Antarctic terrestrial biome (Adams et al. Citation2006; Chown & Convey Citation2007; Terauds et al. Citation2012).
The relative paucity of botanists working in Antarctica, combined with logistic limitations, makes traditional methods for studying biodiversity at a large scale impractical (Chown & Convey Citation2007; Terauds et al. Citation2012; Casanovas, Lynch & Fagan Citation2013). With deglaciation exposing new habitat (Cook et al. Citation2005; Clarke et al. Citation2007; Convey Citation2011) and the increase in both tourism and national research operations in the area (Tin et al. Citation2009; Liggett et al. Citation2011), cost-effective and pragmatic but reliable wide-scale survey methods are needed to accelerate assessments of biodiversity (Wall et al. Citation2011).
Satellite remote sensing has facilitated determination of vegetation richness and cover distribution and can be used where field access is difficult (e.g., Stow et al. Citation2004; Waser et al. Citation2004; Johansen & Karlsen Citation2005; Laidler et al. Citation2008; Tommervik et al. Citation2012). Most studies which consider vegetation, including lichens, are based on the analysis of the Normalized Difference Vegetation Index (NDVI; Rouse et al. Citation1974). NDVI is based on the ratio of visible red light and near-infrared (Gates Citation2003) and has been used as a proxy to indicate the presence of chlorophyll in an imaged land area. On the Antarctic Peninsula region, Fretwell et al. (Citation2011) presented the first small-scale map of vegetation generated using NDVI. However, with ground truthing for the classification of the imagery based on only two islands, they recognized the need for further work spanning a wider range of sites and habitats. Also, it has been recognized that work using NDVI to detect vegetation might overlook the presence of lichens even if their land cover is extensive (Petzold & Goward Citation1988). The reflectance spectra of lichens and vascular plants are different in both the visible and the infrared portions of the solar spectrum (0.4–1 µm); in particular, the depth of the visible to near-infrared step (0.6–0.7 µm) is characteristically smaller in lichens (Petzold & Goward Citation1988; Haselwimmer & Fretwell Citation2009). Therefore, at high latitudes, where lichen contribution to vegetation diversity and extent increases in importance, NDVI would show decreasing spectral vegetation values, and areas completely covered with lichens can be erroneously classified as having sparse cover of vascular plants (Petzold & Goward Citation1988). An alternative technique for detecting vegetation from satellite images is image classification (supervised or unsupervised). This classifies an entire pixel into a discrete land cover type, needing the land cover type not only to be of sufficient extent to completely dominate a pixel, but to dominate several pixels in the area of interest as samples for training and validation. As the vegetation communities on the Antarctic Peninsula are typically mixed as well as including neighbouring rocks, soil and/or snow at the scale of mid-resolution satellite images, these techniques are inappropriate.
Here, because of the good development of lichen-dominated communities in the Antarctic Peninsula region (Øvstedal & Smith Citation2001), we trial the potential of mapping their distribution directly by matching image pixel spectra with the reference spectra of lichens using a matched filtering algorithm (Harsanyi & Chang Citation1994) applied to mid-resolution (30 m) satellite imagery. This is a more appropriate technique, as partial unmixing can detect the presence of a given material (in our case lichens) at a sub-pixel scale. Such techniques have been widely used in lithological studies (e.g., Rowan & Mars Citation2003; Harris et al. Citation2005; Bedini Citation2011; Grebby et al. Citation2011) and have been recently applied for the mapping of lichens using very high-resolution imagery (Black et al. Citation2014; Rouse et al. Citation1974). The widely available mid-resolution satellite imagery, from satellite platforms such as Landsat, has been used for the study of vegetation in remote areas including work in the Arctic (e.g., Johansen & Karlsen Citation2005) and Antarctic (Fretwell et al. Citation2011). However, matched filtering techniques have not been applied using this mid-resolution satellite imagery. If successful, this approach will give much improved information on sub-pixel vegetation cover, community extent and composition.
Furthermore, citizen science approaches provide a practicable and useful tool for surveying areas where specialist expertise is unavailable (Krell Citation2004; Casanovas et al. Citation2014), providing a means of enhancing available biodiversity data. Data on lichen presence for visitor sites collected by means of photographic documentation by citizen scientists and other non-specialists are available for a number of visitor sites on the Antarctic Peninsula (Casanovas, Lynch, Fagan & Naveen Citation2013), and these data can be used for ground truthing in remote sensing studies.
Here, we test the use of known spectra of lichens for the detection and mapping of lichen-covered land from remote sensing imagery on the Antarctic Peninsula, using the data on lichen presence mentioned above as ground truthing. We also compare distribution maps generated using matched filtering of lichen spectra with those derived using NDVI. Our data demonstrate the potential for a more comprehensive and accurately differentiated description of the extent of the different major types of terrestrial vegetation on the Antarctic Peninsula region than is currently available. Such an output also has particular importance in enhancing the ability of the Antarctic Treaty Parties to assess remotely the evidence of cumulative impacts at locations under particularly intense pressure from human activity, such as popular visitor sites and areas that are the focus of research activity or other operations.
Methods
Lichen spectra
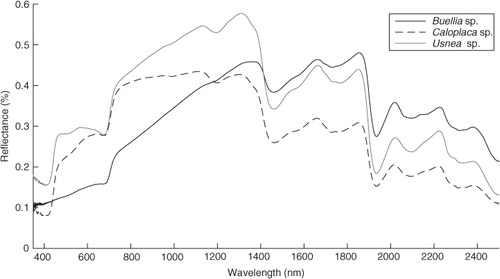
The lichen spectra used in this study correspond to Buellia sp., Usnea sp. and Caloplaca sp. These genera of lichen are very common and well represented in maritime Antarctic terrestrial ecosystems. Communities where Buellia and Caloplaca (two of several nitrophilous taxa present in the region) are abundant cover large expanses of coastal areas that are influenced by nutrients derived from seabird colonies and other vertebrate-derived nutrient sources (Øvstedal & Smith Citation2001). Usnea is one of the main components of another prominent coastal lichen community, with several species often covering from a few to several hundred square metres of coastal areas (Øvstedal & Smith Citation2001). The spectra of these three genera were collected on Lagoon Island (67°35′ S, 68°16′ W), Ryder Bay, off the west coast of the Antarctic Peninsula, where they are abundant.
Lichen spectra were collected using an Analytical Spectral Device (ASD; Boulder, CO, USA) FieldSpec Pro 3® spectrometer during a field campaign in January 2014. The ASD spectrometer records continuous spectra across the 350–2500 nm spectral range, with a spectral resolution of 3 nm at 700 nm, 10 nm at 1400 nm, and 12 nm at 2100 nm. The ASD spectrometer was configured to acquire spectral reflectance measurements in “white reference” mode, where a white Spectralon® panel (Labsphere, North Sutton, NH, USA) was used as the reference target; relative reflectance spectra of the materials under investigation are calculated by the instrument by dividing the measured white reference radiance by the measured target radiance. The ASD spectrometer was configured so that each spectrum collected represented the average of 50 individual spectral measurements. Re-calibration with the white reference panel was undertaken before collection of each spectrum to ensure the spectra were not affected by instrument drift. Spectral measurements were collected from exposed surfaces of the target, using a contact reflectance probe (which includes its own calibrated light source) with a target region of approximately 1 cm2. The source spectra for the three species of lichen used in this study are shown in .
Fig. 1 Spectra of the three lichen genera used in this study.
Landsat imagery analysis
This study was based on Landsat 8 and Landsat 7 Enhanced Thematic Mapper satellite imagery, which have a spatial resolution of 30 m in the multispectral bands (Supplementary Table S1). For each scene we converted the Landsat digital number values to surface reflectance values using published post-launch gains and offsets, correcting the scene for varying illumination (www.landsat.usgs.gov/Landsat8_Using_Product.php). Snow was masked on each scene using the Normalized Difference Snow Index (NDSI), selecting pixels with a NDSI greater than 0.4 (Dozier Citation1989; Klein et al. Citation1998). This method generates a normalized index using a green band and a short wavelength infrared band, as the higher reflectance of snow in the visible band and contrasting lower reflectance in the short wavelength infrared band permits separation of snow from other covers (Dozier Citation1989).
For each scene, we performed a matched filtering using the lichen spectra collected in the field to estimate the abundance of lichens using partial unmixing. This technique suppresses the response of a composite unknown background while maximizing the response of a known spectral signal of pure material or endmember (Harsanyi & Chang Citation1994). The scores for the matched filtering results are derived for each pixel by projecting the data onto a matched filter vector, which is the result of transforming the target spectrum onto the input data space. The resulting scores are normally distributed and have a mean of zero; values greater than zero show that a fraction of the target component (lichens in the case of this study) is present in a given pixel. The mathematical definition of the matched filter vector is given by Mundt et al. (Citation2007), who also comprehensively describe the method.
It has been shown that the spectrum from a single species of lichen can be used to account for all lichen contributions in a given observed mixture, if normalization is applied to the lichen reflectance spectra from 2000 to 2400 nm (see Zhang et al. Citation2005). This is because the spectra of different species of lichens share a similar shape and brightness in the shortwave infrared region (; Zhang et al. Citation2005). We used three lichen endmembers for this analysis, as explained above, applying the normalization to the lichen reflectance spectra as suggested by Zhang et al. (Citation2005), and tested whether their observation holds true for Antarctic lichens. We used a matched filtering threshold of 0.2 for all the scenes and all the lichen endmembers.
We also calculated NDVI values for each image. NDVI is based on the ratio of visible red light and near-infrared (Rouse et al. Citation1974; Gates Citation2003), and it is used to indicate the presence of chlorophyll in a land area represented by a pixel (values varying between −1.0 and +1.0, where values near +1 are pixels with very high chlorophyll content). We calculated NDVI for all the scenes using the Landsat 7 and 8 bands 3–4 and 4–5, respectively.
“Citizen science” ground-truthing data
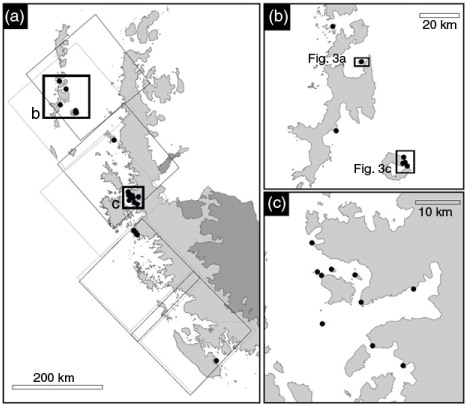
As ground truthing, we used a database of lichen richness on the Antarctic Peninsula which combines a photographic “citizen science” approach for data collection with the use of parataxonomic units for the estimation of lichen presence (Casanovas, Lynch, Fagan & Naveen Citation2013; www.ipt.biodiversity.aq/resource.do?r=antarctic_peninsula_lichens). This database compiles lichen occurrence for sites that are frequently visited by tourists. Twenty-nine sites were photographically surveyed by researchers and tourists between 2009/10 and 2011/12 on the Antarctic Peninsula region. In general, the area allowed for free walking for visitors is smaller than 500 m around the centre of a given visiting site (when limited by cliffs or glaciers, or on very small islands, the area can be smaller). Even though the lichen cover is intermixed with rock, soil and snow, it is an important component of the overall surface cover in most sites studied. Supplementary Fig. S1 shows an example of the extent and form of the vegetated areas in the sites studied. Photographers were asked to take pictures of lichens within the target area. A test of identifications from the photographs using a reference data set of Antarctic lichen images from the US National Herbarium showed that all species used in the test can be detected and, for 74% of the images, the genus of the lichen was identified correctly by three independent classifiers. The observed richness by site varied, with a mean of 18 parataxonomic species and 11 parataxonomic genera (for further information, see Casanovas, Lynch, Fagan & Naveen Citation2013). In this study, we used 22 of the sites from this database (Supplementary Table S2; ). Buellia sp. and Caloplaca sp. have been recorded in most sites, while Usnea sp. has been recorded in more than half the sites studied here (Supplementary Table S2).
Fig. 2 (a) Location of the ground-truthing sites (open circles) along the Antarctic Peninsula, where the large black squares indicate the extent of the Landsat 7 tiles and the large grey squares indicate the extent of the Landsat 8 tiles. (b) The South Shetland Islands () and (c) the Danco Coast area (close to Anvers Island). The projection of the maps is Lambert Azimuthal Equal Area.
Comparison analysis
We counted the number of pixels for which the matched filter showed lichen presence, and the number of pixels for which the different NDVI thresholds showed vegetation (0.05, 0.1 and 0.2) in a buffer of 500 m around the centre of the visiting area at each site. Fretwell et al. (2011) proposed three different thresholds for NDVI based on different probabilities of vegetation cover (higher than 0.05 is “probably” vegetated, higher than 0.1 is “very probable” and higher than 0.2 is “almost certain”). We recognize that there are several years' temporal difference between the vegetation surveys and the remotely sensed data. However, even though it has been demonstrated that lichens in parts of the Antarctic Peninsula region can grow as fast as elsewhere in the world, they only reach a maximum extension rate of 0.5–2.0 mm/year in the South Shetland Islands (Sancho & Pintado Citation2004). Therefore, we considered that this difference in time would introduce a very small source of error, if any.
We compared the number of sites where the lichen filter showed presence of lichens and those where NDVI values were greater than 0.2, 0.1 or 0.05, and both with the assessments of the ground-truthing sites, in order to evaluate the accuracy of the detection capabilities of the lichen filter and NDVI. For the Landsat 8 imagery, we also compared the total area for which the lichen filter showed presence of lichens with the area for which the different NDVI thresholds showed presence of vegetation. These analyses used ENVI version 5.1 (Exelis Visual Information Solutions, Boulder, CO) and ArcGIS 10 (ESRI 2011, ArcGIS Desktop: Release 10, Redlands, CA: Environmental Systems Research Institute).
Results
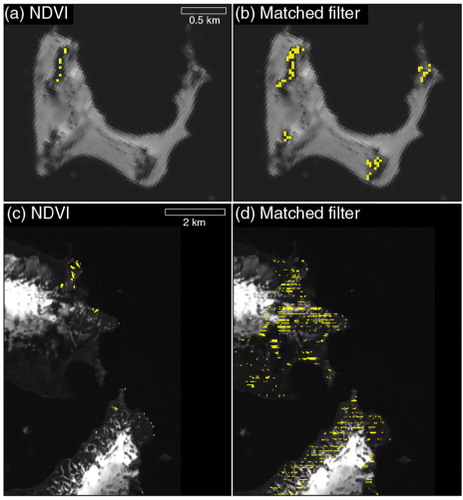
We compared the sites where citizen science confirmed the presence of lichens to the remote sensing analysis (Supplementary Table S2, 22 and 15 sites for the Landsat 7 and 8 set of images, respectively). In the Landsat 7 imagery analysis, the matched filtering failed to detect the presence of lichens in only one (6.6%) of the sites studied (mean number of pixels from the three species of lichens studied), while at 46.6% of the sites the NDVI with a threshold of 0.2 did not detect the presence of any vegetation. In the Landsat 8 imagery analysis, at three (13.6%) of the sites the matched filtering failed to detect lichens, with positive detection at 86% of the sites, while at 59% of the sites the NDVI (0.2 threshold) did not detect any vegetation. However, an NDVI threshold of 0.05 detected vegetation as frequently as the matched filter in both set of images (Landsat 7 and 8). shows a comparison of the matched filter and NDVI results for two sites in the South Shetland Islands. Comparisons of the matched filtering and the three different thresholds for the NDVI data for both sets of images are given in Supplementary Table S3. Supplementary Figs. S2 and S3 show the results of the matched filtering results for the entire area studied for all Landsat 7 and 8 images.
Fig. 3 (a) Normalized Difference Vegetation Index (NDVI; >0.2) analysis for north-west Deception Island and (c) Half Moon Island, South Shetland Islands (see ), using Landsat 8 imagery. (b) Matched filtering analysis for north-west Deception Island and (d) Half Moon Island, using Landsat 7 imagery. (See Supplementary Table S1 for details on the Landsat scenes.) The projection of the maps is Lambert Azimuthal Equal Area.
Comparing analyses of the areas detected using the matched filtering by different species of lichens, the total area detected as being covered by lichens by the filter varied slightly when using the different species' spectra. When using the spectra from Buellia sp., the total area detected was greater than when using the other two species' spectra. However, the area detected using the latter fell almost completely within that detected using the other two species: 81.0% of the area detected by Caloplaca sp. and 97.9% of the area detected by Usnea sp. spectra was inside that detected using the Buellia sp. spectra; further, 83.2% of the area detected by the Usnea sp. spectra fell inside that detected using Caloplaca sp. spectra. The area identified as having NDVI values greater than 0.2, 0.1 or 0.05 overlapped by 46.2, 61.7 or 52.3%, respectively, with that detected by the lichen matched filter (). However, when comparing the detection of lichens at each site studied in each set of imagery (Landsat 7 and 8), the results varied depending on the species spectrum used (Supplementary Table S3), with the Buellia sp. spectrum giving the most detections on the Landsat 8 images and the Usnea sp. spectrum the most detections on the Landsat 7 images.
Table 1 Areas covered by the pixels detected as lichen-covered by the matched filtering analysis and Normalized Difference Vegetation Index (NDVI), and the percentages of overlap between them
Discussion
The use of a matched filtering technique for lichens allowed for the detection of lichen flora on the Antarctic Peninsula using mid-resolution satellite imagery, showing a significant improvement over NDVI for the mapping of flora in this area when using an NDVI threshold of 0.2 [conventionally taken to indicate the almost certain presence of vegetation (Fretwell et al. 2011)]. More research would be needed to establish if this technique overestimates the presence of lichens, as the citizen science database used for ground truthing does not have information on sites where lichens are known to be absent. Even though a lower NDVI threshold of 0.05 appeared to perform as well as the mean of the three species of lichen spectra in detecting the presence of lichens at a given site, the poor overlap between areas detected using the two approaches suggests that they are not identifying the same features. Our results highlight the importance of using techniques other than NDVI thresholds for supplementing detection and mapping of vegetation in areas where lichens are an important community component. While it has previously been noted that NDVI thresholds are not the best technique for mapping distribution of lichens (Petzold & Goward Citation1988; Haselwimmer & Fretwell Citation2009), the current study is the first to compare NDVI threshold detection with an alternative technique for lichens in the Antarctic. Here we present the first map of lichen cover for parts of the Antarctic Peninsula based on matched filtering detection of lichen spectra. This is a first step in developing more detailed studies of vegetation in this region using remote sensing, and more detailed ground-truthing field surveys including percentage cover of different types of vegetation, and areas with confirmed absence of specific vegetation types, are recommended for the future.
The results presented here suggest that studies based on the spectrum of only one species of lichen will be sufficient for mapping lichen habitats in this environment, consistent with the conclusion of Zhang et al. (2005). However, results obtained using Buellia sp. and Usnea sp. spectra identified lichen presence in a greater area than those using the Caloplaca sp. spectrum. More detailed field survey data are required to assess the accuracy of using different species spectra at different spatial scales, and future work should address the possibility of mapping different types of vegetation using their specific spectra. It has been shown that it is possible to differentiate lichen species using their spectra in the visible part of the spectrum (Bechtel et al. Citation2002) and it might, therefore, be possible to map lichen richness from high- and medium-resolution imagery.
The same technique as used here could be applied in the future to intermediate spectral and spatial resolution imagery. At present, we could not use other commercial imagery of medium resolution because of their lack of data in the short wavelength infrared region in which the lichen spectral signature is most characteristic (2000–2400 nm; Petzold & Goward Citation1988). Images of intermediate spectral and spatial resolution will become available from planned satellite launches (e.g., WorldView-3 and Sentinel2 satellites) and will be of great importance in the study of vegetation in the polar regions in the future.
As glaciers retreat on the Antarctic Peninsula region, lichens play an important role in the colonization and primary succession of newly exposed terrestrial habitat (Favero-Longo et al. Citation2012). Mapping lichen presence will greatly assist in documenting this process. Also, this technique could assist in the study of areas disturbed by the increasing regional fur seal population on the Antarctic Peninsula (Favero-Longo et al. Citation2011). Lichens can be used as indicators of long-term change trends in habitat distributions (irrespective of other human impacts, such as direct disturbance).
It has been shown that lichen cover, Usnea spp. formations in particular, can be used as a proxy for estimating areas with less snow during the cold season in the Antarctic (Vieira et al. Citation2014). This application is of importance on the Antarctic Peninsula, where snow mapping is difficult. On the other hand, lichen cover can also compromise geological mapping, as it can completely mask the spectra of underlying lithologies (Rowan & Mars Citation2003; Harris et al. Citation2005).
Shaw et al. (Citation2014) recently argued that Antarctic biodiversity is poorly protected, with only 1.5% of the continent's ice-free area formally designated as Antarctic Specially Protected Areas, while Hughes et al. (Citation2015) have calculated that across the entire Antarctic continent only 7 km2 of “vegetated” land comes under this protection. Visitor Site Guidelines developed by the Antarctic Treaty Parties take into account the vegetation of some landing sites (e.g., Barrientos Island), because trampling and damage of vegetation is a potential human impact at popular tourist areas (Tejedo et al. Citation2009; Tejedo et al. Citation2012). However, the identification of appropriate areas for the conservation of vegetation, in particular lichens, is extremely difficult as field data on lichen cover are not available for most of Antarctica. The approach for mapping lichen cover on the Antarctic Peninsula proposed here is an important step forward in the understanding of lichen distribution and can assist in identifying areas for conservation.
Supplementary Material
Download PDF (1.4 MB)Acknowledgements
The study reported here was funded by a Natural Environment Research Council (NERC) Field Spectroscopy Facility Loan (no. 675.0613), the NERC Collaborative Gearing Scheme for fieldwork (CGS-086), a NERC PhD studentship (NE/K50094X/1) and the Scientific Committee on Antarctic Research Fellowship scheme 2013–14. PC and PF are core funded by NERC.
Notes
To access the supplementary material for this article, please see supplementary files under Article Tools online.
Related Research Data
References
- Adams B.J., Bardgett R.D., Ayres E., Wall D.H., Aislabie J., Bamforth S., Bargagli R., Cary C., Cavacini P., Connell L., Convey P., Fell J.W., Frati F., Hogg I.D., Newsham K.K., O'Donnell A., Russell N., Seppelt R.D., Stevens M.I. Diversity and distribution of Victoria Land biota. Soil Biology and Biochemistry. 2006; 38: 3003–3018.
- Bechtel R., Rivard B., Sanchez-Azofeifa A. Spectral properties of foliose and crustose lichens based on laboratory experiments. Remote Sensing of Environment. 2002; 82: 389–396.
- Bedini E. Mineral mapping in the Kap Simpson complex, central East Greenland, using HyMap and ASTER remote sensing data. Advances in Space Research. 2011; 47: 60–73.
- Black M., Casanovas P., Fretwell P., Convey P. High resolution mapping of Antarctic vegetation communities using airborne hyperspectral data. 2014; UK: Aberystwyth. doi: http://dx.doi.org/10.13140/2.1.5189.6648 Paper presented at the Remote Sensing and Photogrammetry Annual Conference. 2–5 September 2014.
- Casanovas P., Lynch H.J., Fagan W.F. Multi-scale patterns of moss and lichen richness on the Antarctic Peninsula. Ecography. 2013; 36: 209–219.
- Casanovas P., Lynch H.J., Fagan W.F. Using citizen science to estimate lichen diversity. Biological Conservation. 2014; 171: 1–8.
- Casanovas P., Lynch H.J., Fagan W.F., Naveen R. Understanding lichen diversity on the Antarctic Peninsula using parataxonomic units as a surrogate for species richness. Ecology. 2013; 94: 2110–2110.
- Chown S.L., Convey P. Spatial and temporal variability across life's hierarchies in the terrestrial Antarctic. Philosophical Transactions of the Royal Society B. 2007; 362: 2307–2331.
- Clarke A., Murphy E.J., Meredith M.P., King J.C., Peck L.S., Barnes D.K.A., Smith R.C. Climate change and the marine ecosystem of the western Antarctic Peninsula. Philosophical Transactions of the Royal Society B. 2007; 362: 149–166.
- Convey P. Antarctic terrestrial biodiversity in a changing world. Polar Biology. 2011; 34: 1629–1641.
- Convey P. Levin S. Antarctic ecosystems. Encyclopedia of biodiversity. 2013; San Diego, CA: Academic Press. 179–188. 2nd edn.
- Cook A.J., Fox A.J., Vaughan D.G., Ferrigno J.G. Retreating glacier fronts on the Antarctic Peninsula over the past half-century. Science. 2005; 308: 541–544.
- Dozier J. Spectral signature of alpine snow cover from the Landsat thematic mapper. Remote Sensing of Environment. 1989; 28: 9–22.
- Favero-Longo S.E., Cannone N., Roger Worland M., Convey P., Piervittori R., Guglielmin M. Changes in lichen diversity and community structure with fur seal population increase on Signy Island, South Orkney Islands. Antarctic Science. 2011; 23: 65–77.
- Favero-Longo S.E., Worland M.R., Convey P., Smith R.I.L., Piervittori R., Guglielmin M., Cannone N. Primary succession of lichen and bryophyte communities following glacial recession on Signy Island, South Orkney Islands, maritime Antarctic. Antarctic Science. 2012; 24: 323–336.
- Fretwell P.T., Convey P., Fleming A.H., Peat H.J., Hughes K.A. Detecting and mapping vegetation distribution on the Antarctic Peninsula from remote sensing data. Polar Biology. 2011; 34: 273–281.
- Gates D.M. Biophysical ecology. 2003; New York: Courier Dover Publications.
- Grebby S., Naden J., Cunningham D., Tansey K. Integrating airborne multispectral imagery and airborne LiDAR data for enhanced lithological mapping in vegetated terrain. Remote Sensing of Environment. 2011; 115: 214–226.
- Harris J.R., Rogge D., Hitchcock R., Ijewliw O., Wright D. Mapping lithology in Canada's Arctic: application of hyperspectral data using the minimum noise fraction transformation and matched filtering. Canadian Journal of Earth Sciences. 2005; 42: 2173–2193.
- Harsanyi J.C., Chang C.-I. Hyperspectral image classification and dimensionality reduction: an orthogonal subspace projection approach. Geoscience and Remote Sensing. 1994; 32: 779–785.
- Haselwimmer C., Fretwell P. Field reflectance spectroscopy of sparse vegetation cover on the Antarctic Peninsula. First Workshop on Hyperspectral Image and Signal Processing: Evolution in Remote Sensing. 2009; Piscataway, NJ: Institute of Electrical and Electronics Engineers. 1–4. Whispers '09.
- Hughes K.A., Pertierra L.R., Molina-Montenegro M.A., Convey P. Biological invasions in Antarctica: what is the current status and can we respond?. Biodiversity and Conservation. 2015; 24: 1031–1055.
- Johansen B., Karlsen S.R. Monitoring vegetation changes on Finnmarksvidda, northern Norway, using Landsat MSS and Landsat TM/ETM+ satellite images. Phytocoenologia. 2005; 35: 969–984.
- Klein A.G., Hall D.K., Riggs G.A. Improving snow cover mapping in forests through the use of a canopy reflectance model. Hydrological Processes. 1998; 12: 1723–1744.
- Krell F.-T. Parataxonomy vs. taxonomy in biodiversity studies—pitfalls and applicability of “morphospecies” sorting. Biodiversity and Conservation. 2004; 13: 795–812.
- Laidler G.J., Treitz P.M., Atkinson D.M. Remote sensing of Arctic vegetation: relations between the NDVI, spatial resolution and vegetation cover on Boothia Peninsula, Nunavut. Arctic. 2008; 61: 1–13.
- Liggett D., McIntosh A., Thompson A., Gilbert N., Storey B. From frozen continent to tourism hotspot? Five decades of Antarctic tourism development and management, and a glimpse into the future. Tourism Management. 2011; 32: 357–366.
- Mundt J., David T., Streutker R., Glenn N.F. Partial unmixing of hyperspectral imagery: theory and methods. Proceedings of the American Society of Photogrammetry and Remote Sensing 2007. 2007; Bethesda, MD: American Society for Photogrammetry and Remote Sensing.
- Øvstedal D.O., Smith R.I.L. Lichens of Antarctica and South Georgia: a guide to their identification and ecology. 2001; Cambridge: Cambridge University Press.
- Øvstedal D.O., Smith R.I.L. Further additions to the lichen flora of Antarctica and South Georgia. Nova Hedwigia. 2009; 88: 157–168.
- Petzold D.E., Goward S.N. Reflectance spectra of Subarctic lichens. Remote Sensing of Environment. 1988; 24: 481–492.
- Rouse J.W. Jr., Haas R.H., Schell J.A., Deering D.W., Harlan J.C. Monitoring the vernal advancements and retrogradation of natural vegetation. Final report. 1974; MD: National Aeronautics and Space Agency. Greenbelt.
- Rowan L.C., Mars J.C. Lithologic mapping in the Mountain Pass, California area using Advanced Spaceborne Thermal Emission and Reflection Radiometer (ASTER) data. Remote Sensing of Environment. 2003; 84: 350–366.
- Sancho L.G., Pintado A. Evidence of high annual growth rate for lichens in the maritime Antarctic. Polar Biology. 2004; 27: 312–319.
- Shaw J.D., Terauds A., Riddle M.J., Possingham H.P., Chown S.L. Antarctica's protected areas are inadequate, unrepresentative, and at risk. PLoS Biology. 2014; 12: 1001888. doi: http://dx.doi.org/10.1371/journal.pbio.1001888.
- Smith R.I.L. Laws R.M. Terrestrial plant biology of the sub-Antarctic and Antarctic. Antarctic ecology. 1984; London: Academic Press. 61–162.
- Stow D.A., Hope A., McGuire D., Verbyla D., Gamon J., Huemmrich F., Houston S., Racine C., Sturm M., Tape K., Hinzman L., Yoshikawa K., Tweedie C., Noyle C.B., Silapaswan C., Douglas D., Griffith B., Jia G., Epstein H., Walker D., Daeschner S., Petersen A., Zhou L.M., Myneni R. Remote sensing of vegetation and land-cover change in Arctic tundra ecosystems. Remote Sensing of Environment. 2004; 8: 281–308.
- Tejedo P., Justel A., Benayas J., Rico E., Convey P., Quesada A. Soil trampling in an Antarctic specially protected area: tools to assess levels of human impact. Antarctic Science. 2009; 21: 229–236.
- Tejedo P., Pertierra L., Benayas J., Convey P., Justel A., Quesada A. Trampling on maritime Antarctica. Can soil ecosystems be effectively protected through existing codes of conduct?. Polar Research. 2012; 31 article no. 10888, doi: http://dx.doi.org/10.3402/polar.v31i0.10888.
- Terauds A., Chown S.L., Morgan F., Peat H.J., Watts D.J., Keys H., Convey P., Bergstrom D.M. Conservation biogeography of the Antarctic. Diversity and Distributions. 2012; 18: 726–741.
- Tin T., Fleming Z.L., Hughes K.A., Ainley D.G., Convey P., Moreno C.A., Pfeiffer S., Scott J., Snape I. Impacts of local human activities on the Antarctic environment. Antarctic Science. 2009; 21: 3–33.
- Tommervik H., Bjerke J.W., Gaare E., Johansen B., Thannheiser D. Rapid recovery of recently overexploited winter grazing pastures for reindeer in northern Norway. Fungal Ecology. 2012; 5: 3–15.
- Vieira G., Mora C., Pina P., Schaefer C.E. A proxy for snow cover and winter ground surface cooling: mapping Usnea sp. communities using high resolution remote sensing imagery (maritime Antarctica). Geomorphology. 2014; 225: 69–75.
- Wall D.H., Lyons W.B., Convey P., Howard-Williams C., Quesada A., Vincent W.F. Long-term ecosystem networks to record change: an international imperative. Antarctic Science. 2011; 23: 209.
- Waser L.T., Stofer S., Schwartz M., Küchler M., Ivits E., Scheidegger C. Prediction of biodiversity—regression of lichen species richness on remote sensing data. Community Ecology. 2004; 5: 121–133.
- Zhang J., Rivard B., Sánchez-Azofeifa A. Spectral unmixing of normalized reflectance data for the deconvolution of lichen and rock mixtures. Remote Sensing of Environment. 2005; 95: 57–66.