
Abstract
Snow accumulation and associated synoptic conditions in the Russian Arctic are analysed based on snow depth data from 1950 to 2013 from the All-Russian Research Institute of Hydrometeorological Information—World Data Centre data set. The mean duration of snow coverage in the Russian Arctic is approximately eight to nine months. While the period of snowmelt is usually very short (one or two months), snow accumulates during most of the cold season (October–May). Snow accumulation is associated with negative anomalies of sea level pressure and positive anomalies of air temperature, which means increased cyclonic activity over the analysed region. The cyclones differ in intensity and localization, depending on the area of snowfall. In the western part of the Russian Arctic the cyclones and air masses that bring snowfall may originate from the North Atlantic, while in the eastern part they originate from the Bering Sea, Okhotsk Sea or the North Pacific. The cyclones that bring snowfall may also form locally along the zonal border between two different air masses: the very cold, polar, continental air originating from the Siberian High and the Arctic air from the north, which is often warmer and always more humid than the continental air.
To access the supplementary material for this article, please see the supplementary files under Article Tools, online.
Snow is a dominant feature of the High Arctic terrestrial landscape for eight to ten months of the year. Snow has a substantial impact on plants, animals and humans that live in the Arctic (Callaghan et al. Citation2011) and is also an important part of the climate system. Snow strongly modifies the surface–atmosphere energy budget by increasing the surface albedo and isolating the atmosphere from the ground (Robock Citation1980; Robinson & Kukla Citation1985; Foster Citation1989). Consequently, snow modifies the boundary layer climate mainly by lowering the surface air temperature (Wagner Citation1973; Dewey Citation1977). Snow is also a reservoir for fresh water and therefore plays an important role in the hydrological cycle. In high latitudes of the Northern Hemisphere, water stored in the snow cover has a significant influence on salinity, sea-ice distribution and water circulation in the Arctic Ocean and thus is linked to the global thermohaline circulation, which is an important determinant of the global climate (Aagaard & Carmack Citation2012).
The occurrence of snowfall and snow cover is determined by the relationship between air temperature and precipitation, and is therefore sensitive to climate change (Räisänen Citation2008; Collins et al. Citation2013). Observed and predicted increases in winter temperatures and precipitation at mid-latitudes and in the Arctic will likely influence snowfall in these regions (Symon et al. Citation2005). At mid-latitudes, where winters are mild, temperature increases convert snow to rain, but at high-latitudes, where the climate is cold and winter temperatures remain below zero, greater amounts of snowfall can be expected despite warming (Räisänen Citation2008). The snow cover extent in the Arctic has declined by approximately 10% over the past 30 years, but at the same time, snow depth has increased in some areas of the Arctic, such as northern Russia. While snow depth decreased significantly over the North American Arctic in the past 50 years (Callaghan et al. Citation2011), an increasing trend in snow depth has prevailed over Eurasia, particularly in west Siberia, Sakhalin and northern Europe (Krenke et al. Citation2000; Kohler et al. Citation2006; Popova Citation2007; Bulygina et al. Citation2010; Bulygina et al. Citation2011). Continuation of this trend is expected in the future, and the maximum seasonal snow depth is also expected to increase over many northern areas by 2050, with the greatest increase over Siberia. Despite this, the mean duration of seasonal snow cover is projected to decline by up to 20% by 2050 (Callaghan et al. Citation2011).
The occurrence of snowfall, as well as other winter weather conditions, such as temperature, cloudiness and precipitation, is largely controlled by atmospheric circulation, particularly at high latitudes, where there is limited inflow of solar energy. Several analyses of the Northern Hemisphere snow cover response to variations in macroscale atmospheric circulation have been carried out at monthly or weekly time scales and at different spatial scales (global and continental). The PNA circulation pattern has a particularly strong impact on snow cover over North America. Its positive phase is associated with reduced snow over the western part of the continent and increased snow cover over the eastern USA (Gutzler & Rosen Citation1992; Brown & Goodison Citation1996; Cayan Citation1996; Serreze et al. Citation1993). The NAO has a great impact on snow cover persistence in Europe and Asia (Gutzler & Rosen Citation1992; Clark et al. Citation1999; Bednorz Citation2004; Falarz Citation2007; Bednorz & Wibig Citation2008). The PNA also influences winter precipitation and snow cover development in the easternmost part of Russia, including the eastern part of the Russian Arctic; however, the influence of the PNA on cold season precipitation has weakened substantially since 1989 (Borzenkova & Šmakin Citation2012). Borzenkova & Šmakin (Citation2012) found that the NAO has a particularly strong impact on cold season precipitation in the central and north-western parts of Russia (including the western part of the Russian Arctic), and this impact has increased since 1975 because of a sustained, stronger positive phase of the NAO. Conversely, it has been proposed that Eurasian snow cover can modify the atmospheric circulation, particularly the intensity of the Arctic Oscillation, allowing it to influence climatic conditions at temperate and polar latitudes (Cohen & Entekhabi Citation1999; Saito & Cohen Citation2003; Cohen & Fletcher Citation2007; Allen & Zender Citation2011; Cohen & Jones Citation2011; Cohen et al. Citation2012). The teleconnection between snow cover and the Arctic Oscillation has not been constant over the entire 20th century, but was significant over the period 1976–2010 (Peings et al. Citation2013).
Although there are many published studies regarding snow cover in Russia and Eurasia and its relationships with atmospheric circulation (Tachibana Citation1995; Ye et al. Citation1998; Ye Citation2000; Morinaga et al. Citation2003; Rikiishi & Sakakibara Citation2004; Iijima et al. Citation2007; Popova Citation2007; Borzenkova & Šmakin Citation2012), comparatively few studies have examined the occurrence of snow cover in the eastern sectors of the Arctic, and those have mainly focused on changes in the length of the snow season (Ye & Mather Citation1997; Ye Citation2001a, Citationb; Ye & Ellison Citation2003). Recent climate changes in the polar sector of northern Eurasia are associated with increased cyclonic activity over high latitudes, which is linked to the predominantly positive phase of the NAO since the 1970s (Hurrell Citation1995; Rogers & Mosley-Thosmpson Citation1995). This should be reflected in snow accumulation conditions in the Russian Arctic. In light of these recent changes, and given the climatic significance of snow cover, it is important to define the synoptic conditions that control snow accumulation over northern Eurasia. Therefore, the aim of this study is to characterize the snow cover occurrence in the Russian Arctic and to determine atmospheric circulation patterns that result in snow accumulation in different parts of this region.
Data and methods
Snow cover
This study is based on the daily snow depth data collected at six stations across the Russian Arctic () for the winter seasons from 1950/51 to 2012/13. These data were obtained from the data set Snow Cover Characteristics from Russian Meteorological Stations and from Some Meteorological Stations over the Former USSR Territory, prepared by the RIHMI-WDC. The data sets are automatically checked for quality control before being stored at the RIHMI-WDC and also checked for homogeneity (Mestcherskaya et al. Citation1995; Veselov Citation2002).
Abbreviations in this article
HYSPLIT:Hybrid Single Particle Lagrangian Integrated Trajectory Model
NAO:North Atlantic Oscillation
PNA:Pacific North American
RIHMI-WDC:All-Russian Research Institute of Hydro-meteorological Information-World Data Centre
SLP:sea level pressure
Fig. 1 Location of meteorological and snow monitoring stations used in this study.
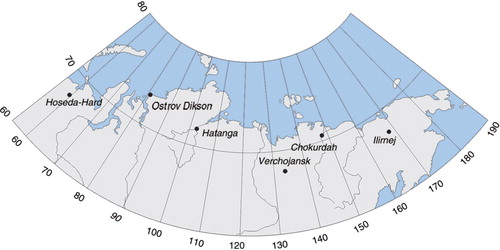
The investigated area covered the Russian Arctic between 65° and 75°N and 55° to 170°E (). The elevation of all stations was lower than 150 m a.s.l. Snow depth data came from daily measurements taken at three snow measuring rods at 06.00 UTC. The daily mean was calculated by averaging the readings on the three rods, rounded to the nearest whole centimetre. The days with a snow depth of ≥1 cm were considered as days with snow cover.
To detect daily changes in snow cover depth, the snow depth of a given day was subtracted from the snow depth of the following day. Positive/negative values indicate increases/decreases in snow depth, respectively. To avoid (or at least reduce) situations, when the snow cover increase was caused by snow drift, only the days with precipitation >0 mm were taken into consideration. The number of days with snow cover increases was computed, and monthly increases/decreases in snow cover depth were calculated by summing the positive/negative values for each month. Because the focus of the study was intense snowfalls, days with an increase in snow cover depth of ≥5 cm were selected and synoptic conditions on these days were analysed for chosen stations representing different regions of the Russian Arctic (). This choice of the threshold accumulation value was based on the probability distribution of the values of daily snow depth increase (). The value of 5 cm falls in the interval between the 90th and 95th percentiles, depending on the station (apart from Verhojansk, where it is equal to the 96th percentile). This is considered as an adequate threshold for recognizing rare or extreme meteorological events, as defined by the Intergovernmental Panel on Climate Change (Houghton et al. Citation2001).
Table 1 Descriptive statistics of snowfall at selected stations across the Russian Arctic () during the period 1950/51–2012/13.
According to the glossary of the American Meteorological Society, “snowfall” means the accumulation of snow during a specified period of time (usually expressed in centimetres or inches of snow depth). In this study, the term is used interchangeably with “increases in snow depth” for the sake of simplicity.
Synoptic conditions
In order to relate the occurrence of heavy snowfall in the Russian Arctic to specific synoptic conditions, the “environment to circulation” approach was applied. Using this method, a classification of circulation patterns was carried out using specific environment-based criteria set for a particular phenomenon, abundant snowfall in this case (Yarnal Citation1993; Yarnal et al. Citation2001; Dayan et al. Citation2012). Synoptic conditions during the days of abundant snow accumulation were considered in terms of pressure patterns, which determine the atmospheric circulation and the transport of air masses, and in terms of the air temperature in the lower troposphere (at the isobaric level of 850 hPa). Mean daily SLP data were obtained from the US National Centers of Environmental Prediction/National Center for Atmospheric Research reanalysis data set (Kalnay et al. Citation1996; Kistler et al. Citation2001). Gridded temperature values at the 850 hPa level (T850) were obtained from the same source. The spatial resolution of all reanalysis data used in this study was 2.5°×2.5°.
Anomalies of SLP and T850 were computed and mapped for the days with snow cover increases ≥5 cm at each station (Birkeland & Mock Citation1996). Anomalies of SLP were calculated as differences between composite values for the days with intense snowfalls and the 59-year cold season means (October–May). Anomalies of T850 were calculated only for the coldest winter months (December–February). Furthermore, in order to detect the origin of cyclones that lead to snowfall events, anomalies of SLP for five days prior to the heavy snowfall events were calculated and mapped.
Additionally, 72-hour backward trajectories of air parcels for the 75 most abundant snowfall events at particular stations were constructed using the HYSPLIT model (Stein et al. Citation2015; Rolph Citation2016). This method is often used to find the source areas of airborne pollutants (Avila & Alarcon Citation1999; Salvador et al. Citation2010). In the HYSPLIT model, three heights above sea level can be specified. In this study, the movement of air parcels was tracked at the following altitudes: 500 m (suggested by the model), which corresponds to the mid-level of the atmospheric mixing layer, and is well above ground level throughout the study area; 2000 m, which corresponds to the average height of the 850 hPa isobaric surface; and, finally, 5000 m as the upper-troposphere level. At higher altitudes in the troposphere the moisture content (important for snowfall) becomes very smaller and moisture transport less effective. The 5000-m level corresponds to the altitude of Rossby waves at high latitudes, which affect lower atmospheric circulation patterns (Holton & Hakim Citation2012). Representative examples of backward air trajectories for each station were selected for display. The 72-hour backward trajectories can reach several thousand kilometres, and at such lengths the uncertainty of the model-estimated geographic origin of the air parcel becomes very large (approximately 20% of trajectory length, or 200–400 km for the 72-hour trajectories [Kahl & Samson Citation1986]). This must be considered when analysing single backward trajectories. Here, the spatial distribution of hourly trajectory end point frequencies were mapped for each station and atmospheric level (500, 2000, and 5000 m) separately (Heo et al. Citation2013). The analysis of air parcels trajectories at these three altitudes supplemented the information obtained from synoptic maps and facilitated the identification of the probable source area of air masses causing snowfall in different areas of the Russian Arctic.
Results
Snow occurrence
The vast Russian Arctic is not climatically homogeneous. The mean annual air temperature ranges from −5.0°C in Hatanga, located in the western coastal sector, to −15.0°C in Verhojansk, located in the central continental area. The eastern shore has a mean annual temperature below −13°C, which is much colder than the mean annual temperature (>–10°C) in the western sector of the Russian Arctic. Spatial differences in winter air temperatures are even greater, and the mean temperature of the coldest month (January) ranges from −20°C in the west to −46°C in the central continental area. At most stations, the mean monthly temperature drops below 0°C from October to May, which allows for snowfall during most of the year. The mean annual precipitation exceeds 400 mm in the west (Hoseda Hard) and is <200 mm in the east (Verhojansk and Ilirnej). Precipitation during the cold season (October–May), which is necessary for the development of snow cover, is much lower than in the summer, and it ranges from >200 mm in the west to <100 mm in the east.
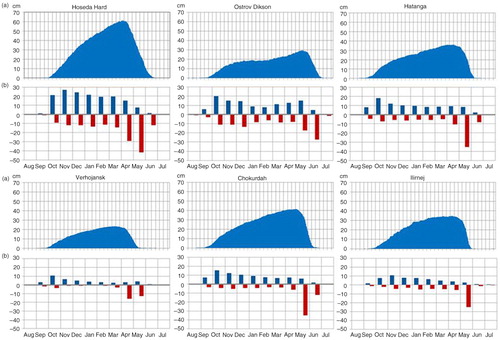
The mean duration of snow cover in the Russian Arctic is approximately eight or nine months (a) and the statistics of snow cover vary considerably across the Russian Arctic (Kripalani & Kulkarni Citation1999). The mean seasonal maximum depth of snow cover ranges from 20 to 70 cm, depending on the region. Greater snow depths are observed at the western station located along the shore of the Arctic Ocean (Hoseda Hard in ). Much lower snow depths are observed in the central continental area (Verhojansk) and in the far north (Ostrov Dickson) because of low winter precipitation. The seasonal maximum snow depth is usually observed in March or April (May at the northernmost station). Snow accumulates over most of the cold season, while the period of intense snow melt is a comparatively very short one to two months (b).
Fig. 2 (a) Seasonal evolution of daily mean snow depth (cm) at selected stations. (b) Monthly mean snow accumulation (blue) and ablation (red), in cm for the same stations (averages for period 1950/51–2012/13).
Synoptic conditions of snowfall
The total number of snowfall days in the Russian Arctic during the winter seasons 1950/51–2012/13 ranged from >2000 days at the most western station to 438 days at the most continental station (Verhojansk) (). Periods of intense snowfall (≥5 cm accumulation) considered in the synoptic analysis ranged from 70 days at Verhojansk to >500 days at the most western station (Hoseda Hard; ).
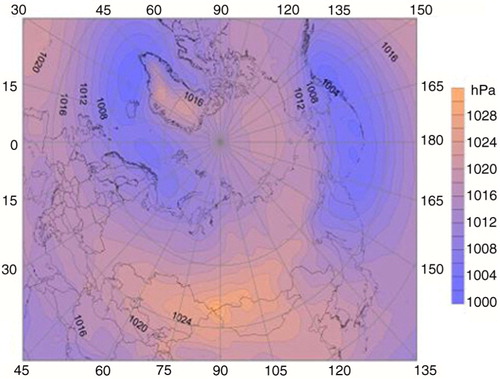
During the long Arctic winter, which lasts from October to May, a vast anticyclone of thermal origin, the Siberian High, spreads over Asia with a mean SLP > 1026 hPa at its core, located over the southern border of Russia (). A low pressure zone extends from the Icelandic Low towards the north-east, reaching over the Barents Sea. Another low-pressure area, the Aleutian Low, which is known as a locus of cyclonic activity, spreads over the North Pacific. These two SLP depressions are divided by a ridge of high pressure that crosses the Arctic Ocean and connects the Siberian High with the North American High.
Fig. 3 Mean SLP (hPa) over the Northern Hemisphere during the cold season (October–May) during the period 1950/51–2012/13.
Intense snowfall resulting in large snow accumulation is always associated with negative anomalies of SLP in the region of snowfall. In most cases, a centre of negative SLP anomalies <−6 hPa is located right over the snow cover monitoring station used in the analysis, or to the east of it (b, b). The cyclones that deliver snowfall differ in their intensity and localization depending on the area of snowfall. In the western part of the Russian Arctic, represented by Hoseda Hard and Hatanga in , the cyclones are linked by SLP depressions with the Icelandic Low. Maps of SLP anomalies for five days prior to intensive snowfall events mapped at these two stations show negative anomalies spreading over the Arctic and North Atlantic. The cyclones most likely migrate from the North Atlantic or from the Barents Sea, where they gather moisture, towards the east and reach the western part of the Russian Arctic. This track is known as one of the main winter cyclone paths in the Arctic (Serreze & Barry Citation1988; Serreze et al. Citation1993). The 72-hour backward trajectories of air parcels (examples in Supplementary Fig. S1) constructed for the days with the heaviest snowfalls in the western stations indicate that air which brings snowfall covers long distances (particularly in the upper troposphere) and may originate from the ice-free waters of the North Atlantic, as shown by the maps of spatial distribution of hourly trajectory end point frequencies (). This warm and humid air from the west is advected over cooler and more stable continental or polar air masses in the Arctic (Supplementary Fig. S1, backward trajectories for Hoseda Hard and Hatanga). The processes described above correspond to a warm front structure between dynamic warm and humid air of distant western origin, and stable cold masses in situ.
Fig. 4 SLP anomalies for (a) five days prior to and (b) during days of intense snowfall at selected stations.
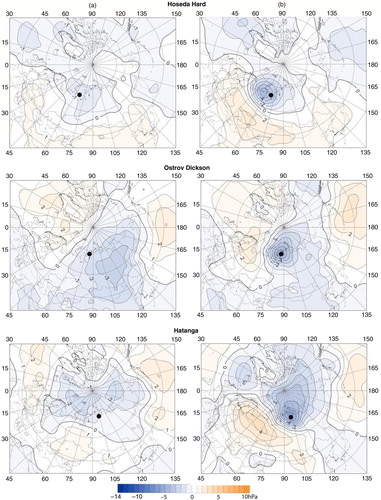
Fig. 5 SLP anomalies for (a) five days prior to and (b) during days of intense snowfall at selected stations.
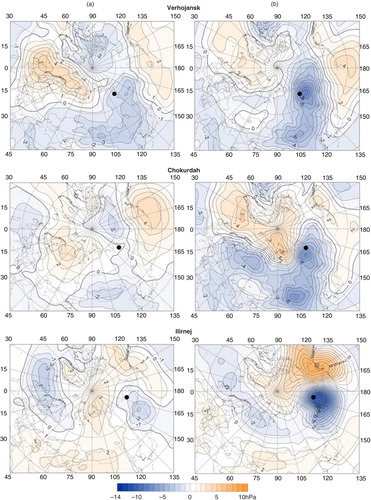
Fig. 6 Spatial distribution of 72-hour backward trajectory end point frequencies for three atmospheric levels: 500 m (red), 2000 m (blue) and 5000 m (green). Based on 72-hour backward air trajectories produced with the HYSPLIT model for the 75 heaviest snowfall days at each station.
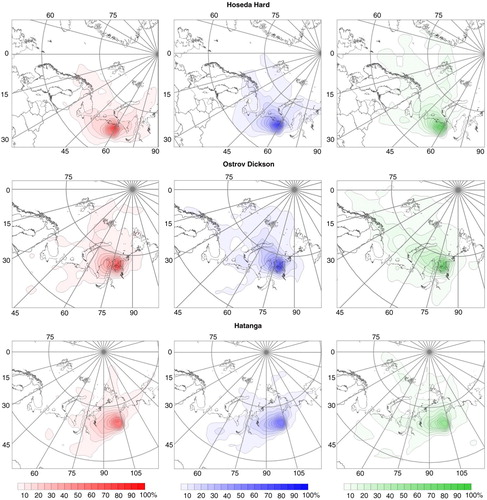
In Ostrov Dickson, which is the northernmost snow monitoring station in the study area, the cyclones bringing snowfall originate from the south-east, as shown by the SLP anomaly maps (). Cyclones form at the north-eastern edge of the winter Siberian High and are possibly induced by contact of the two different air masses: the very cold, polar, continental air originating from the Asian interior and the Arctic air from the north, which is often warmer and always more humid than the continental air. The map of hourly backward trajectory end point frequencies constructed for days with the heaviest snowfall in Ostrov Dickson show the source area of the air parcels to be mainly west and north of the station (). In the central part of the Russian Arctic, represented by Verhojansk, the cyclones bringing snowfall form over the Arctic Ocean or over central Siberia, as shown by the SLP anomaly maps in (). The cyclones may also form locally along the zonal border between the polar, continental air originating from the Siberian High and the relatively warmer and more humid Arctic air from the north, as described earlier (, ).
Fig. 7 Spatial distribution of 72-hour backward trajectory end point frequencies for three atmospheric levels: 500 m (red), 2000 m (blue) and 5000 m (green). Based on 72-hour backward air trajectories produced with the HYSPLIT model for the 75 heaviest snowfall days at each station.
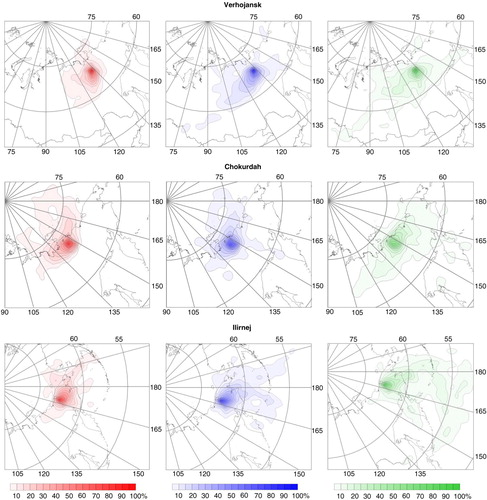
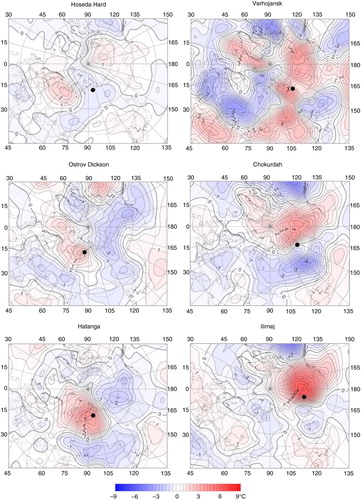
Air masses of a quite different origin may cause the heavy snowfall in the eastern part of the Russian Arctic (stations Chokurdah and Ilirnej). In this case, negative SLP anomalies spread over the eastern edge of Asia. The Aleutian Low, which is a mid-latitude low-pressure area of intense cyclonic activity which intensifies during the cold season, becomes even stronger than normal and expands towards the north-west during periods of intense snowfall over the study region. The pattern of SLP anomalies for days of heavy snowfall in Ilirnej () shows strong positive anomalies over the Gulf of Alaska (>8 hPa at their centre) and concurrently, strong negative anomalies over the north eastern edge of Siberia (<–10 hPa over the Chukotka Peninsula). This suggests that the Aleutian Low is shifted westwards and deepens as can be deduced from anomalies for the five days prior to heavy snowfalls. Maps of the spatial distribution of hourly trajectory end point frequencies for stations Cokurdah and Ilirnej () indicate the Bering Sea, Okhotsk Sea or North Pacific as the probable source areas of precipitating air masses. Here also, relatively warm and humid air from the south is advected over the cooler and more stable polar air masses in the Arctic (Supplementary Fig. S1). Most of the backward trajectories on Supplementary Figure S1 confirm the cyclonic (counter-clockwise) circulation of air parcels. Strong positive SLP anomalies south of the Aleutian Islands suggest that the negative phase of the PNA circulation pattern is associated with intense snowfall in the eastern part of the Russian Arctic. This confirms the findings of Borzenkova & Šmakin (Citation2012), who found a negative correlation between seasonal precipitation sums under negative air temperature and PNA indices in the eastern part of the Russian Arctic. Anomaly maps of T850 for days with abundant snowfall at selected stations were constructed for the coldest winter months (December–February; ). During winter, when the average surface air temperature in the Russian Arctic ranges from −25°C to −50°C, intense snowfall is associated with positive anomalies of temperature (up to 7°C) right over the regions with snowfall or within their vicinity. In eastern stations (Verhojansk, Cokurdah and Ilirnej), the strongest positive T850 anomalies are located east or north-east of the negative SLP anomalies, while negative T850 anomalies are located west or south-west of the negative SLP anomalies. Counter-clockwise circulation in low-pressure systems causes southerly inflow of warm air masses originating from the Pacific Ocean at the eastern edge of cyclones. To the west and south-west of cyclones, the northerly or easterly airflow brings cold Arctic air from the north, or even colder Siberian polar air from the east, which induces negative anomalies of T850. Different pattern of T850 anomalies are observed during heavy snowfalls at the three westernmost stations (Hoseda Hard, Ostrov Dickson and Hatanga). There, the strongest positive T850 anomalies are located south of the negative SLP anomalies and they correspond to the southern warm parts of cyclones, where counter-clockwise circulation drives westerly airflow. Western (Atlantic) or even northern (Arctic) air masses are warmer in winter than the polar continental air over Siberia. In contrast, to the north and north-east of cyclones, negative T850 anomalies are observed, because of easterly airflow, which brings cold Siberian air.
Fig. 8 Anomalies of air temperature at the isobaric level of 850 hPa during days of intense snowfall during winter months (December–February) at selected stations.
Discussion
This study has shown that cyclones bringing snowfall in the eastern part of the Russian Arctic originate from the Bering Sea, Okhotsk Sea or the North Pacific. They may also form locally along the zonal border between cold, polar, continental air originating from the Siberian High and Arctic air from the north. Rikiishi & Sakakibara (Citation2004) suggest that deep snow conditions along the Lena river valley and along the Yenisei river valley are caused by the frequent migration of synoptic disturbances from the Arctic Ocean. Such conditions appear mainly in October–December and are then suppressed by the freezing of the Arctic Ocean. In the western part of the Russian Arctic, cyclones and associated air masses that deliver snowfall originate from the North Atlantic and move by the eastward cyclone track determined by Serreze et al. (Citation1993). These authors describe the northward and eastward movement of low pressure systems starting in the Norwegian Sea and Barents Sea, reaching the Kara Sea. Another important region of cyclonic winter activity is the subpolar Pacific, with the corresponding cyclone track being from the Sea of Okhotsk to the Bering Sea and the Gulf of Alaska. All of these systems usually originate in the mid-latitude cyclogenetic zones or are generated locally over the sub-Arctic seas. Cyclonic activity has increased at high latitudes while it has decreased at the mid-latitudes, which reflects a poleward shift of storm tracks (McCabe et al. Citation2001; Zhang et al. Citation2004). This factor may contribute to the currently observed increase in snow accumulation in the Russian Arctic.
Conclusions
The polar regions are considered to be most vulnerable to contemporary warming and their climatic sensitivity is strongly related to the variability of air circulation. The results obtained in this study show that winter weather conditions in the Arctic are strongly controlled by air circulation, particularly by the cyclonic activity. Our findings agree with theories concerning trends of climate changes in the Arctic—the warmer and more moisture-laden Arctic atmosphere is expected to lead to more intensive cyclonic activity, which will likely lead to increasing snowfall over the region. Considering the current interest in polar climate change, this contribution to the discussion on winter weather conditions in high latitudes and its circulation feedback seems to be essential.
Supplementary Material
Download PDF (235.3 KB)Acknowledgements
This work was supported by the Polish National Science Centre under grant no. 2011/01/B/ST10/01923.
Notes
To access the supplementary material for this article, please see the supplementary files under Article Tools, online.
Related Research Data
References
- Aagaard K., Carmack E.C. The role of sea ice and other fresh water in the Arctic circulation. Journal of Geophysical Research—Oceans. 2012; 94: 14485–14498.
- Allen R.J., Zender C.S. Forcing of the Arctic oscillation by Eurasian snow cover. Journal of Climate. 2011; 24: 6528–6539.
- Avila A., Alarcon M. Relationship between precipitation chemistry and meteorological situations at a rural site in NE Spain. Atmospheric Environment. 1999; 33: 1663–1677.
- Bednorz E. Snow cover in eastern Europe in relation to temperature, precipitation and circulation. International Journal of Climatology. 2004; 24: 591–601.
- Bednorz E., Wibig J. Snow depth in eastern Europe in relation to circulation patterns. Annals of Glaciology. 2008; 48: 135–149.
- Birkeland K.W., Mock C.J. Atmospheric circulation patterns associated with heavy snowfall events, Bridger Bowl, Montana, U.S.A. Mountain Research and Development. 1996; 16: 281–286.
- Borzenkova A.V., Šmakin A.B. Izmenenija tolščiny snežnogo pokrova i slutočnoj intensivnosti snegopadov, vlijajuščie na rashody po uborke magistralej v rossijskih gorodah. (Changes in the snow cover thickness and of daily snowfall intensity affecting the highways cleaning expenses in Russian cities.). Led i Sneg. 2012; 52: 59–70.
- Brown R.D., Goodison B.E. Interannual variability in reconstructed Canadian snow cover, 1915–1992. Journal of Climate. 1996; 9: 1299–1318.
- Bulygina O.N., Groisman P.Y., Razuvaev V.N., Korshunova N.N. Changes in snow cover characteristics over northern Eurasia since 1966. Environmental Research Letters. 2011; 6: 045204.
- Bulygina O.N., Groisman P.Y., Razuvaev V.N., Radionov V.F. Snow cover basal ice layer changes over northern Eurasia since 1966. Environmental Research Letters. 2010; 5: 015004.
- Callaghan T.V., Johansson M., Brown R.D., Groisman P.Y., Labba N., Radionov V., contributing authors . Changing snow cover and its impacts. Snow, Water, Ice and Permafrost in the Arctic (SWIPA): climate change and the cryosphere. 2011; Oslo: Arctic Monitoring and Assessment Programme. Pp. 4–1–4–58.
- Cayan D.R. Interannual climate variability and snowpack in the western United States. Journal of Climate. 1996; 9: 928–948.
- Clark M.P., Serreze M.C., Robinson A.D. Atmospheric controls on Eurasian snow extent. International Journal of Climatology. 1999; 19: 27–40.
- Cohen J., Entekhabi D. Eurasian snow cover variability and Northern Hemisphere climate predictability. Geophysical Research Letters. 1999; 26: 345–348.
- Cohen J., Fletcher C. Improved skill of Northern Hemisphere winter surface temperature predictions based on land-atmosphere fall anomalies. Journal of Climate. 2007; 20: 4118–4132.
- Cohen J., Furtado J.C., Barlow M.A., Alexeev V.A., Cherry J.E. Arctic warming, increasing snow cover and widespread boreal winter cooling. Environmental Research Letters. 2012; 7: article no. 014007, doi: http://dx.doi.org/10.1088/1748-9326/7/1/014007.
- Cohen J., Jones J. A new index for more accurate winter predictions. Geophysical Research Letters. 2011; 38: L21701, doi: http://dx.doi.org/10.1029/2011GL049626.
- Collins M., Knutti R., Arblaster J., Dufresne J.-L., Fichefet T., Friedlingstein P., Gao X., Gutowski W.J., Johns T., Krinner G., Shongwe M., Tebaldi C., Weaver A.J., Wehner M., contributing authors . Stocker T.F., etal. Long-term climate change: projections, commitments and irreversibility. Climate change 2013. The physical science basis. Working Group I contribution to the fifth assessment report of the Intergovernmental Panel on Climate Change. 2013; Cambridge: Cambridge University Press. 1029–1136.
- Dayan U., Tubia A., Levy I. On the importance of synoptic classification methods with respect to environmental phenomena. International Journal of Climatology. 2012; 32: 681–694.
- Dewey K.F. Daily maximum and minimum temperature forecasts and the influence of snow cover. Monthly Weather Review. 1977; 105: 1594–1597.
- Falarz M. Snow cover variability in Poland in relation to the macro- and mesoscale atmospheric circulation in the 20th century. International Journal of Climatology. 2007; 27: 2069–2081.
- Foster J.L. The significance of the date of snow disappearance on the Arctic tundra as a possible indicator of climate change. Arctic and Alpine Research. 1989; 21: 60–70.
- Gutzler D.S., Rosen R.D. Interannual variability of wintertime snow-cover across the Northern Hemisphere. Journal of Climate. 1992; 5: 1441–1447.
- Heo J., McGinnis J.E., de Foy B., Schauer J.J. Identification of potential source areas for elevated PM2.5, nitrate and sulfate concentrations. Atmospheric Environment. 2013; 71: 187–197.
- Holton J.R., Hakim G.J. An introduction to dynamic meteorology. 2012; Waltham, MA: Academic Press. 5th edn.
- Houghton J.T., Ding Y., Griggs D.J., Noguer M., van der Linden P.J., Dai X., Maskell K., Johnson C.A. Climate change 2001. The scientific basis. Contribution of Working Group I of the third assessment report of the Intergovernmental Panel on Climate Change. 2001; Cambridge: Cambridge University Press.
- Hurrell J.W. Decadal trends in the North Atlantic Oscillation: regional temperatures and precipitation. Science. 1995; 269: 676–679.
- Iijima Y., Masuda K., Ohata T. Snow disappearance in eastern Siberia and its relationship to atmospheric influences. International Journal of Climatology. 2007; 27: 169–177.
- Kahl J.D., Samson P.J. Uncertainty in trajectory calculation due to low resolution meteorological data. Journal of Applied Meteorology and Climatology. 1986; 25: 1816–1831.
- Kalnay E., Kanamitsu M., Kistler R., Collins W., Deaven D., Gandin L., Iredell M., Saha S., White G., Woollen J., Zhu Y., Chelliah M., Ebisuzaki W., Higgins W., Janowiak J., Mo K.C., Ropelewski C., Wang J., Leetmaa A., Reynolds R., Jenne R., Joseph D. The NMC/NCAR 40-year reanalysis project. Bulletin of the American Meteorological Society. 1996; 77: 437–471.
- Kistler R., Collins W., Saha S., White G., Woollen J., Kalnay E., Chelliah M., Ebisuzaki W., Kanamitsu M., Kousky V., van den Dool H., Jenne R., Fiorino M. The NCEP–NCAR 50–year reanalysis: monthly means CD–ROM. Bulletin of the American Meteorological Society. 2001; 82: 247–267.
- Kohler J., Brandt O., Johanson M., Callaghan T. A long-term Arctic snow depth record from Abisko, northern Sweden, 1913–2004. Polar Research. 2006; 25: 91–113.
- Krenke A.N., Razuvaev V.N., Kitaev L.M., Martuganov R.A., Šakirzjanov R.I. Snežnost na territorii SNG i ego regionov v uclovijah globalnogo poteplenija (Snowiness over the CIS and its regions under conditions of the global warming.). Kriosfera Zemli. 2000; 4: 97–106.
- Kripalani R.H., Kulkarni A. Climatology and variability of historical Soviet snow depth data: some new perspectives in snow–Indian monsoon teleconnections. Climate Dynamics. 1999; 15: 475–489.
- McCabe G.J., Clark M.P., Serreze M. Trends in Northern Hemisphere surface cyclone frequency and intensity. Journal of Climate. 2001; 14: 2763–2768.
- Mestcherskaya A.V., Belyankina I.G., Golod M.P. Snow depth monitoring in the main corn belt of the former Soviet Union during the period of instrumental observations. Izvestiya. Academy of Sciences USSR. 1995; 5: 101–110.
- Morinaga Y., Tian S.-F., Shinoda M. Winter snow anomaly and atmospheric circulation in Mongolia. International Journal of Climatology. 2003; 23: 1627–1636.
- Peings Y., Brun E., Mauvais V., Douville H. How stationary is the relationship between Siberian snow and Arctic Oscillation over the 20th century?. Geophysical Research Letters. 2013; 40: 183–188.
- Popova V. Winter snow depth variability over northern Eurasia in relation to recent atmospheric circulation changes. International Journal of Climatology. 2007; 27: 1721–1733.
- Räisänen J. Warmer climate: less or more snow?. Climate Dynamics. 2008; 30: 307–319.
- Rikiishi K., Sakakibara J. Seasonal cycle of the snow coverage in the former Soviet Union and its relation with atmospheric circulation. Annals of Glaciology. 2004; 38: 106–114.
- Robinson D.A., Kukla G. Maximum surface albedo of seasonally snow-covered lands in the Northern Hemisphere. Journal of Applied Meteorology and Climatology. 1985; 24: 402–411.
- Robock A. The seasonal cycle of snow cover, sea ice and surface albedo. Monthly Weather Review. 1980; 108: 267–285.
- Rogers J.C., Mosley-Thompson E. Atlantic Arctic cyclones and the mild Siberian winters of the 1980s. Geophysical Research Letters. 1995; 22: 799–802.
- Rolph G.D. Real-time Environmental Applications and Display sYstem (READY). 2016; Silver Spring, MD: National Oceanic and Atmospheric Administration Air Resources Laboratory.
- Saito K., Cohen J. The potential role of snow cover in forcing interannual variability of the major Northern Hemisphere mode. Geophysical Research Letters. 2003; 30: 1302. doi: http://dx.doi.org/10.1029/2002GL016341.
- Salvador P., Artinano B., Pio C., Afonso J., Legrand M., Puxbaum H., Hammer S. Evaluation of aerosol sources at European high altitude background sites with trajectory statistical methods. Atmospheric Environment. 2010; 44: 2316–2329.
- Serreze M., Barry RG. Synoptic activity in the Arctic Basin. Journal of Climate. 1988; 1: 1276–1295.
- Serreze M.C., Box R.G., Barry R.G., Walsh J.E. Characteristics of Arctic synoptic activity. Meteorology and Atmospheric Physics. 1993; 51: 147–164.
- Stein A.F., Draxler R.R., Rolph G.D., Stunder B.J.B., Cohen M.D., Ngan F. NOAA's HYSPLIT atmospheric transport and dispersion modeling system. Bulletin of the American Meteorological Society. 2015; 96: 2059–2077.
- Symon C., Arris L., Heal B. Arctic climate impact assessment. 2005; Cambridge: Cambridge University Press.
- Tachibana Y. A statistical study of the snowfall distribution on the Japan Sea side of Hokkaido and its relation to synoptic-scale and meso-scale environments. Journal of the Meteorological Society of Japan. 1995; 73: 697–715.
- Veselov V.M. Arhivy Gosfonda na PĖVM i tehnologija ih organizacii (Archives of the state fund on personal computers and a method of their organization.). Trudy Vserossijskogo Naučno-Issledovatelskogo Instituta Gidrometeorologičeskoj Informacii—Mirovogo Centra Dannyh. 2002; 170: 16–30.
- Wagner A.J. The influence of average snow depth on monthly mean temperature anomaly. Monthly Weather Review. 1973; 101: 624–626.
- Yarnal B. Synoptic climatology in environmental analysis . 1993; London: Belhaven Press.
- Yarnal B., Comrie A.C., Frakes B., Brown D.P. Developments and prospects in synoptic climatology. International Journal of Climatology. 2001; 21: 1923–1950.
- Ye H. Decadal variability of Russian winter snow accumulation and its associations with Atlantic sea surface temperature anomalies. International Journal of Climatology. 2000; 20: 1709–1728.
- Ye H. Quasi-biennial and quasi-decadal variations in snow accumulation over northern Eurasia and their connections to the Atlantic and Pacific Oceans. Journal of Climate. 2001a; 14: 4573–4584.
- Ye H. Increases in snow season length due to earlier first snow and later last snow dates over north central and northwest Asia during 1937–94. Geophysical Research Letters. 2001b; 28: 551–554.
- Ye H., Cho H.R., Gustafson P.E. The changes in Russian winter snow accumulation during 1936–83 and its spatial patterns. Journal of Climate. 1998; 11: 856–863.
- Ye H., Ellison M. Changes in transitional snowfall season length in northern Eurasia. Geophysical Research Letters. 2003; 30: 1252.
- Ye H., Mather J.R. Polar snow cover changes and global warming. International Journal of Climatology. 1997; 17: 155–162.
- Zhang X., Walsh J.E., Zhang J., Bhatt U.S., Ikeda M. Climatology and inter-annual variability of Arctic cyclone activity: 1948–2002. Journal of Climate. 2004; 17: 2300–2317.