Abstract
Variations in extreme precipitation can be described by various indices. In order to evaluate a climate model's ability to simulate extreme precipitation, gridded extreme precipitation indices from observations are needed. There are two ways to obtain gridded extreme precipitation indices from station-based observations: either through interpolation of station-based extreme indices (EISTA) or estimated from gridded precipitation datasets (EIGRID). In this work, we evaluated these two methods and compared observational extreme precipitation indices in China to those obtained from a set of widely used global climate models. Results show that the difference between the two methods is quite large; and in some cases it is even larger than the difference between model simulations and observed gridded EISTA. Based on the sensitivity of the indices to horizontal resolution, it was suggested that EIGRID is more appropriate for evaluating extreme indices simulated by models. Subsequently, historic simulations of extreme precipitation from 21 CMIP5 (Coupled Model Intercomparison Project Phase 5) global climate models were evaluated against two reanalysis datasets during 1961–2000. It was found that most models overestimate extreme precipitation in the mountain regions in western China and northern China and underestimate extreme precipitation in southern China. In eastern China, these models simulate mean extreme precipitation fairly well. Despite this bias, the temporal trend in extreme precipitation for western China is well captured by most models. However, in eastern China, the trend of extreme precipitation is poorly captured by most models, especially for the so-called southern flood and northern drought pattern. Overall, our results suggest that the dynamics of inter-decadal summer monsoon variability should be improved for better prediction of extreme precipitation by the global climate models.
1. Introduction
Detecting and predicting extreme climate events are important topics in climate sciences due to their great impact on humans and economies (Kunkel et al., Citation1999; Easterling et al., Citation2000; Meehl et al., Citation2000). In particular, extreme precipitation is one of the most important variables for practical needs, but it is difficult to define precisely due to its weak spatial coherence (Frich et al., Citation2002; Alexander et al., Citation2006).
China is frequently hit by extreme precipitation events (e.g. floods and droughts), causing enormous economic loss and societal disruptions (Zhai et al., Citation2008). For instance, the floods in 1998 caused $36 billion in economic losses and killed more than 3000 people in the Yangtze River valley in southern China and in the Nenjiang-Songhuajiang valley in North-east China (NCC, Citation1998). The frequency of such events is likely to increase in association with climate warming (Gong and Wang, Citation2000; Qian et al., Citation2007; Feng et al., Citation2011). To predict future change in extreme precipitation events, an understanding of the recent past is required, in addition to improving the fidelity of global climate model and future forcings.
Global climate models provide a basis to project the future change in extreme precipitation events (McAfee et al., Citation2011; Timm et al., Citation2011; Xu et al., Citation2011), but there are large uncertainties in model projections (IPCC, Citation2012). Before assessing projections into the future, it is therefore essential to evaluate the models’ performances in simulating extremes with respect to observations. In particular, because of limitations associated with the spatial distribution and homogeneity of station observations, we need a reasonable metric to compare observed extremes with those simulated. For instance, a simple average of stations available in an area represented by a model grid could lead to a bias if there is an unequal spatial density of stations. To overcome this problem, Frich et al. (Citation2002) selected approximately one station every 250 000 km2 to get an evenly distributed station network of observations. But since the selected stations in this approach can be subective, gridded datasets are to be preferred when examining regional trends and evaluating model simulations (Kiktev et al., Citation2003; Alexander et al., Citation2006).
Extreme precipitation events are often described by indices based on precipitation rate (Moberg et al., Citation2006) and for many scientific purposes and practical convenience, such indices are often needed on regular grids. Then precipitation extremes estimated from station-based observations have to be converted to grid values, i.e. real-averaged indices. In general, there are two ways to obtain gridded extreme precipitation indices from station observations (Chen and Knutson, Citation2008):
By calculating extreme precipitation indices from daily observations for all available stations, and then interpolate the stations extreme indices into different horizontal resolutions (this method will henceforth be referred to as EISTA).
By interpolating daily station observations into different horizontal resolutions (area-mean precipitation) and subsequently calculating extreme precipitation indices based on the gridded precipitation (EIGRID hereafter). A previous study suggested that the difference between the two approaches can be significant (Chen and Knutson, Citation2008).
Both approaches have been widely used to evaluate model-simulated extreme precipitation indices in China (e.g., Jiang et al., Citation2009, Citation2011; Xu et al., Citation2009, Citation2011; Feng et al., Citation2011; Li et al., Citation2011). A comparison of simulated precipitation extremes from ECHAM5 (T319, 0.375×0.375°) with observations based on EIGRID, showed that the model overestimated extreme precipitation by more than 30% for most parts of China (Feng et al., Citation2011). Conversely, when compared to observations based on EISTA, the simulated extreme precipitation in China was in general underestimated (Jiang et al., Citation2011). Moreover, all models used by the IPCC AR4 tend to underestimate extreme precipitation during summer in eastern China by as much as 50% (Li et al., Citation2011), which has implications for regions such as North-east China where most of the extreme precipitation occurs during summer (Bai et al., Citation2007). Clearly, to what extent the difference in extreme precipitation indices created by the two different methods influences model-observation comparisons still needs to be quantified. Although such differences were previously noted by Jiang et al. (Citation2009), only very general features about the range of the difference was given in their work. Moreover, an increase in the spatial resolution of a model may improve its ability to more adequately simulate extreme precipitation (Kharin et al., Citation2005; Chen and Knutson, Citation2008), but the influence of grid-cell size on gridded extreme precipitation has not been adequately investigated.
This study focuses on finding a suitable gridding method for analyzing observed extreme precipitation, and then evaluating the performance of global climate models using observations in China. Specifically, the objectives of this study are:
To quantify the scaling effect on gridded extreme precipitation indices in China by examining the influence of changes in grid-cell size (ranging from 0.5×0.5° to 4×4°), and to explore the difference between gridded extreme indices from EISTA and EIGRID.
To evaluate the simulated climatological mean and linear trend of a number of extreme precipitation indices from 21 CMIP5 (Coupled Model Intercomparison Project Phase 5) global climate models (Taylor et al., Citation2012) against two reanalysis datasets, NCEP/NCAR reanalysis I (Kalnay et al., Citation1996) and ERA40 reanalysis (Uppala et al., Citation2005), using gridded extreme precipitation indices from EIGRID on the same resolution.
2. Data and methods
2.1. Observation and reanalysis datasets
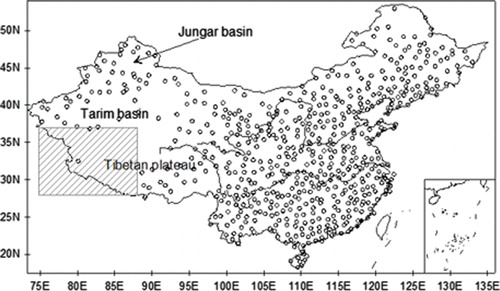
We used daily observations from 592 out of 753 stations in China, those containing less than 1 yr of missing values, for the 1961–2000 period. This is the same dataset used by Chen et al. (Citation2010). The locations of the stations are shown in . The station density in East China is much higher than that in West China. Particularly in the western part of the Tibetan Plateau the station density is sparse, and consequently stations in this region (south of 37°N, west of 88°N, see ) were not used in this analysis. The 592 station observations were interpolated onto a 0.5×0.5° grid system by using ordinary kriging with four seasonal semi-variograms (more details about the procedure can be found in Chen et al., Citation2010). The 0.5×0.5° gridded precipitation was subsequently averaged into grids with progressively lower resolution in 0.5° step: 1×1, 1.5×1.5, and so on to the lowest resolution of 4×4°. Since the island area south of 21°N is relatively smaller compared to the grid-cell sizes for relatively course resolutions of used climate model datasets, only grids north of 21°N were considered for both observations and model simulations. Daily precipitation from NCEP/NCAR reanalysis I (Kalnay et al., Citation1996) and ERA40 reanalysis (Uppala et al., Citation2005) was used as references in the observation–simulation comparisons.
Fig. 1 Geographic location of the 592 stations with daily precipitation during 1961–2000 over Mainland China. (The western Tibet Plateau region (south of 37°N, west of 88°E, shaded box) contains few instrumental observations and was excluded in the comparison between model simulations and observations).
2.2. Precipitation indices
We choose 10 precipitation indices previously used by Alexander et al. (Citation2006) and Moberg et al. (Citation2006) (). Two of the 10 indices, the simple daily intensity index (SDII) and the annual total wet-day precipitation (PRCPTOT), are indices representing average precipitation conditions. In particular, differences in trends between SDII and PRCPTOT reflect changes in the character of precipitation (Moberg et al., Citation2006). Therefore these two indices are very useful to understand variations in extreme precipitation and to assess global climate models’ simulations of extreme precipitation. Thus, all the indices used here are referred to as extreme indices for the sake of simplicity in this article.
Table 1. Definition of the 10 precipitation indices used (most of them indicate extreme precipitation conditions)
The FClimDex software, obtained from http://cccma.seos.uvic.ca/ETCCDI, was used to calculate the precipitation indices. Two versions of gridded extreme precipitation indices were calculated based on different methods named EISTA and EIGRID. For EISTA, the selected indices were calculated for each of the 592 stations, and subsequently the station indices were interpolated onto a 0.5×0.5 grid using the inverse distance (power 2) method. The data were first interpolated onto an 18 km×18 km grid, and then the value for the 0.5×0.5° grid was obtained by averaging all 18 km×18 km grid values falling into the 0.5×0.5° grid. Finally, the 0.5×0.5° grid indices were aggregated into grids with progressively lower resolution according to the approach described above. For EIGRID, the extreme indices were directly calculated from the interpolated daily gridded precipitation on different resolutions from 0.5×0.5° to 4×4°.
The CMIP5 experiments address outstanding scientific questions that arose during the preparation of the IPCC AR4 (Taylor et al., Citation2012). There are mainly three groups of simulations based on the major purposes: one for evaluation and the other two for projections and estimating feedbacks. The historical ensemble simulations, belonging to the evaluation simulations (Taylor et al., Citation2012), were used in this work.
Data from 21 CMIP5 global climate models (), with daily precipitation available during 1961–2000, were used to evaluate model-simulated extreme precipitation in China. The historical ensemble simulations of the first realisation of the first version of models (r1i1p1) were used in this study. The same 10 indices as above () were calculated from simulated daily precipitation for each model. In order to evaluate the model-simulated extreme indices, 0.5×0.5 gridded precipitation was also aggregated into grids with the same resolution as the respective model. Then the model-simulated indices were compared with the corresponding observed indices at the same resolution.
Table 2. Horizontal resolution (longitude×latitude in degrees) of the 21 CMIP5 global climate models used
2.3. Scaling effect on extreme precipitation
Since the increase in grid-cell size affects the distribution of daily precipitation for a selected grid point, changes of grid-cell size can influence the accumulated percentage of extreme precipitation. Consequently, the mean conditions of different extreme indices will change following the increase of grid-cell size. In order to examine the magnitude of the scaling effect, empirical cumulative distribution functions (ECDF) (Rice, Citation1995) was calculated for each grid-cell at the different resolutions. The ECDF of a time series is calculated as follows:1
where x is the selected threshold of daily precipitation amount, x
i
indicates the daily precipitation amount of the i-th day of a selected grid point and n is the total number of days. The number of days with precipitation less than, or equal to, the given value x are counted. Then, if there are k days with daily precipitation less than, or equal to, the given value x. Consequently, the cumulative percentage of extreme precipitation days (CP-ExtrP, units: %), which is greater than the selected threshold x, can be written as
2
3. Results
3.1. Influence of grid size on extreme indices
An example is shown in a and b) for the central grid point at 110.5°E, 25.5°N. There are four 0.5×0.5° grids within one 1×1° grid. The ECDF value for the 1×1° grid can be apprehended in two ways: either by calculating the ECDF for the 1×1° grid-cell directly (ECDF11×1), or by calculating the ECDF from the four 0.5×0.5° grids separately, and then averaging these (ECDF10.5×0.5). The influence of grid-cell size on the ECDF is assessed by comparing the two ECDFs.
Fig. 2 Empirical cumulative distribution function (ECDF) of 1×1° grid-cell centered at (110.5°E, 25.5°N) as an example (a) (ECDF11×1 indicates the ECDF of 1×1° by calculating the ECDF for the 1×1° grid box directly, ECDF10.5×0.5 indicates the ECDF of 1×1° by averaging the ECDFs of all 0.5×0.5° grids falling in 1×1° grid-box), and (b) shows the difference between two types of ECDF of 1×1° (ECDF11×1−ECDF10.5×0.5) in (a).
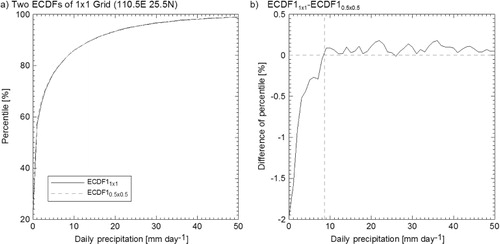
In this particular example, the cumulative percentage of dry days (daily precipitation less than 1°mm) in ECDF11×1 is smaller than in ECDF10.5×0.5, while the cumulative percentage of low-precipitation days (daily precipitation greater than 1 mm but less than the precipitation at a change point) in ECDF11×1 is greater than that in ECDF10.5×0.5. The change point is defined as the point where the cumulative percentage in ECDF11×1 changed from less than that in ECDF10.5×0.5 to greater than that in ECDF10.5×0.5. It can be regarded as the threshold between low-precipitation and high-precipitation (precipitation larger than the precipitation at the change point) days. The cumulative percentage of high precipitation in ECDF11×1 is smaller than that in ECDF10.5×0.5 indicating that the cumulative percentage of heavy precipitation, especially extremely high precipitation, decreases with increasing grid-cell size. From this example, it is clear that the cumulative percentage of precipitation in different grid-cells will change in three directions with increasing size of the grid-cell: the number of dry days will decrease, the number of low-precipitation days will increase, and the number of high- (or heavy) precipitation days will decrease. The scaling effects on the precipitation distribution are similar for most grid-cells, with only a few exceptions where precipitation rates are extremely low.
The change in the cumulative percentage of dry and extreme precipitation (>20 mm/d: R20 mm) days with respect to an increase in the grid-cell size (1×1°, 2×2°, 3×3° and 4×4°) and to the annual total precipitation are examined in . It is clear that the percentage of dry and R20 mm d decreases with increasing grid-cell size. There is also a decreasing trend going from the west (dry region) to the east (wet region). The linear trend of the decrease in the accumulative percentage of dry days following an increase in annual mean grid-cell precipitation is 1.0, 3.6, 6.2 and 8.9% per 1000 mm for resolutions of 1×1°, 2×2°, 3×3° and 4×4°, respectively (a). It should be mentioned that there were some grid-cells, especially in the desert region in western China, where the percentage of dry day increased with increasing grid-cell size, but this is mainly due to the extremely low number of days with precipitation > 1 mm/d in this region. The linear trend of the decrease in the accumulative percentage of R20 mm d following an increase of annual mean grid precipitation is 0.08, 0.33, 0.70 and 1.06 per 1000 mm for resolutions of 1×1°, 2×2°, 3×3° and 4×4°, respectively (b).
Fig. 3 The relationship between annual total precipitation and the change of cumulative percentage of dry day (prep≤1 mm) (CCP-DryDay) for four resolutions (CCP-DryDay is the difference of cumulative percentage of dry day for i×i° (i indicates 1, 2, 3 and 4, which means four different resolutions from 1×1° to 4×4°) between the cumulative percentage of dry day calculated from i×i° precipitation directly and the mean of the cumulative percentage of dry day of all the 0.5×0.5° grid falling in the i×i° grid-box) (a), (b) same as (a) but for the change of cumulative percentage of extreme precipitation day (CCP-ExtrP) with daily precipitation higher than 20 mm, and (c) same as (b) but for daily precipitation higher than 10 mm.
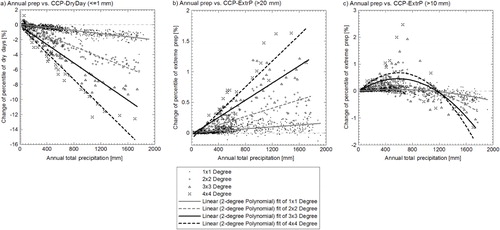
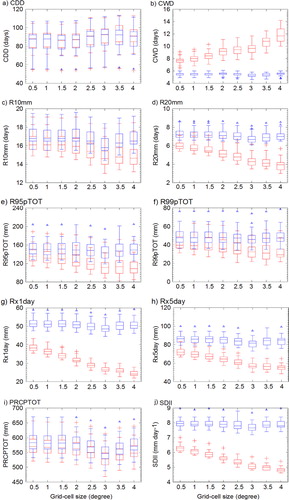
Fig. 4 Comparison between extreme precipitation indices based on EISTA (Blue) and EIGRID (Red) over Mainland China with 8 different horizontal resolutions (0.5×0.5, 1×1, 1.5×1.5, 2×2, 2.5×2.5, 3×3, 3.5×3.5, and 4×4 degree) for the 10 indices (a–j) listed in . The Box–Whisker plots show the statistic characteristic of the indices at the selected resolution during 1961–2000. The lower, middle and upper lines of the box show the lower quartile (Q1, QL is the value of Q1), median (Q2), upper quartile (Q3, QU is the value of Q3) respectively, while the ends of the whiskers shows the lowest datum still within 1.5 interquartile range (IQR, IQR = QU-QL) of the Q1, and the highest datum still within 1.5 IQR of the Q3. Data fall below QL−1.5×IQR or above QU−1.5×IQR have been shown as outliers.
Following the accelerated decreasing trend of accumulative percentage of dry and R20 mm d against the increase of annual total grid-cell precipitation with increasing grid-cell size (a and b), days with daily precipitation > 10 mm (R10 mm) decreased in the dry regions and increased in the wet regions (c). Further, the amplitude of the decreasing or increasing trends increased with increasing grid-cell size.
3.2. Difference between gridded extreme indices based on EISTA and EIGRID
From the earlier analysis, it is clear that with increasing grid-cell size, dry and very wet (heavy precipitation) days will decrease, while the number of low-precipitation days will increase, which means that the change in grid-cell size will have an effect on the extreme precipitation indices for the grid-cell.
Next, the difference between gridded extreme precipitation indices from EISTA and EIGRID at different resolutions is examined. The results from eight different grid-cell sizes are shown in . Compared to the gridded indices from EISTA, all indices from EIGRID, except for CDD and CWD, decrease linearly with increasing grid-cell size. The difference between extreme precipitation indices from EISTA and EIGRID is quite large, especially for larger gird-cells (lower horizontal resolution). Taking SDII as an example, the differences between the two methods range from 21 to 32% (from 0.5×0.5° to 4×4°). A previous comparison between modelled and observed extremes in China by Jiang et al. (Citation2011) found that the simulated ensemble mean of SDII was 27% lower (18–32% lower for different models with different resolutions) than observations from EISTA. Our results show that the difference between EISTA and EIGRID is even larger than the difference between model simulations and observations (from EISTA).
Among all indices examined, CDD is least influenced by variations in grid-cell size. This is understandable, since CDD indicates long lasting dry conditions which normally occur over a relatively large area. Thus, the difference between CDD from EISTA and EIGRID is small. CWD generally increases with increasing grid-cell size, mainly due to the increased number of wet days in wet regions, as discussed in Section 3.1. This coincides with decreasing precipitation intensity (SDII decreases following an increase of grid-cell size) and a reduced change in total precipitation (PRCPTOT). The difference of CDD between EISTA and EIGRID is quite small and can be ignored: hence CDD can be regarded as an index which, on average, is fairly independent on grid-cell size.
In general, the ratio of all the indices between EISTA and EIGRID increases with the increase in grid-cell size (not shown). At the same time, it is obvious that the differences in extreme indices between EISTA and EIGRID, except for CDD, are so large that it cannot be ignored. Based on the sensitivity of index to horizontal resolution change, we conclude that its better to use EIGRID to evaluate the model-simulated extreme indices, which is in agreement with the results obtained by Chen and Knutson (Citation2008).
4. Model-simulated extreme indices
4.1. Simulated mean condition
Following the above analysis, the CMIP5 models performances in simulating mean condition of extreme precipitations was evaluated using the extreme indices from EIGRID at the same resolution as the selected models. Due to the fact that the atmospheric circulation and topography are quite different in western and eastern China, the model-simulated annual mean extreme precipitations are evaluated separately for eastern () and western () China.
Fig. 5 Comparison of extreme indices from 21 CMIP5 global climate models, multi-model ensemble (MME) and two reanalysis (Red) and gridded observation based on EIGRID with the same resolution (Blue) over Eastern China (south of 21°N is not counted) for 10 precipitation indices (a–j) (Same Box–Whisker Plots as in have been used).
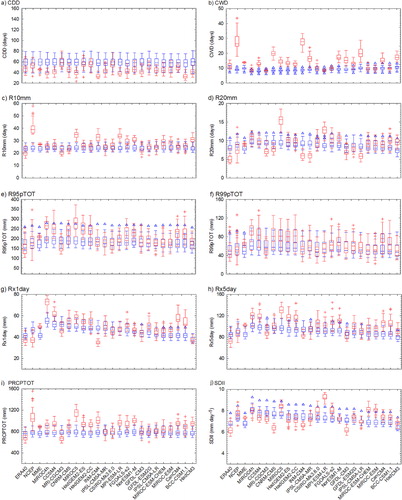
Fig. 6 Same as , but for western China (the west Tibet Plateau region (south of 37°N, west of 88°E) is not included).
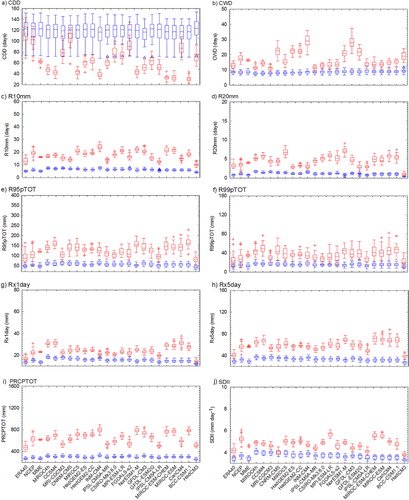
Generally, extreme precipitation is better reproduced in eastern China compared to that in western China. The results of multi-model ensemble (MME) agree better with observation compared to individual models, as expected (Wang et al. Citation2012). Regarding the reanalysis datasets, the extreme indices from ERA40 in general agree better with the observations compared with those from NCEP, which was previously found by Ma et al. (Citation2009). The climatology of CDD (CWD) is generally underestimated (overestimated) for both eastern and western China. This indicates that the climate models tend to overestimate the number of wet days, especially those with moderate precipitation rates. About 30% of the models reproduce mean CDD and CWD conditions more accurately in eastern China than in western China. In eastern China most models reproduce the extreme precipitation quite well: R10 mm d are generally well reproduced, but 1/3 of the models tend to underestimate R20 mm d. Models with higher resolutions tend to simulate more extreme precipitation (R95pTOT and R99pTOT) and higher rain intensity (R×1day and R×5day). Total precipitation (PRCPTOT) is mainly overestimated, while rain intensity (SDII) is better reproduced with relatively large model uncertainty. In western China, all extreme indices, except CDD, are overestimated by the investigated models. Overestimation of precipitation is a common feature for global climate models (e.g. Su et al., Citation2013).
From the earlier analysis, it is evident that there are large differences in the reproduced extreme precipitation. Next, we compare the spatial patterns of simulated and observed extreme. The spatial pattern of the difference between simulated and observed extremes is generally the same for all the selected extreme precipitation indices, except for CDD. Here only the spatial patterns of the difference between simulated and observed R95pTOT (), one widely used index to illustrate the extreme precipitation, and CDD () are shown. All models and reanalysis datasets simulated higher extreme precipitation (R95pTOT) and less CDD in western China and northern China, and less extreme precipitation and more CDD in South-east China. The largely overestimated precipitation around the boundary region of the Tibetan Plateau may be due to the difficulty for models to correctly describe the influence of the topography (Feng et al., Citation2011). The difference between simulated R95pTOT and observation in Tarim and Jungar basins may have to do with the fact that these regions have few observations (Feng et al., Citation2011). The relatively poor performance of the climate models in western China is most likely due to the low occurrence of extreme precipitation and rain days in this region compared to eastern China (Fu et al., Citation2008).
Fig. 7 Relative error of mean R95pTOT during 1961–2000 for two reanalysis (a, b), multi-model ensemble (MME) (c) and 21 CMIP5 global climate models (d–x) (units: % of observation values).
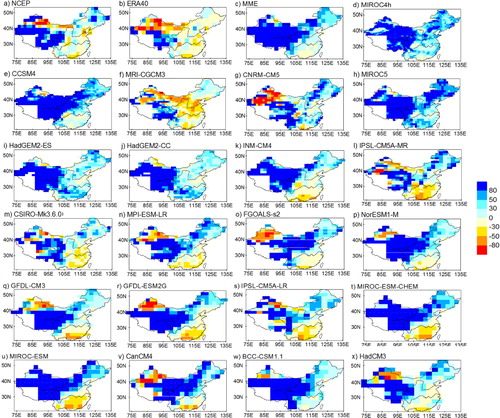
Fig. 8 Same as , but for CDD.
Most of the models simulate less (more) extreme precipitation in South-east (North-east and West) China compared to the observations (), and the pattern coincides with the pattern of CDD for most of the models, with more CDD linked with less extreme precipitation and vice versa. The overestimated extreme precipitation in northern China and underestimated extreme precipitation in southern China lead to seemingly fairly reproduced extreme precipitation in eastern China.
4.2. Temporal trend of simulated extreme precipitation
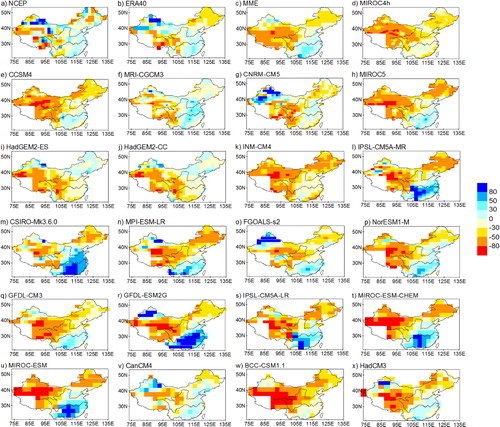
We further evaluated the linear trend of the simulated extreme precipitation during 1961–2000 to see if the climate models could simulate the observed change over the period. Owing to the reasons mentioned in Section 4.1, only the spatial patterns of linear trend of R95pTOT () and CDD () are shown. Indeed, the general patterns of the linear trend of all extreme indices, except for CDD, are quite similar to those of R95pTOT, especially in East China. The linear trend of the simulations was compared with the gridded indices from EIGRID with 2.5×2.5° horizontal resolution.
Fig. 9 Linear trend of R95pTOT during 1961–2000 (units: % per 10 yr) for two reanalysis (a, b), gridded observation based on EIGRID at 2.5×2.5° resolution (c), multi-model ensemble (MME) (d) and 21 CMIP5 global climate models (e–y).
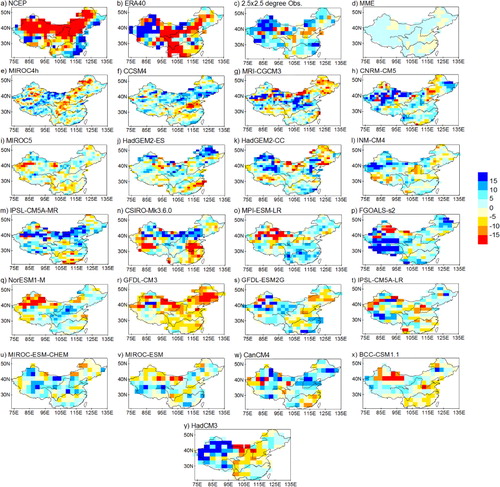
Fig. 10 Same as , but for CDD.
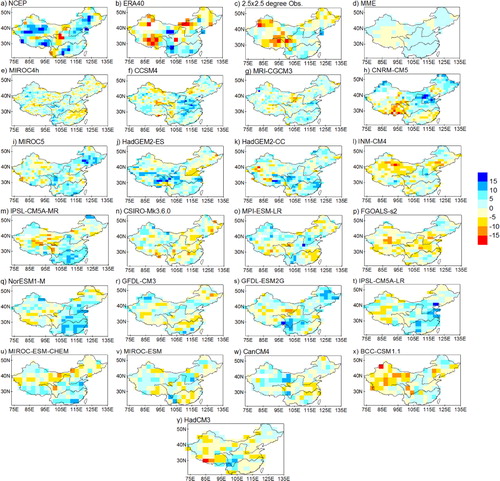
The observed R95pTOT has an increasing trend in most parts of China, except in northern China where the extreme precipitation decreased, during 1961–2000 (c). This pattern is called southern flood and northern drought pattern (Wang et al., Citation2012). The difference in trends of extreme precipitation for northern and southern China has previously been discussed by Qian et al. (Citation2007), who attributed the pattern to the weakening of the East Asian monsoon. The observed increasing trend of extreme precipitation in North-west China is well captured by most of the models, but the trends in South-east and northern China are poorly reproduced (). This is also true for the result of an MME, where the sign of the linear trend is well reproduced in western and North-east China, but the sign of the simulated linear trend in eastern China is opposite to that of the observation.
The observed CDD shows decreasing trends in North-west and North-east China and an increasing trend in eastern China from 1961 to 2000 (c). This spatial pattern is clearly illustrated by the first Empirical Orthogonal Function pattern of CDD from 1961 to 2000 (Xu et al., Citation2011), which indicates that the observed change of CDD is dominating. The sign of the linear trend of CDD from the MME agrees quite well with the observation, except for North-east China and part of Xinjiang province.
Generally, the observed linear trend of CDD is opposite to the trend of R95pTOT (c and c), but in South-east China, the R95pTOT and CDD both increased during 1961–2000. The simulated linear trend of CDD is opposite to the trend of R95pTOT in the study area ( and ). The same trend of CDD and R95pTOT in South-east China is poorly captured by most of the investigated models.
5. Discussion and conclusion
As can be seen from , the cumulative percentage of R20 mm d decreases all over China with an increase in grid-cell size. But when the cumulative percentage of R10 mm d is concerned, no systematic biases can be seen. This indicates that the influence of grid-cell size mainly affects heavy precipitation rates. As a result, the difference of R20 mm d between the two methods (EISTA and EIGRID) is larger than that of R10 mm d (c and d). The same is true for R95pTOT and R99pTOT (e and f).
From , it is clear that the average of indices within the study area from EISTA, which should be insensitive to variation in horizontal resolution, changes with the increase in grid-cell size (decreasing horizontal resolution). This is mainly due to the way of dealing with the grid-cells that lie on the boundaries, i.e. those which are partly within and partly outside the study area where there are no observations in the neighbouring grid-cells outside the study area, and is especially evident at lower resolutions (bigger cells). Likely the results from EISTA will not display such conspicuous differences along with changes in grid-cell size if all the grids are located within the study area. Further studies of how to deal with boundary cells are needed, especially for relatively large grid-cells.
The increasing trend of extreme precipitation in west China is relatively well captured by most of the models. As pointed out by Gao et al. (Citation2002), the number of rain days in northwest China would significantly increase under global warming, and possibly this is the case for most of western China. That the greenhouse effect is well simulated in the global climate models could be the reason for the good agreement. However, when it comes to eastern China, where weather and climate are largely influenced by the East Asian monsoon system (Qian and Lee, Citation2000; Ding and Chan, Citation2005), the difference in trends of extreme precipitation in northern and southern China (Zhai et al., Citation2005; Qian et al., Citation2007) is poorly captured. This may be due to the difficulty to accurately represent the inter-annual and inter-decadal variations of the summer monsoon in this region by the models, as illustrated by Gu and Li (Citation2010).
The East Asian summer monsoon has weakened since the end of 1970s (Wang, Citation2001; Yu et al., Citation2004). Associated with the weakening tendency, precipitation decreased in northern China but increased over the middle and lower reaches of the Yangtze River valley (Hu et al., Citation2003; Yu et al., Citation2004; Yu and Zhou, Citation2007), which may have led to a decrease of extreme precipitation in northern China and an increase in southern China, especially along the Yangtze River valley (Qian et al., Citation2007). As pointed out by Zhou et al. (Citation2009), the East Asian summer monsoon has the lowest reproducibility and is the most poorly modelled of the Asian–Australian monsoon subsystems, based on the model simulation from the CLIVAR International “Climate of the twentieth century (C20C)” Project. The reason is mainly due to the failure of specifying historical sea surface temperature (SST) in capturing the zonal land-sea thermal contrast change across the East Asia. On the other hand, a well reproduced monsoon circulation does not necessarily lead to reasonable simulation of rainfall (Zhou and Li, Citation2002; Sperber et al., Citation2012), which indicates that other factors such as model physics related to precipitation processes most likely play a role too.
In addition to the impact of the East Asian summer monsoon, the significantly increased aerosol concentrations produced by air pollution may have reduced the light rain events in eastern China (Qian et al., Citation2009), which could be related to the increase in CDD in eastern China. The combined effects of the weakening of the East Asian Monsoon system and the increase of aerosols could have led to the increase of both CDD and heavy precipitation in southern China, but in northern China, CDD increases with the decrease of extreme precipitation. Moreover, the natural variability related to the Pacific Decadal Oscillation (PDO), which is strongly associated with precipitation in China (Shen et al., Citation2006; Ma, Citation2007), is not well resolved in global climate models (Furtado et al., Citation2011). This will also lead to the bias of global climate model in reproducing extreme precipitation in China. Consequently, improved monsoon dynamics and model physics for reproducing monsoon rainfall should be emphasised in the future development of global climate models. Also, the aerosol effects need more attention in order to better simulate extreme precipitation in eastern China.
Based on the above analysis, some conclusions can be drawn as follows:
Except for the western Tibetan Plateau and central western China, where there is very little precipitation or few observational stations, the number of dry (wet) days for a grid-cell decreases (increases) and the intensity of extreme precipitation decreases following the increase in grid-cell size.
The difference between observed gridded extreme indices from EISTA and EIGRID, with the scaling effect considered, is significant. In fact, the difference is often larger than the difference between model simulation and observations based on EISTA. Therefore, it is suggested that gridded extreme precipitation indices based on EIGRID should be used when evaluating model simulations.
The climatology of extreme precipitation is generally overestimated by most of the models, especially in western China and the mountain regions. Extreme precipitation is overestimated in northern China and underestimated in southern China, while the simulated climatology of extreme precipitation in eastern China is fair.
The temporal trend of extreme precipitation during 1961–2000 in western China is generally well captured by most of the studied models, while in eastern China, the trend in extreme precipitation is poorly captured.
The difference in CDD and R95pTOT trends between northern and southern China, where CDD and R95pTOT both increased in southern China, but in northern China CDD increased and R95pTOT decreased, is poorly captured by most models. Due to the reasons given above, it is suggested that monsoon dynamics, model physics in reproducing monsoon rainfall and the aerosol effect on precipitation should be emphasised in the future development of global climate models.
Acknowledgements
The author thank Professor Tianjun Zhou from LASG, Institute of Atmospheric Physics, Chinese Academy of Sciences, Beijing, China PR. for his constructive suggestions for the final revising and the anonymous reviewers for their helpful comments. Jee-Hoon Jeong and Tinghai Ou were supported by the Korea Meteorological Administration Research and Development Program under Grant CATER 2012-3066. The authors acknowledge the World Climate Research Programme's Working Group on Coupled Modelling, which is responsible for CMIP, and we thank the climate modelling groups (listed in of this article) for producing and making available their model output. For CMIP the US Department of Energy's Program for Climate Model Diagnosis and Intercomparison provides coordinating support and led development of software infrastructure in partnership with the Global Organization for Earth System Science Portals. This article contributes to the Swedish strategic research area “Modelling the Regional and Global Earth system” (MERGE).
Related Research Data
References
- Alexander L. V , Zhang X , Peterson T. C , Caesar J , Gleason B , co-authors . Global observed changes in daily climate extremes of temperature and precipitation. J. Geophys. Res – Atmos. 2006; 111: D05109.
- Bai A , Zhai P. M , Liu X. D . Climatology and trends of wet spells in China. Theor. Appl. Climatol. 2007; 88: 139–148.
- Chen C. T , Knutson T . On the verification and comparison of extreme rainfall indices from climate models. J. Climate. 2008; 21: 1605–1621.
- Chen D. L , Ou T. H , Gong L. B , Xu C. Y , Li W. J , co-authors . Spatial interpolation of daily precipitation in China: 1951–2005. Adv. Atmos. Sci. 2010; 27: 1221–1232.
- Ding Y. H , Chan J. C. L . The East Asian summer monsoon: an overview. Meteorol. Atmos. Phys. 2005; 89: 117–142.
- Easterling D. R , Evans J. L , Groisman P. Y , Karl T. R , Kunkel K. E , co-authors . Observed variability and trends in extreme climate events: a brief review. B. Am. Meteorol. Soc. 2000; 81: 417–425.
- Feng L , Zhou T. J , Wu B , Li T , Luo J. J . Projection of future precipitation change over China with a high-resolution global atmospheric model. Adv. Atmos. Sci. 2011; 28: 464–476.
- Frich P , Alexander L. V , Della-Marta P , Gleason B , Haylock M , co-authors . Observed coherent changes in climatic extremes during the second half of the twentieth century. Clim. Res. 2002; 19: 193–212.
- Fu J. L , Qian W. H , Lin X , Deliang C . Trends in graded precipitation in China from 1961 to 2000. Adv. Atmos. Sci. 2008; 25: 267–278.
- Furtado J. C , Di Lorenzo E , Schneider N , Bond N. A . North Pacific decadal variability and climate change in the IPCC AR4 models. J. Clim. 2011; 24: 3049–3067.
- Gao X. J , Zhao Z. C , Giorgi F . Changes of extreme events in regional climate simulations over East Asia. Adv. Atmos. Sci. 2002; 19: 927–942.
- Gong D. Y , Wang S. W . Severe summer rainfall in China associated with enhanced global warming. Clim. Res. 2000; 16: 51–59.
- Gu W , Li C.-Y . Evaluation of the IPCC AR4 climate models in simulating the interdecadal variations of the East China summer precipitation, PDO and NAO. Trans. Atmos. Sci. 2010; 33: 401–411. (in Chinese with English abstract).
- Hu Z. Z , Yang S , Wu R. G . Long-term climate variations in China and global warming signals. J. Geophys. Res. – Atmos. 2003; 108: 4614.
- IPCC. Field C. B , Barros V , Stocker T. F , Qin D , Dokken D. J , Ebi K. L , Mastrandrea M. D , Mach K. J , Plattner G.-K , Allen S. K , Tignor M , Midgley P. M . Managing the risks of extreme events and disasters to advance climate change adaptation. A Special Report of Working Groups I and II of the Intergovernmental Panel on Climate Change. 2012
- Jiang Z , Chen W , Song J , Wang J . Projection and evaluation of the precipitation extremes indices over China based on seven IPCC AR4 climate models. Chin. J. Atmos. Sci. 2009; 33: 109–120. (in Chinese with English abstract).
- Jiang Z , Song J , Li L , Chen W , Wang Z , co-authors . Extreme climate events in China: IPCC-AR4 model evaluation and projection. Climatic Change. 2011; 110: 385–401.
- Kalnay E , Kanamitsu M , Kistler R , Collins W , Deaven D , co-authors . The NCEP/NCAR 40-year reanalysis project. B. Am. Meteorol. Soc. 1996; 77: 437–471.
- Kharin V. V , Zwiers F. W , Zhang X. B . Intercomparison of near-surface temperature and precipitation extremes in AMIP-2 simulations, reanalyses, and observations. J. Clim. 2005; 18: 5201–5223.
- Kiktev D , Sexton D. M. H , Alexander L , Folland C. K . Comparison of modeled and observed trends in indices of daily climate extremes. J. Clim. 2003; 16: 3560–3571.
- Kunkel K. E , Pielke R. A , Changnon S. A . Temporal fluctuations in weather and climate extremes that cause economic and human health impacts: a review. B. Am. Meteorol. Soc. 1999; 80: 1077–1098.
- Li H. M , Feng L , Zhou T. J . Multi-model projection of July–August climate extreme changes over China under CO2 doubling. Part I: precipitation. Adv. Atmos. Sci. 2011; 28: 433–447.
- Ma Z. G . The interdecadal trend and shift of dry/wet over the central part of North China and their relationship to the Pacific Decadal Oscillation (PDO). Chinese Sci. Bull. 2007; 52: 2130–2139.
- Ma L. J , Zhang T , Frauenfeld O. W , Ye B. S , Yang D. Q , co-authors . Evaluation of precipitation from the ERA-40, NCEP-1, and NCEP-2 reanalyses and CMAP-1, CMAP-2, and GPCP-2 with ground-based measurements in China. J. Geophys. Res.-Atmos. 2009; 114: D09105.
- McAfee S. A , Russell J. L , Goodman P. J . Evaluating IPCC AR4 cool-season precipitation simulations and projections for impacts assessment over North America. Clim. Dynam. 2011; 37: 2271–2287.
- Meehl G. A , Karl T , Easterling D. R , Changnon S , Pielke R , co-authors . An introduction to trends in extreme weather and climate events: observations, socioeconomic impacts, terrestrial ecological impacts, and model projections. B. Am. Meteorol. Soc. 2000; 81: 413–416.
- Moberg A , Jones P. D , Lister D , Walther A , Brunet M , co-authors . Indices for daily temperature and precipitation extremes in Europe analyzed for the period 1901–2000. J. Geophys. Res.-Atmos. 2006; 111: D22106.
- NCC (National Climate Center). China's 1998 Severe Flood and Climate Extremes.
- Qian W. H. , Fu J. K. , Yan Z. W . Decrease of light rain events in summer associated with a warming environment in China during 1961–2005. Geophys. Res. Lett. 2007; 34: L11705.
- Qian Y. , Gong D. Y. , Fan J. W. , Leung L. R. , Bennartz R. , co-authors . Heavy pollution suppresses light rain in China: observations and modeling. J. Geophys. Res. – Atmos. 2009; 114: D00K02.
- Qian W. H. , Lee D. K . Seasonal march of Asian summer monsoon. Int. J. Climatol. 2000; 20: 1371–1386.
- Rice J. A . Mathematical Statistics and Data Analysis. 1995; 2nd ed, Duxbury Press, California. 346–348.
- Shen C. M , Wang W. C , Gong W , Hao Z. X . A Pacific Decadal Oscillation record since 1470 AD reconstructed from proxy data of summer rainfall over eastern China. Geophys. Res. Lett. 2006; 33 L03702, DOI: 10.1029/2005GL024804.
- Sperber K. R , Annamalai H , Kang I.-S , Kitoh A , Moise A , co-authors . The Asian summer monsoon: an intercomparison of CMIP5 vs. CMIP3 simulations of the late 20th century. Clim. Dynam. 2012
- Su F , Duan X , Chen D , Hao Z , Lan C . Evaluation of the global climate models in the CMIP5 over the Tibetan Plateau. J. Clim. 2013. 26, 3187–3208.
- Taylor K. E , Stouffer R. J , Meehl G. A . An overview of CMIP5 and the experiment design. B. Am. Meteorol. Soc. 2012; 93: 485–498.
- Timm O. E , Diaz H. F , Giambelluca T. W , Takahashi M . Projection of changes in the frequency of heavy rain events over Hawaii based on leading Pacific climate modes. J. Geophys. Res.-Atmos. 2011; 116: D04109.
- Uppala S. M , Kallberg P. W , Simmons A. J , Andrae U , Bechtold V. D , co-authors . The ERA-40 re-analysis. Q. J. Roy. Meteor. Soc. 2005; 131: 2961–3012.
- Wang H. J . The weakening of the Asian monsoon circulation after the end of 1970's. Adv. Atmos. Sci. 2001; 18: 376–386.
- Wang H. J , Sun J. Q , Chen H. P , Zhu Y. L , Zhang Y , co-authors . Extreme climate in China: facts, simulation and projection. Meteorol. Z. 2012; 21: 279–304.
- Xu C. H , Luo Y , Xu Y . Projected changes of precipitation extremes in river basins over China. Quatern. Int. 2011; 244: 149–158.
- Xu Y , Xu C. H , Gao X. J , Luo Y . Projected changes in temperature and precipitation extremes over the Yangtze River Basin of China in the 21st century. Quatern. Int. 2009; 208: 44–52.
- Yu R. C , Wang B , Zhou T. J . Tropospheric cooling and summer monsoon weakening trend over East Asia. Geophys. Res. Lett. 2004; 31: L22212.
- Yu R. C , Zhou T. J . Seasonality and three-dimensional structure of interdecadal change in the East Asian monsoon. J. Clim. 2007; 20: 5344–5355.
- Zhai P. M , Zhang X. B , Wan H , Pan X. H . Trends in total precipitation and frequency of daily precipitation extremes over China. J. Clim. 2005; 18: 1096–1108.
- Zhai, P. M., Yan, Z. W. and Zhou, X. K. Climate Extremes and Related Disasters in China. 2008. In: Regional Climate Studies of China (eds. C. B. Fu, Z. H. Jiang, Z. Y. Guan, J. H. He, and Z. F. Xu). Springer Berlin, Heidelberg, pp. 313–344.
- Zhou T. J , Li Z. X . Simulation of the east Asian summer monsoon using a variable resolution atmospheric GCM. Clim. Dynam. 2002; 19: 167–180.
- Zhou T. J , Wu B , Scaife A. A , Bronnimann S , Cherchi A , co-authors . The CLIVAR C20C project: which components of the Asian-Australian monsoon circulation variations are forced and reproducible?. Clim. Dynam. 2009; 33: 1051–1068.