ABSTRACT
It is known that there is a distinct intraseasonal variation in wintertime atmospheric responses to El Niño over the North Atlantic, namely a positive North Atlantic Oscillation (NAO)-like response during early winter (November to December) and a negative NAO-like response during late winter (January to March). In this article, we suggest that the tropical North Atlantic (TNAL) sea surface temperatures (SSTs) significantly alter the North Atlantic atmospheric response to El Niño: the warm TNAL SST condition intensifies the negative NAO-like response and vice versa. During late El Niño winters, the TNAL SST tends to increase due to the atmospheric bridge between the tropical Pacific and the Atlantic oceans. The warm tendency in the TNAL SST can intensify the height contrast in the El Niño teleconnection between early and late winter. During early winter (when the response of the TNAL SST to El Niño has not been established yet), atmospheric circulation over the North Atlantic varies widely under various TNAL conditions. Consequently, the average influence of El Niño over the North Atlantic region becomes weaker in the early winter. By contrast, the overall warming over the TNAL region during the late El Niño winter is conducive to the formation of a negative NAO pattern. As a result, the climatic impact becomes stronger during the late winter.
1. Introduction
El Niño has been of interest to researchers due to its considerable impact on the global climate. Much effort has been focused toward gaining an understanding of various aspects of El Niño, including dynamics, teleconnection, climatic impacts (Montroy, Citation1997; Kang and An, Citation1998; Wang et al., Citation2000; Wang and Fu, Citation2000; An and Jin, Citation2004; Kug et al., Citation2010). Because understanding the climatic impacts of El Niño provides a basis for a better forecast of regional climates, the climatic impacts of El Niño on the Pacific area and the tropical basins have been thoroughly analysed (Van Loon and Madden, Citation1981; Halpert and Ropelewski, Citation1992; Diaz et al., Citation2001; Hoerling et al., Citation2001).
While the influence of El Niño on the Pacific and tropical climates is relatively well established, its effects on the North Atlantic and European climates are still controversial (Fraedrich, Citation1990; Pozo-Vazquez et al., Citation2001; Mathieu et al., Citation2004; Bronnimann, Citation2007; Bronnimann et al., Citation2007). For example, Pozo-Vazquez et al. (Citation2001) reported that no statistically significant sea level pressure (SLP) anomaly patterns were found to be associated with El Niño, while a statistically significant pattern resembling the positive phase of the North Atlantic Oscillation (NAO) was found during La Niña events. By contrast, Mathieu et al. (Citation2004) argued that the El Niño-Southern Oscillation (ENSO) event has significantly influenced the climates of the North Atlantic and European regions, but the impact of the ENSO varies between individual events. They also suggested that differences in individual ENSO events arise partly from differences in Indo-Pacific sea surface temperatures (SSTs), and partly from differences in Atlantic SSTs.
Other studies have suggested that these controversial results regarding the effect of El Niño arise from the highly non-linear and non-stationary response over the North Atlantic (Moron and Gouirand, Citation2003; Wu and Hsieh, Citation2004; Toniazzo and Scaife, Citation2006). Moron and Gouirand (Citation2003) showed a seasonal dependence in the relationship between atmospheric anomalies over the North Atlantic and El Niño: the relationship between ENSO episodes and SLP anomalies over the North Atlantic changes considerably between November–December and January–March. Consistently, several studies have found that El Niño events tend to be accompanied by a negative NAO in late winter (Gouirand and Moron, Citation2003; Moron and Plaut, Citation2003; Bronnimann et al., Citation2007).
Recently, the stratospheric response to El Niño has been identified to be attributed to the seasonal dependency of the remote impact over the North Atlantic region (Sassi et al., Citation2004; Bell et al., Citation2009; Cagnazzo and Manzini, Citation2009; Ineson and Scaife, Citation2009). According to these studies, a weakened stratospheric polar vortex can initiate a negative NAO pattern in the troposphere during late winter. In the present study, we propose another tropospheric process that contributes to the distinct late winter response to El Niño. We highlight the modulation effect of the tropical North Atlantic (TNAL) SST in the North Atlantic atmospheric circulation and its covariability with El Niño. In the following section, we describe the data and methodologies adopted throughout this article. We then present the modulation effect of the TNAL SST anomaly (SSTA) in the El Niño teleconnection in Section 3. At the end of the section, we suggest a possible process that contributes to strengthening the late winter response to El Niño. After discussing the implications of the present study compared to other previous studies, we summarise and conclude the article in Section 4.
2. Data and methodologies
We analysed the El Niño-related circulation pattern during winter using monthly mean reanalysis datasets. The reanalysis data were obtained from the National Center for Environmental Prediction/National Center for Atmospheric Research (NCEP/NCAR) (Kalnay et al., Citation1996). The dataset spanned from the winter of 1948–49 to the winter of 2009–2010. The Met Office Hadley Centre's monthly SST data were also analysed for the same period (Rayner et al., Citation2003). All data were analysed after being detrended. In order to verify the observational results, we also analysed a long-term (500-yr) simulation using the Geophysical Fluid Dynamics Laboratory (GFDL) CM2.1 coupled model (Delworth et al., Citation2006; Wittenberg et al., Citation2006). We used a 500-year pre-industrial control experiment, with fixed values for the atmospheric composition based on data for the year 1860. The data were downloaded from the Program for Climate Model Diagnosis and Intercomparison (PCMDI) archive.
In order to examine the intraseasonal modulation of the El Niño response, we separated the winter into early and late periods. The early winter period was defined as the period from November to December (ND) and the late winter period as January to March (JFM). Then, we compared the remote response to El Niño over the North Atlantic with the NAO pattern, considering the similarity between the two as being recognised in previous studies (Davies et al., Citation1997; Merkel and Latif, Citation2002; Bronnimann, Citation2007). The NAO was defined as the leading empirical orthogonal function (EOF) pattern of the monthly SLP field over the region 20°N–80°N, 90°W–40°E during winter (from November to the following March) (Jia et al., Citation2007). The NAO index was defined as the corresponding principal component time series of the NAO.
El Niño events were selected when the averaged Niño-3.4 index from November to January (NDJ) exceeded one-half standard deviation (0.5 σ) for the observation and one standard deviation (σ) for the model data, respectively. In order to maximise the number of El Niño episodes in the observation, we adopted lower threshold for choosing El Niño events in the observation. However, note that the major argument of this study is not dependent on the threshold. A total of 20 and 65 El Niño events were chosen for the observation and model data, respectively (). We performed a composite analysis in order to examine the El Niño teleconnection and modulation effect by the TNAL SST. Significance for the composite results was given by the two-tailed student t-test.
Table 1. The numbers of composite members used in the analysis
3. Results
Studies have shown that the remote effect of El Niño differs markedly between early and late winter over the North American and North Atlantic regions (Montroy, Citation1997; Montroy et al., Citation1998; Wang and Fu, Citation2000; Moron and Gouirand, Citation2003). In order to revisit such differences, we computed a composite map of 300 hPa geopotential height anomalies (Z300) with respect to early and late winters during an El Niño year (). During the early winter (ND), a cyclonic subpolar circulation was found near Greenland, accompanying an anticyclonic circulation over the southern area. This meridional height contrast closely resembles the positive phase of the NAO. Late winter anomalies also exhibit a meridional dipole structure over the North Atlantic, which has a nearly opposite sign compared to that of early winter (b). This height pattern is rather close to the negative phase of the NAO, although the anomaly centres are shifted westward compared to the canonical NAO pattern.
Fig. 1. Composite of observed Z300 anomaly for entire El Niño events during (a) early winter (ND) and (b) late winter (JFM). Note that (c) and (d) are same as (a) and (b) except for SST anomaly. The contour indicates geopotential height and SST anomalies with 10 m and 0.3°C intervals, from 10 m and 0.15°C, respectively. Light and dark shadings indicate the 90% and 95% confidence levels, respectively.
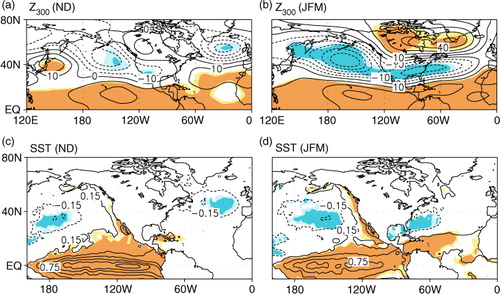
Over the North Pacific region, there is a quasi-stationary Rossby wave pattern that appears to propagate from the tropical Pacific across North America in both the early and late winter composite maps. These height anomalies are roughly close to the Pacific-North American (PNA) pattern (Wallace and Gutzler, Citation1981), which is characterised by an increased anomaly in the vicinity of Hawaii and northwestern North America, and a deepened Aleutian Low. However, from a more detailed perspective, the anomaly patterns differ between early and late winters. The growth of the Aleutian Low during early winter is weaker than that during late winter, as was noticed by Bladé et al. (Citation2008). A positive height anomaly over the northern North America is also much weaker and insignificant in the early winter composite map. It is conspicuous that the anomalies over the North Atlantic are evident, unlike the weak upstream anomaly over the northern North America region. The North Atlantic height anomalies do not seem to be closely connected with the extratropical wave components over the North Pacific.
During late winter, the Aleutian Low deepens, and the overall anomalies over the North Pacific and North America are also intensified. The positive height anomaly over the northern North America distinctly expands eastward, straddling the North America and the North Atlantic. Together with the southern cyclonic anomaly, the height anomalies seem to resemble the Tropical Northern Hemisphere (TNH) pattern (Mo and Livezey, Citation1986). Shabbar and Khandekar (Citation1996) identified the different extratropical responses to El Niño between early and late winter, and they depicted this difference as an evolution from the PNA-like pattern to the TNH pattern. Other studies have also reported a consistent seasonal evolution of the wave response to El Niño over the North Pacific (Wang and Fu, Citation2000; Bladé et al., Citation2008). This seasonal evolution may be associated with the intraseasonally varying El Niño teleconnection over the North Atlantic region to some extent.
In this study, we suggest that another tropospheric process can influence the El Niño teleconnection, namely the oceanic forcing over the North Atlantic region. It is well-known that the NAO is forced by the Atlantic Ocean condition (Robertson et al., Citation2000; Sutton et al., Citation2001; Cassou et al., Citation2004; Pan, Citation2005), although the atmospheric internal variability largely contributes to reinforce and maintain the response to the oceanic forcing (Watanabe and Kimoto, Citation1999; Feldstein, Citation2003; Peng et al., Citation2003). c and d show SST anomalies during early and late El Niño winter, respectively. In comparison to early winter, a warm anomaly was found over the tropical Atlantic region in late winter. This warming tendency in the tropical Atlantic during the late El Niño winter has been widely explored in several previous studies (Covey and Hastenrath, Citation1978; Curtis and Hastenrath, Citation1995; Enfield and Mayer, Citation1997; Giannini et al., Citation2001, etc.; Alexander and Scott, Citation2002). According to these studies, a negative SLP gradient, which is associated with the descending branch of the Walker Circulation during El Niño, weakens the trade winds in the subtropical Atlantic, thereby warming the TNAL.
In addition to the covariability between the two ocean basins during an El Niño year, the tropical Atlantic SST is also important because of its substantial role in the atmospheric circulation over the North Atlantic. Some studies suggested an intimate relationship between the tripole structure of the SSTA over the North Atlantic and the NAO (Peng et al., Citation2003; Pan, Citation2005). Other studies demonstrated that the SSTA over the TNAL fundamentally influences the generation of a NAO-like response (Watanabe and Kimoto, Citation1999; Okumura et al., Citation2001; Czaja and Frankignoul, Citation2002; Terray and Cassou, Citation2002; Cassou et al., Citation2004; Peng et al., Citation2005). Watanabe and Kimoto (Citation1999) obtained a model result showing that the negative NAO was excited when the warming was given over the TNAL region. Cassou et al. (Citation2004) examined the tripole SSTA over the North Atlantic by which component was effective in generating a NAO-like response. Their model experiments indicated that the tropical branch of the SST tripole (0°–30°N) is critical in the occurrence of NAO. A similar result was also observed by Terray and Cassou (Citation2002).
In order to measure the effect of the tropical Atlantic SST, we defined a TNAL SST index as an area average of the SSTA over 0°–25°N, 280°E–360°E. Hereafter, we refer to this average of the SSTA as a TNAL index. Using the TNAL index, we first computed El Niño composite maps separately for various TNAL conditions. a and b show Z300 and SST anomalies during the early winter of El Niño when the TNAL index during ND indicated negative and positive values, respectively. In these joint composite maps, 8 and 12 El Niño episodes were considered, respectively (see ). In a, the height anomaly over the North Atlantic resembles the typical positive NAO pattern when the TNAL SST is experiencing a cold anomaly. Compared to the entire El Niño composite in a, a depicts much stronger anomalies, although the significance decreases, presumably because of the smaller composite members. On the other hand, the atmospheric response under the warm TNAL SSTA during the early El Niño winter is distinctly different than the typical NAO pattern (b). As noted in a, the Rossby wave response to El Niño across the North Pacific and North America does not seem strong enough to affect the downstream circulation over the North Atlantic. This weakness may imply that the local process over the North Atlantic is significant in the formation of the NAO-like response. We suggest that the oceanic forcing over the TNAL region is crucial in driving the local process.
Fig. 2. (a) Joint composite maps of the observational Z300 and SST anomalies over the North Atlantic for El Niño years accompanied by the cold TNAL SST anomaly (TNAL index <0) during early winter. The contour indicates the geopotential height and SST anomalies with 10 m and 0.2°C intervals, respectively. Zero contours were omitted. Red shading denotes positive anomalies, while blue shading denotes negative anomalies, which are significant at a 95% confidence level. Figure (b) is the same as (a), but it represents El Niño years with warm TNAL SST anomalies (TNAL index >0). Figures (c) and (d) are the same as (a) and (b), respectively, for late winter data.
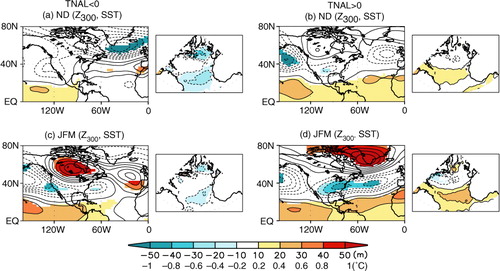
During late winter, the atmospheric response to El Niño also showed a marked difference according to the TNAL SST condition. In c, height anomalies over the North Atlantic are not similar to the NAO. Furthermore, they are only weakly significant. On the other hand, d shows strong height anomalies that resemble the negative phase of the NAO. The atmospheric response during the late El Niño winter under the warm TNAL SST condition is notably stronger than that of the entire El Niño composite shown in b and even more significant at a 95% confidence level. The overall result in suggests that the North Atlantic atmospheric response to El Niño is dependent on the TNAL condition. Specifically, we can infer that the cold TNAL SST condition reinforces the positive NAO-like atmospheric response, while the warm TNAL condition amplifies the negative NAO-like response. This inference is consistent with the previous studies. As emphasised in Cassou et al. (Citation2004) and other studies, the tropical Atlantic SST anomalies are known to critically influence the frequent occurrence of the NAO (Okumura et al., Citation2001; Peng et al., Citation2005; Li et al., Citation2007). In particular, Peng et al. (Citation2005) demonstrated that the tripole SST over the North Atlantic might be a consequence of a tropical heating-induced response and the seasonal modulation of transient eddy feedbacks. The midlatitude cold SSTA in a may reflect such an interaction between the ocean and the atmospheric anomaly, as suggested by Peng et al. (Citation2005).
As noted above, El Niño tends to induce SST warming over the TNAL region through an atmospheric bridge over the tropics during late winter (Covey and Hastenrath, Citation1978; Enfield and Mayer, Citation1997; Giannini et al., Citation2001; Alexander and Scott, Citation2002). In , the cold TNAL SSTA composite during late winter shows a weakened anomaly compared to that of early winter, while the warm TNAL SSTA composite during late winter shows a strengthened anomaly than that of early winter. This TNAL warming tendency during late winter seems conducive to the formation of a negative NAO-like response. The height anomalies in d coincide with this inference.
The modulation effect of the TNAL SST was investigated again using numerical model data. shows the same information as except that the results were produced from the model data. The early winter circulation patterns over the North Pacific and North America show consistent features with the observation data; the relatively weaker Aleutian Low and the positive height anomaly over northern North America compared to those of late winter are common in a and a. However, the height anomalies over the North Atlantic region in a are conspicuously different from the observation data. Contrary to the positive NAO-like response in the observation data, the model output shows nearly the opposite response, which is rather close to the negative NAO, despite the overall similarity in the upstream region between the observation and model data.
Fig. 3. Same as , but for GFDL CM2.1 coupled model output.

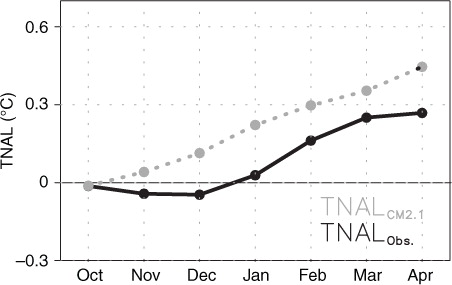
Since the model result is not close to the positive NAO, the intraseasonal phase transition of the NAO-like response does not appear either. The reason for the difference between the observation and model results may be inferred in , which illustrates the temporal evolution of the TNAL index. Compared to the observation results, in which the TNAL warming is profound during late winter after January (black solid line), the TNAL warming in the model begins much earlier (grey dotted line). Note that we adopted the same threshold for the selection of El Niño episodes (Nino-3.4>σ), in order to compare the temporal variation of the TNAL SST under equitable El Niño conditions. The warmer TNAL SST condition in the model during early winter is also shown in c. It is conceived that the warm TNAL SSTA during early winter contributed to the negative NAO-like response in the model result.
Fig. 4. Temporal variation of the TNAL index during El Niño years from observation data (black solid line) and model output (grey dotted line). In order to appropriately compare the observation and model results, El Niño events with Niño-3.4> σ were considered only (11 El Niño episodes in the observation data).
The late winter response in the CM2.1 model results shows similar overall features with the observation data over both the North Pacific and the North Atlantic regions, although the amplitudes of the model anomalies differ: the height anomalies over the North Pacific are greater in the model, while the anomalies over the North Atlantic are weaker in the model than that in the observation data. The stronger atmospheric response to El Niño over the Pacific in the model results is likely related to the higher threshold (one standard deviation) used in the selection of El Niño episodes for the model analysis. On the other hand, the weaker anomalies over the North Atlantic seem inconsistent with the stronger anomalies over the North Pacific. This inconsistency may be related to the inaccuracy in transient eddy feedback or the stratospheric process, both of which are known to be important for the NAO (Feldstein, Citation2003; Scaife et al., Citation2005). We discuss these processes more in the next section.
In order to further examine the modulation effect of the TNAL SST, joint composite maps were computed using the model data as in observation (). Because the warming tendency began early in the TNAL SST in the model, the SSTA is quite weak over the TNAL region in the cold TNAL composite of early winter (a). Possibly due to the weak SSTA, the atmospheric response is not similar to the NAO. However, the height anomaly under the warm TNAL SST condition during early winter is similar to that of the entire composite and rather close to the negative phase of the NAO. During late winter, the atmospheric response to El Niño under the different TNAL condition also differs prominently. Although the cold TNAL SST accompanied only five of the 65 El Niño episodes (see ), c clearly shows a positive NAO-like feature. On the other hand, the height anomalies in the warm TNAL-El Niño joint composite map are close to a negative NAO (d). This result is consistent to that shown in the observation, i.e., the remote response to El Niño over the North Atlantic is strongly dependent on the TNAL SST condition.
Fig. 5. Same as , but for GFDL CM2.1 coupled model output.

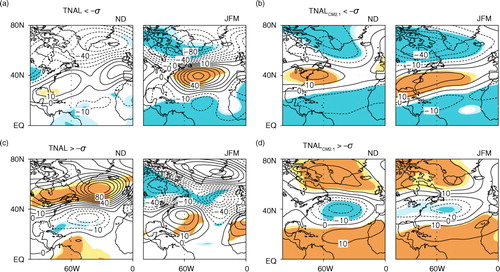
In order to isolate the role of the TNAL, we computed another joint composite map in which the El Niño or La Niña episodes were excluded and the only influence of the TNAL was considered. a shows the Z300 anomaly when the TNAL index is below one standard deviation during no ENSO year in the observation. Because of small composite members (four cases of ND and three cases of JFM), the anomalous features are weakly significant. However, the cold TNAL composite shows an overall positive NAO-like response in both the early and late winter composites. This positive NAO-like response is more evident in the model analysis, as shown in b. On the contrary, the warm TNAL composite shows a distinctive negative NAO-like response in the model data (d), though the observational results seem noisy compared to the model results. It is notable that the impact of the TNAL SST on the North Atlantic atmosphere is not critically dependent on the intraseasonal variation of the background condition. The overall results in support our argument regarding the possible modulation effect of the TNAL SST in the El Niño teleconnection.
Fig. 6. Joint composite maps for Z300 anomalies using (a) observation and (b) GFDL 2.1 coupled model output during early and late winters that were accompanied by a cold TNAL SST (TNAL index<−σ) and by no ENSO (−0.5 σ< NDJ Niño-3.4 index <0.5 σ). Contours represent anomalies with 10 m interval. Light and dark shadings indicate the 90% and 95% confidence levels, respectively. The maps in (c) and (d) are the same as (a) and (b), respectively, but for a warm TNAL condition (TNAL index >σ).
Thus far, we have examined the composite features of the height anomalies for El Niño and TNAL events. shows the behaviors of observed individual El Niño events in the atmospheric circulation over the North Atlantic region according to each TNAL SST condition during early and late winter. The vertical axis denotes the normalised NAO index averaged for early and late El Niño winters, while the horizontal axis indicates the normalised TNAL index. The blue dots represent the cold TNAL SST condition, while the red dots indicate the warm TNAL SSTA. In a, the blue dots are mostly concentrated over the positive NAO domain, implying the positive NAO-like response under the cold TNAL SSTA. The red dots also show a tendency for the negative NAO-like response, although some exceptions exist. We denoted strong El Niño events (Nino-3.4>σ) by the closed dots, which are distributed linearly overall in , implying that the NAO phase is dependent on the TNAL SST condition, not on the El Niño intensity.
Fig. 7. (a) Scatter plot of the TNAL index against the corresponding NAO index for early winter of each El Niño year in the observation. The TNAL and NAO indices were both normalised. (b) Same as (a) but for late winter. Closed circles indicate stronger El Niño years when the Nino-3.4 exceeds σ.
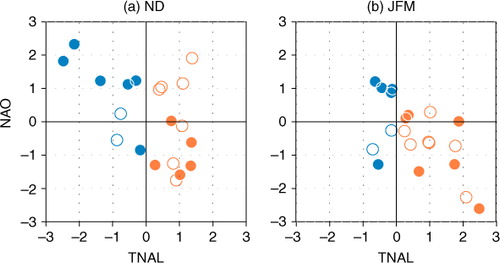
During the late El Niño winter, the overall distribution of the dots shifted toward right due to the warming tendency in the TNAL SST (b). Yet, the blue and red dots maintained an overall similar distribution pattern, verifying the dependence of the atmospheric response on the TNAL index. Here, we need to pay attention to larger increases of TNAL index between a and b, especially for strong El Niño events. This means that strong El Niño may accompany more warming over the TNAL region. Although the El Niño intensity itself does not critically affect the NAO phase as noted above, strong El Niño may have more possibility of stronger intraseasonal variation over the North Atlantic due to stronger variation in TNAL condition.
The aforementioned linear relationship between the North Atlantic atmospheric circulation and the TNAL condition during El Niño years may reflect a possible feedback process, whereby the NAO enhances the SST variability in the TNAL (Czaja et al., Citation2002; Wu and Liu, Citation2002) and the oceanic forcing reinforces the atmospheric response (Watanabe and Kimoto, Citation1999; Okumura et al., Citation2001; Terray and Cassou, Citation2002; Cassou et al., Citation2004; Peng et al., Citation2005). This ocean–atmospheric feedback is supposed to enhance the linear relationship in .
Considering the distinct atmospheric responses to El Niño under different TNAL conditions, we examined surface temperature variations during El Niño years in . During the early El Niño winter under the negative TNAL SST condition (a), the temperature over the northeastern part of North America and northern Africa exhibits a cold anomaly. The cold anomaly over the northeastern North America coincides with the positive NAO-like response, which is shown in a, that brings northerly advection over the east of cyclonic subpolar circulation. By contrast, the temperature anomaly under the warm TNAL SST (b) is warm overall over the northern North American region and not as strong as the anomalies of a. This difference is also consistent with the height anomaly that does not show any noticeable characteristic, as shown in b. The contrasting temperature anomalies between a and b are likely due to the different TNAL conditions.
Fig. 8. (a) Joint composite maps of the observational surface temperature anomalies for the El Niño years accompanied by the cold TNAL SST anomaly during early (top) and late (bottom) winters. Contours represent anomalies with 1°C intervals from 0.5°C. Light and dark shadings indicate the 90% and 95% confidence levels, respectively. (b) Same as (a) but for El Niño years with a warm TNAL SST anomaly.

The late winter temperature anomalies also show a clear contrast according to the TNAL condition. For the case of the cold TNAL anomaly during late winter, the warm anomaly is centred over the northern North American region. This temperature anomaly seems to correspond to the strong anticyclonic anomaly over the northern North American region that brings warm advection over the western coast of that region. On the other hand, late winter temperature anomaly in d tends to approach that of a negative NAO and is almost opposite a. Warm anomalies appear over the northeastern North America and northern Africa regions. The distinct difference in temperature field according to the TNAL condition during late winter also coincides with the characteristic distribution of the height anomalies shown in . Previous studies have shown that the ENSO remote impact is highly non-linear over North America and the North Atlantic compared to the climate impact over the North Pacific (Montroy et al., Citation1998; Wu and Hsieh, Citation2004; Toniazzo and Scaife, Citation2006). Our results suggest one reason for this non-linearity.
4. Concluding remarks
4.1. Discussion
In order to understand the intraseasonal modulation of El Niño's impact, recent studies have focused onto the stratospheric process (Bronnimann, Citation2007; Garfinkel and Hartmann, Citation2008; Bell et al., Citation2009; Ineson and Scaife, Citation2009). According to these studies, El Niño tends to accompany a weakened stratospheric polar vortex (i.e. polar stratospheric warming due to thermal wind balance). The stratospheric disturbance that is initiated in the upper stratosphere propagates downward through wave–mean interaction with a monthly timescale (Newman and Nash, Citation2000; Zhou et al., Citation2002; Polvani and Waugh, Citation2004). The descending stratospheric anomaly is often followed by a negative NAO in the troposphere through the aid of tropospheric internal processes (Baldwin and Dunkerton, Citation1999; Kunz et al., Citation2009). Because of the time delay taking in the troposphere–stratosphere linkage, a negative NAO-like response dominates in the late winter of El Niño years.
a describes this relationship between the stratospheric warming and the NAO well. The upper and middle panels in a show a vertical profile of the zonal mean temperature and a horizontal Z300 anomaly pattern during the El Niño years that accompanied the stratospheric warming. We used a 50 hPa polar cap temperature averaged over 70–90°N during JFM as an indicator of the stratospheric warming. If this polar cap temperature anomaly exceeded 0.5 σ, we considered the year that the stratospheric warming event occurred. As a shows, El Niño years that accompany the stratospheric warming (top figure) also exhibit distinct negative NAO-like responses during late winter (middle figure).
Fig. 9. (a) Joint composite maps of the observational vertical temperature anomaly profile (top), Z300 anomaly (middle) and SST anomaly (bottom) for the El Niño years accompanied by stratospheric warming. For the vertical temperature profile, scaling for the shading is given in the right of figure (°C). The black solid line indicates a significant area at a 90% confidence level. For the Z300 and SST anomalies, contour intervals are 10 m and 0.15°C, respectively, and zero contours were omitted. Light and dark shadings indicate the 90% and 95% confidence levels, respectively. (b) Same as (a) but for the El Niño years without the stratospheric warming. (c) Z300 (upper) and SST (bottom) anomalies for the El Niño years accompanied by the TNAL SST warming (TNAL index >0.5 σ) among the years without the stratospheric warming. (d) Same as (c) but for El Niño years not accompanied by the TNAL SST warming (TNAL index <0.5 σ).

In the composite maps for El Niño years that did not accompany stratospheric warming, however, we can also find a similar response in the Z300 anomalies over the North Atlantic region, though the anomalies are weakly significant (b). In order to understand this response better, we divided the El Niño events without the stratospheric warming into two groups, according to the TNAL conditions (c and d). Interestingly, when the TNAL SST is warm (>0.5 σ), as shown in c, the atmospheric response to El Niño over the North Atlantic is conspicuously negative NAO-like and surely significant. By contrast, for the other case in d under the neutral or cold TNAL SST condition (<0.5 σ), the circulation anomaly over the North Atlantic departs far from the typical negative NAO pattern. This deviation implies that the TNAL SST condition and its covariability with the El Niño are crucial for understanding the El Niño teleconnection.
Though the CM2.1 simulates the El Niño teleconnection relatively well, as shown in this study, the intensity of height anomalies over the North Atlantic in CM2.1 tends to be weaker than those found in the observation data, as noted in previous section. The weaker intensity of anomalies might be partly due to the difference in the stratospheric process that was not simulated well in the model (figures not shown). Otherwise, it may be related to the weaker storm activity in the model (Rayner et al., Citation2003). Watanabe and Kimoto (Citation1999) emphasised the substantial role of the transient eddy in driving the atmospheric response to the tropical Atlantic SST. This role was supported by other studies on the transient eddy feedback, which modulates the forced response by the tropical Atlantic heating and ultimately contributes to the growth of a NAO-like response (Terray and Cassou, Citation2002; Peng et al., Citation2005). Although we did not illustrate the physical process by which the TNAL SST forcing affects the atmospheric circulation over the North Atlantic in this study, it is also likely to be closely linked with the eddy process. Accordingly, the weaker height anomalies over the North Atlantic found in the CM2.1 model output may be a consequence of unrealistic local eddy feedback.
Watanabe and Kimoto (Citation1999) further noticed that the atmospheric teleconnection from the tropical Pacific across North America is crucial for the NAO response because it helps organize the eddy flux. Although we presented contradictory evidence that the Rossby wave train across North America does not likely force the downstream circulation through a direct wave energy transfer during early winter, it seems still possible for the North Pacific eddy to affect downstream North Atlantic circulation. Recently, Li and Lau (Citation2012a, Citation2012b) found that the North Pacific storm track is significantly altered during El Niño years. They determined that this storm track is conducive to the formation of a NAO-like flow over the North Atlantic region because of enhanced cyclone activity along the downstream of the Pacific storm track. This argument was supported by the ‘seeding’ effect suggested by Hakim (Citation2003), which proposed that Pacific wave packets can excite the growth of an Atlantic cyclone.
In , we noticed that the exratropical wave response to El Niño over the North Pacific differed between early and late winter. This seasonal evolution over the North Pacific should include the variations in the Pacific subtropical jet stream and the storm track. The altered storm track over the North Pacific can exert different influences farther downstream and contribute to the formation of different NAO-like responses between early and late winter. The reason for the different atmospheric responses shown in a and c under the similar distribution of SST anomalies can be also related to the seasonal evolution over the North Pacific. Furthermore, the intraseasonal variation in the NAO-like response during El Niño winters can be regarded as a synthetic result of the seasonal evolution of the Pacific regional circulation and the late winter warming tendency of the TNAL SST.
Although we did not address La Niña in this study, similar modulation effect of TNAL SST on the La Niña teleconnection was found. The remote responses to La Niña were more positive NAO-like under cold TNAL SST condition and more close to negative NAO under warm TNAL condition. However, such tendency was weaker than that of El Niño, possibly due to asymmetry between El Niño and La Niña (Hannachi, Citation2001; An and Jin, Citation2004).
4.2. Summary and conclusion
This study examined the atmospheric response to El Niño over the North Atlantic region. The remote response of the North Atlantic atmospheric circulation to El Niño showed a distinct intraseasonal variation during winter, namely a positive NAO-like response during early winter and a negative NAO-like response during late winter. By analysing the role of the TNAL SST, we suggested an alterative effect of the TNAL SST that modulates the intraseasonal change in the El Niño teleconnection. From the observation and model data, we found that the TNAL exerted a substantial role in determining the atmospheric response to El Niño over the North Atlantic region. In general, the warm TNAL condition intensified the negative NAO-like response and vice versa.
Previous studies have shown that the TNAL SST tends to be warm during the late winter of El Niño events (Covey and Hastenrath, Citation1978; Curtis and Hastenrath, Citation1995; Enfield and Mayer, Citation1997; Giannini et al., Citation2001, etc.; Alexander and Scott, Citation2002). The warming tendency of the TNAL SST during late winter provides an important implication on the impact of El Niño which becomes dominant during late winter (Fraedrich, Citation1994; Davies et al., Citation1997; Merkel and Latif, Citation2002; Gouirand and Moron, Citation2003; Bronnimann et al., Citation2007). Because a warm TNAL condition is conducive to a negative NAO-like response, late winter warming of the TNAL SST intensifies the negative NAO-like response. Conversely, the nearly independent relationship between El Niño and the TNAL SST during early winter indicates the random probability of the TNAL condition, which increases the uncertainty of the response. Therefore, a relatively weak climatic impact can be exerted during the early El Niño winter. However, this relationship does not mean that the climatic impact of El Niño is really weak during early winter, but it means that careful monitoring of the TNAL variability is needed for an exact understanding of the El Niño remote impact.
5. Acknowledgements
This work was supported by the Polar Academic Program (PAP) at the Korea Polar Research Institute (KOPRI). JSK was supported by KIOST (PE98991, PE99162).
Related Research Data
References
- Alexander M. Scott J. The influence of ENSO on air–sea interaction in the Atlantic. Geo. Res. Lett. 2002; 29: 46–41.
- An S. I. Jin F. F. Nonlinearity and asymmetry of ENSO. J. Clim. 2004; 17: 2399–2412.
- Baldwin M. P. Dunkerton T. J. Propagation of the Arctic Oscillation from the stratosphere to the troposphere. J. Geophys. Res. 1999; 104: 30937–30946. 10.3402/tellusa.v65i0.19863.
- Bell C. J. Gray L. J. Charlton-Perez A. J. Joshi M. M. Scaife A. A. Stratospheric communication of El Nino teleconnections to European winter. J. Clim. 2009; 22: 4083–4096. 10.3402/tellusa.v65i0.19863.
- Bladé I. Newman M. Alexander M. A. Scott J. D. The late fall extratropical response to ENSO: sensitivity to coupling and convection in the tropical West Pacific. J. Clim. 2008; 21: 6101–6118. 10.3402/tellusa.v65i0.19863.
- Bronnimann S. Impact of El Nino-Sourthern Oscillation on European climate. Rev. Geophys. R. 2007; 45: G3003.
- Bronnimann S. Xoplaki E. Casty C. Pauling A. Luterbacher J. ENSO influence on Europe during the last centuries. Clim. Dyn. 2007; 28: 181–197. 10.3402/tellusa.v65i0.19863.
- Cagnazzo C. Manzini E. Impact of the stratosphere on the winter tropospheric teleconnections between ENSO and the North Atlantic and European region. J. Clim. 2009; 22: 1223–1238. 10.3402/tellusa.v65i0.19863.
- Cassou C. Terray L. Hurrell J. W. Deser C. North Atlantic winter climate regimes: spatial asymmetry, stationarity with time, and oceanic forcing. J. Clim. 2004; 17: 1055–1068.
- Covey D. L. Hastenrath S. The Pacific El Niño phenomenon and the Atlantic circulation. Mon. Wea. Rev. 1978; 106: 1280–1287.
- Curtis S. Hastenrath S. Forcing of anomalous sea surface temperature evolution in the tropical Atlantic during Pacific warm events. J. Geophys. Res. 1995; 100: 15835–15847. 10.3402/tellusa.v65i0.19863.
- Czaja A. Frankignoul C. Observed impact of Atlantic SST anomalies on the North Atlantic oscillation. J. Clim. 2002; 15: 606–623.
- Czaja A. Vaart P. V. Marshall J. A diagnostic study of the role of remote forcing in tropical Atlantic variability. J. Clim. 2002; 15: 3280–3290.
- Davies J. R. Rowell D. P. Folland C. K. North Atlantic and European seasonal predictability using an ensemble of multidecadal atmospheric GCM simulations. Int. J. Clim. 1997; 17: 1263–1284.
- Delworth, T. L, Broccoli, A. J, Rosati, A, Stouffer, R. J, Balaji, V. and co-authors. 2006. GFDL's CM2 global coupled climate models. Part I: formation and simulation characteristics. J. Clim. 19, 634–674.
- Diaz H. F. Hoerling M. P. Eischeid J. K. ENSO variability, teleconnections and climate change. Int. J. Clim. 2001; 21: 1845–1862. 10.3402/tellusa.v65i0.19863.
- Enfield D. B. Mayer D. A. Tropical Atlantic sea surface temperature variability and its relation to El Niño-Southern Oscillation. J. Geophys. Res. 1997; 102: 929–945. 10.3402/tellusa.v65i0.19863.
- Feldstein S. B. The dynamics of NAO teleconnection pattern growth and decay. Q. J. Roy. Meteor. Soc. 2003; 129: 901–924. 10.3402/tellusa.v65i0.19863.
- Fraedrich K. European grosswetter during the warm and cold extremes of the El Nino/Southern Oscillation. Int. J. Clim. 1990; 10: 21–31. 10.3402/tellusa.v65i0.19863.
- Fraedrich K. An ENSO impact on Europe? A review. Tellus. A. 1994; 46: 541–552. 10.3402/tellusa.v65i0.19863.
- Garfinkel, C. I and Hartmann, D. L. 2008. Different ENSO teleconnections and their effects on the stratospheric polar vortex. J. Geophys. Res. 113. DOI: 10.3402/tellusa.v65i0.19863.
- Giannini A. Chiang J. C. H. Cane M. A. Kushnir Y. Seager R. The ENSO teleconnection to the Tropical Atlantic Ocean: contributions of the remote and local SSTs to rainfall variability in the Tropical Americas. J. Clim. 2001; 14: 4530–4544.
- Gouirand I. Moron V. Variability of the impact of El Nino southern oscillation on sea-level pressure anomalies over the North Atlantic in January to March (1874–1996). Int. J. Clim. 2003; 23: 1549–1566. 10.3402/tellusa.v65i0.19863.
- Hakim G. Developing wave packets in the North Pacific storm track. Mon. Wea. Rev. 2003; 131: 2824–2837.
- Halpert M. S. Ropelewski C. F. Surface temperature patterns associated with the Southern Oscillation. J. Clim. 1992; 5: 577–593.
- Hannachi A. Toward a nonlinear identification of the atmospheric response to ENSO. J. Clim. 2001; 14: 2138–2149.
- Hoerling M. P. Kumar A. Xu T. Robustness of the nonlinear climate response to ENSO's extreme phases. J. Clim. 2001; 14: 1277–1293.
- Ineson S. Scaife A. A. The role of the stratosphere in the European climate response to El Nino. Nat. Geosci. 2009; 2: 32–36. 10.3402/tellusa.v65i0.19863.
- Jia X. Derome J. Lin H. Comparison of the life cycles of the NAO using different definitions. J. Clim. 2007; 20: 5992–6011. 10.3402/tellusa.v65i0.19863.
- Kalnay, E, Kanamitsu, M, Kistler, R, Collins, W, Deaven, D. and co-authors. 1996. The NCEP/NCAR reanalysis project. Bull. Am. Meteorol. Soc. 77, 437–471.
- Kang I. S. An S. I. Kelvin and Rossby wave contributions to the SST oscillation of ENSO. J. Clim. 1998; 11: 2461–2469.
- Kug, J. S, Ahn, M. S, Sung, M.-K, Yeh, S. W, Min, H. S. and co-authors. 2010. Statistical relationship between two types of El Nino events and climate variation over the Korean Peninsula. Asia. Pac. J. Atmos. Sci. 46, 467–474. 10.3402/tellusa.v65i0.19863.
- Kunz, T, Fraedrich, K and Lunkeit, F. 2009. Impact of synoptic-scale wave breaking on the NAO and its connection with the stratosphere in ERA-40. J. Clim. 22, 1–19. DOI: 10.3402/tellusa.v65i0.19863.
- Li S. Robinson W. A. Hoerling M. Weickmann K. M. Dynamics of the extratropical response to a tropical Atlantic SST anomaly. J. Clim. 2007; 20: 560–574. 10.3402/tellusa.v65i0.19863.
- Li Y. Lau N. C. Contributions of downstream Eddy development to the teleconnection between ENSO and the atmospheric circulation over the North Atlantic. J. Clim. 2012a; 25: 4993–5010. 10.3402/tellusa.v65i0.19863.
- Li, Y and Lau, N. C. 2012b. Impact of ENSO on the atmospheric variability over the North Atlantic in late winter—role of transient eddies. J. Clim. 25, 320–342. 10.3402/tellusa.v65i0.19863.
- Mathieu P. P. Sutton R. T. Dong B. Collins M. Predictability of winter climate over the North Atlantic European region during ENSO events. J. Clim. 2004; 17: 1953–1974.
- Merkel, U and Latif, M. 2002. A high resolution AGCM study of the El Nino impact on the North Atlantic/European sector. Geo. Res. Lett. 29. DOI: 10.3402/tellusa.v65i0.19863.
- Mo K. C. Livezey R. E. Tropical–extratropical geopotential height teleconnections during the Northern Hemisphere winter. Mon. Wea. Rev. 1986; 114: 2488–2515.
- Montroy D. L. Linear relation of central and eastern North American precipitation to tropical Pacific sea surface temperature anomalies. J. Clim. 1997; 10: 541–558.
- Montroy D. L. Richman M. B. Lamb P. J. Observed nonlinearities of monthly teleconnections between tropical Pacific sea surface temperature anomalies and central and eastern North American precipitation. J. Clim. 1998; 11: 1812–1835.
- Moron V. Gouirand I. Seasonal modulation of the El Nino-southern oscillation relationship with sea level pressure anomalies over the North Atlantic in October–March 1873–1996. Int. J. Clim. 2003; 23: 143–155. 10.3402/tellusa.v65i0.19863.
- Moron V. Plaut G. The impact of El Nino–southern oscillation upon weather regimes over Europe and the North Atlantic during boreal winter. Int. J. Clim. 2003; 23: 363–379. 10.3402/tellusa.v65i0.19863.
- Newman P. A. Nash E. R. Quantifying the wave driving of the stratosphere. J. Geophys. Res. 2000; 105: 12485–12497. 10.3402/tellusa.v65i0.19863.
- Okumura Y. Xie S. P. Numaguti A. Tanimoto Y. Tropical Atlantic air–sea interaction and its influence on the NAO. Geo. Res. Lett. 2001; 28: 1507–1510. 10.3402/tellusa.v65i0.19863.
- Pan L. Observed positive feedback between the NAO and the North Atlantic SSTA tripole. Geophys. Res. Lett. 2005; 32: L06707.10.3402/tellusa.v65i0.19863.
- Peng S. Robinson W. A. Li S. Mechanisms for the NAO responses to the North Atlantic SST tripole. J. Clim. 2003; 16: 1987–2004.
- Peng S. Robinson W. A. Li S. Hoerling M. P. Tropical Atlantic SST forcing of coupled North Atlantic seasonal responses. J. Clim. 2005; 18: 480–496. 10.3402/tellusa.v65i0.19863.
- Polvani L. M. Waugh D. W. Upward wave activity flux as a precursor to extreme stratospheric events and subsequent anomalous surface weather regimes. J. Clim. 2004; 17: 3548–3554.
- Pozo-Vazquez D. Esteban-Parra M. J. Rodrigo F. S. Zastro-Diez Y. The association between ENSO and winter atmospheric circulation and temperature in the North Atlantic Region. J. Clim. 2001; 14: 3408–3420.
- Rayner, N. A, Parker, D. E, Horton, E. B, Folland, C. K, Alexander, L. V. and co-authors. 2003. Global analyses of sea surface temperature, sea ice, and night marine air temperature since the late nineteenth century. J. Geophys. Res. 108. DOI: 10.3402/tellusa.v65i0.19863.
- Robertson A. W. Mechoso C. R. Kim Y.-J. The influence of Atlantic Sea surface temperature anomalies on the North Atlantic Oscillation. J. Clim. 2000; 13: 122–138.
- Sassi F. Kinnison D. Boville B. Garcia R. Roble R. Effect of El Nino-Southern Oscillation on the dynamical, thermal, and chemical structure of the middle atmosphere. J. Geophys. Res. 2004; 109: D17108.10.3402/tellusa.v65i0.19863.
- Scaife A. A. Knight J. R. Vallis G. K. Folland C. K. A stratospheric influence on the winter NAO and North Atlantic surface climate. Geo. Res. Lett. 2005; 32: L18715.10.3402/tellusa.v65i0.19863.
- Shabbar A. Khandekar M. The impact of el Nino-Southern Oscillation on the temperature field over Canada: research note. Atmos. Ocean. 1996; 34: 401–416. 10.3402/tellusa.v65i0.19863.
- Sutton, R. T, Norton, W. A and Jewson, S. P. 2001. The North Atlantic Oscillation—what role for the ocean?. Atmos. Sci. Lett. 1, 89–100. 10.3402/tellusa.v65i0.19863.
- Terray L. Cassou C. Tropical Atlantic sea surface temperature forcing of quasi-decadal climate variability over the North Atlantic–European region. J. Clim. 2002; 15: 3170–3187.
- Toniazzo, T and Scaife, A. A. 2006. The influence of ENSO on winter North Atlantic climate. Geo. Res. Lett. 33. DOI: 10.3402/tellusa.v65i0.19863.
- Van Loon H. Madden R. A. The Southern Oscillation. Part I: global associations with pressure and temperature in northern winter. Mon. Wea. Rev. 1981; 109: 1150–1162.
- Wallace J. M. Gutzler D. S. Teleconnections in the geopotential height field during the Northern Hemisphere Winter. Mon. Wea. Rev. 1981; 109: 784–812.
- Wang B. Wu R. Fu X. Pacific-East Asian teleconnection: how does ENSO affect East Asian climate?. J. Clim. 2000; 13: 1517–1536.
- Wang H. Fu R. Winter monthly mean atmospheric anomalies over the North Pacific and North America associated with El Nino SSTs. J. Clim. 2000; 13: 3435–3447.
- Watanabe M. Kimoto M. Tropical extratropical connection in the Atlantic atmosphere ocean variability. Geophys. Res. Lett. 1999; 26: 2247–2250. 10.3402/tellusa.v65i0.19863.
- Wittenberg A. T. Rosati A. Lau N. C. Ploshay J. J. GFDL's CM2 global coupled climate models. Part III: tropical Pacific climate and ENSO. J. Clim. 2006; 19: 698–722. 10.3402/tellusa.v65i0.19863.
- Wu, A and Hsieh, W. W. 2004. The nonlinear Northern Hemisphere winter atmospheric response to ENSO. Geo. Res. Lett. 31. DOI: 10.3402/tellusa.v65i0.19863.
- Wu, L and Liu, Z. 2002. Is Tropical Atlantic Variability driven by the North Atlantic Oscillation?. Geo. Res. Lett. 29. DOI: 10.3402/tellusa.v65i0.19863.
- Zhou S. Miller A. J. Wang J. Angell J. K. Downward-propagating temperature anomalies in the preconditioned polar stratosphere. J. Clim. 2002; 15: 781–792.