ABSTRACT
Nocturnal precipitation cells and lines occur near the coastline in the whole Mediterranean basin in all seasons. The precipitation events are mainly located in areas where coastal mountain ranges and rivers enhance convergence though the interaction of nocturnal mesoscale and local flows (land breeze, katabatic and drainages winds) with prevailing synoptic wind or with other mesoscale and local flows. The methodology used here to study this phenomenon consists of three stages. First, the Tropical Rainfall Measuring Mission (TRMM) radar satellite database is used to detect nocturnal precipitation near the coastline, from 18 to 09 UTC. An event is included in the study if the 3 hours accumulated precipitation detected by TRMM is stationary near the coast, or has moved slightly onshore or offshore, and has lasted no more than six consecutive hours. Second, the NCEP reanalysis database is used to describe the synoptic conditions and to discard precipitation associated with synoptic events (large low pressure areas, dynamic polar fronts, or troughs, for example). In the final step by using the version 3 of the Weather Research Forecast model, we simulate and analyse some of the selected events to determine the role of the land–sea temperature differences, the curvature of the coastline and the sea surface temperature.
The simulations confirm that the nocturnal precipitation studied in the Mediterranean basin near the coastline is formed from the interaction between relatively warm and wet sea-air with the cold air mass from drainage winds, as well as from the convergence of several drainage winds offshore. The mechanism is the same that is used to explain nocturnal precipitation in tropical areas.
1. Introduction
Offshore convective cells, which sometimes form cloud bands along the coastline, are commonly observed phenomena during the night and early morning in many areas of the tropics, and they have been studied by several authors (Houze et al., Citation1981; Ohsawa et al., Citation2001; Mori et al., Citation2004; Yu and Jou, Citation2004).
After sunset the cooled inland air moves to the coastline. The warm and wet sea-air forcibly lifted by the cold, drained air as it moves offshore. There are several factors that influence in this phenomenon, such as the intensity of horizontal winds, the depth of the cold air mass or the atmospheric stability; and these factors may cause the warm and wet lifted air to reach the lifting condensation level (LCL) and form clouds. If it reaches the level of free convection (LFC), convective clouds are formed and may produce precipitation.
Miglietta and Rotunno (Citation2010) conducted academic numerical studies of the triggering mechanisms that enhance nocturnal convection and they concluded that moderate precipitation occurs if the top of this cold air (h) is located above the LCL, which is close or above the LFC. In contrast, stratiform clouds with weak or no precipitation are formed if LFC>h>LCL, or there are clear skies if h<LCL. Additionally, a non-dimensional parameter is used to determine whether the precipitation is stationary: NLFC/U, where N is the Brunt-V äis äl ä frequency, and U is the horizontal relative velocity between the synoptic and the cold drainage air masses (Wang et al., Citation2000; Reeves and Rotunno, Citation2008; Miglietta and Rotunno, Citation2010). Miglietta and Rotunno (Citation2010) found that values of NLFC/U around 2.5 correspond to situations in which the density current (drainage wind) and the environmental flow approximately counterbalance each other, and consequently precipitation occurs at approximately the same location. In addition, Wang et al. (Citation2000) predicted from modelling studies that cloud bands would form at the flow separation line if the ratio B=U/N is greater than the height of the LFC.
Three physical factors may have a great influence on the nocturnal offshore convection: the land–sea temperature difference, the curvature of the coastline that favours convergence at low levels and sea surface temperature (SST). One of the aims of this paper is to analyse the role of these factors in nocturnal convection in the Mediterranean basin.
Several authors (Meyer, Citation1971; Schoenberg, Citation1984; Heiblum et al., Citation2011) concluded that the intensity and the position of the precipitation at the coastline are determined by the magnitude of the synoptic winds and the land–sea temperature. High synoptic wind speed shifts precipitation onshore, while a high land–sea temperature difference moves the convective area offshore. By using the MM5 mesoscale model, Malda et al. (Citation2007) analysed some of the mechanisms that enhance the formation of coastal fronts in The Netherlands, and they found that changes in roughness length and differences in land–sea temperatures produce the convergence of the Atlantic flow at the coastline. Malda et al. (Citation2007) performed several numerical experiments to analyse the nocturnal front formed on the night of 13 August 2004 at the coastline of The Netherlands. An increase in SST shifted the precipitation areas offshore. Consequently, differences between inland temperatures and SST play an important role in locating the precipitation associated with the coastal front. Mapes et al. (Citation2003) described the mechanism of nocturnal convection off the Pacific coastline in Central America. By using MM5 simulations, they determined that highly cool inland air favours large drainage winds offshore which in turn play an important role in the intensity of convection and the position of the line of precipitation.
Sea surface temperature also influences nocturnal rainfall. According to Simpson and Britter (Citation1980), the depth of the cold air mass is directly proportional to the virtual potential temperature of the warm air mass. Therefore, a higher SST value releases more heat and moisture, and can increase the depth of cold air, thereby enhancing the upward movement of moisture and heat. In their MM5 numerical experiment, Malda et al. (Citation2007) detected that increasing the SST enhances rainfall rates over the sea.
Finally, the shape of the coastline also plays an important role in enhancing convergence at low levels. A concave coastline favours the offshore convergence of nocturnal flows. High offshore rainfall rates during the night hours have been analysed in concave coastal areas worldwide (Newmann, Citation1951; Houze et al., Citation1981; Ohsawa et al., Citation2001; Yang and Slingo, Citation2001; Zuidema, Citation2003).
1.1. Reflectivity radar images to detect nocturnal offshore precipitation
Reflectivity radar images have been used to detect and analyse the nocturnal offshore precipitation near the coastline in many areas, mainly tropical regions. Several authors have reported frontal areas of nocturnal cumulus clouds that produce precipitation near the coastline and that propagate offshore in the cases where the land breeze opposes the synoptic wind. For instance, at Wallops Island (Virginia, USA), Meyer (Citation1971) detected a nocturnal coastal front at 25–28 km off the coast moving seaward at approximately 4 km h−1, with a thickness of 600 m near the frontal zone. After sunrise, the coastal front recedes toward land and dissipates. Yu and Jou (Citation2004), by using radar reflectivity, studied the formation of thunderstorms off the southeast coast of Taiwan, and they found velocities of a few km h−1 in the cold front drainage. Houze et al. (Citation1981) used radar images to study the effect of the wind cycle and the associated rainfall in Borneo. The land breeze starts at about midnight in this area, enhancing convection and rainfall offshore. Mori et al. (Citation2004) described the formation of convective systems generated by offshore winds off the coast of Sumatra that, during the night, move away from the coast at speeds of around 10 km h−1. Schoenberg (Citation1984) demonstrated a nocturnal line of cumulus near the coastline propagating offshore at speeds that depend on the land–sea thermal difference.
However, radar reflectivity covers no more than a few 100 km. In addition, some areas like the ones presented here are not totally covered by radar measurements. In many areas along the North African coastline and along the central and eastern European coastline, there is no meteorological radar at all. For this reason, and in order to study the whole Mediterranean basin, we use the radar instrument on-board the Tropical Rainfall Measuring Mission (TRMM) satellite (http://trmm.gsfc.nasa.gov/), as described in section 2.
1.2. Nocturnal offshore convection in the Mediterranean basin
The Mediterranean is a closed basin surrounded by high mountain ranges that contribute to the prevention sea air ventilation. This low ventilation favours large SST values during all seasons, but especially during summer and autumn. In this basin, cold air masses moved offshore by inland winds flowing thought the mouths of some rivers and streams, and downslope from the mountain ranges surrounding the basin bringing cold air masses offshore.
The interaction between the cold and warm air masses enhances the emergence of nocturnal convection. Newmann (Citation1951) proposed the convergence between synoptic gradient winds and the land breeze as an explanation for offshore convection at the southern coast of Israel. Furthermore, in this area, the concave shape of the coastline plays an important role in enhancing convergence at low levels (Heiblum et al., Citation2011). These authors supported the idea that the convergence of the land breeze and synoptic winds near the coastline has a significant effect on precipitation in the East Mediterranean. Goldreich et al. (Citation2004) describe local nocturnal precipitation from November to September in South Israel produced by a coastal front near the coastline. This front is created by the land breeze interacting with a synoptic flow and it makes a significant contribution to the total amount of rainfall in this area during the dry years.
In the northeast of the Iberian Peninsula, Callado and Pascual (Citation2002) detected nocturnal convection in the mouths of three rivers. Mazón et al. (Citation2009) studied the increase of nocturnal precipitation at the mouth of the Llobregat delta (close to Barcelona city), which is caused by the interaction between the relatively cold drainage winds and the warm and wet Mediterranean air mass, especially during late summer and early autumn.
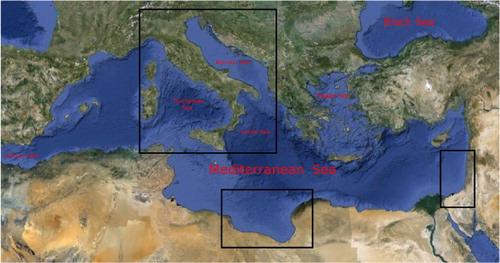
This paper also aims to evaluate whether the mechanism of the nocturnal convection over the Mediterranean sea is the same mechanism that produces nocturnal precipitation in the tropical regions. Three examples have been selected in the Mediterranean basin. The first episode was selected in order to analyse the role of the large land–sea temperature difference and occurred in Israel and Lebanon on 5–6 January 2011 (case 1). The concave curvature of the coastline was selected for the second case and it occurred in Libya during at night from 28 to 31 January 2008 (case 2). Finally, in order to study the role of high SSTs, an event is selected that occurred near the coastline at the Adriatic, Ionian and Tyrrhenian seas on the night of 27 September 2004 (case 3). shows the location of the studied events. Note that these selected events show the role of three different features occurring in different seasons (latest summer to winter), in different areas of the Mediterranean basin. In addition, other events have been detected and studied in the Mediterranean basin: the North African coastline, the Greek and Turkish coastlines, the Gulf of Geneva, Turkey, the north-eastern and southern coastlines of the Iberian Peninsula and in several parts of the Black Sea coastline.
Fig. 1. The Mediterranean basin region. The black squares indicate the location of the studied events.
The structure of this paper is as follows. The methodology used is presented in section 2. Cases 1, 2 and 3 are presented in Sections 3, 4 and 5, respectively. Finally, the main conclusions are provided in Section 6.
2. Methodology
Three different tools were used to study the nocturnal offshore convection near the coastline in the Mediterranean basin. First, NASA's TRMM satellite database (http://trmm.gsfc.nasa.gov/) was used to detect nocturnal precipitation near the coast. Second, NCEP reanalysis was used to describe the synoptic conditions and precipitation events that were detected with TRMM and to evaluate the synoptic causes. Finally, by using the version 3 of the Weather Research Forecast model (WRF-ARW), the dynamics of the atmosphere during the events were analysed.
2.1. TRMM satellite
High-resolution precipitation data was obtained from NASA's TRMM database. The TRMM is a NASA and JAXA satellite launched in 1997 and is designed to measure tropical rainfall for weather and climate research (Haddad et al., Citation1997; Huffman et al., Citation2007a). The satellite images cover tropical and sub-tropical regions of the Earth. This satellite is equipped with remote and passive sensing instruments, including a 13.8 GHz precipitation radar that obtains high-resolution vertical profiles of precipitation. The horizontal resolution at the ground is about 5 km and the portion of the Earth's surface measured during a single overpass is about 247 km2. It is able to detect fairly light rain rates down to 0.7 mm h−1, enough to detect events of weak precipitation. However, according to Sarrand et al. (Citation2012), the TRMM underestimates light rains at latitudes higher than 37°, near the coastline in the Mediterranean basin. Version 6 of the 3B42 product provides 3-hourly accumulated precipitation from an on-board radar instrument (Huffman et al., Citation2007b), at latitudes between −50° and 50°, and longitudes from −180° to 180°, with a spatial resolution of 0.25×0.25 km2. This 3-hourly accumulated rainfall measured by the TRMM satellite has been visualized by the TOVAS tool (TRMM Online Visualization and Analysis System), a member of the Giovanni family (Acker and Leptoukh, Citation2007).
TRMM data is analysed from 18 UTC to 9 UTC every day, to detect possible events of nocturnal precipitation. To accept that the cause of the events detected by using TRMM might be the interaction between nocturnal drainage winds or land-breeze with a synoptic flow, the following conditions have to be fulfilled:
The nocturnal precipitation is formed near the coastline.
The precipitation spot is quasi-stationary offshore near the coast, or it moves slightly.
The precipitation lasts no more than 6 hours and disappears a few hours after the sunrise.
The precipitation extends no more than 500 km and is sometimes in clusters of several individual cells.
2.2. NCEP reanalysis data
In order to understand the synoptic atmospheric conditions, the NOAA-CR20 and NCEP reanalysis database has been used to analyse the atmospheric conditions at sea level and at 850 and 500 hPa geopotential heights. By analysing this data, we are able to discard those episodes of nocturnal precipitation where the dominant cause is related to synoptic features such as convection associated to a dynamic low-pressure area, to some synoptic warm or cold front, or to a trough affecting the region under study.
2.3. WRF model
After applying the criteria defined above, three selected events detected by TRMM have been simulated by using the version 3.3 of the Advanced Research WRF-ARW. This model is a compressible non-hydrostatic finite difference model. In all of the simulations, 42 σ-vertical levels have been defined. For the PBL parameterization, a MRF scheme is used (Hong and Pan, Citation1996), an RRTM scheme for long wave radiation (Mlawer et al., Citation1997), an MM5 shortwave scheme for shortwave radiation (Dudhia, Citation1989) and a WSM scheme (Hong et al., Citation2004) for the microphysics parameterization. No cumulus parameterization is used for any of the smallest domains because the horizontal resolution is lower than 3 km in all of the simulations. In cases 1 and 2, four and three nested domains respectively are defined, the smallest domain having 1 and 2 km of horizontal resolution, respectively. In case 3, a large simple domain of 3 km of horizontal resolution is defined. The initial and boundary conditions were updated every 6 hours with information obtained from the analysis of the ECMWF model.
3. Results
3.1. Case 1: the Israel and Lebanon event on 6 January 2011
Several convective cells were formed offshore near the coastline of Israel and Lebanon during the night and early morning of 6 January 2011 (Heiblum et al., Citation2011). According to the 3 hours accumulated precipitation from the TRMM database, the precipitation formed during the night of the 6th was formed at 00 UTC and disappeared at 06 UTC. The recorded accumulated precipitation in some cells was 14 mm offshore at the southern coastline of Israel, and lower at the northern coastline, from 4 to 8 mm. Heiblum et al. (Citation2011) studied the precipitation in Israel using TRMM database, and show this event as an example of stationary offshore line of precipitation, probably attributed to a land-breeze front.
NCEP surface analysis shows a relatively high-pressure area in the eastern Mediterranean at 00 UTC on 5th January with values of around 1015 hPa, which increases to 1020 hPa at 00 UTC on 6th January (not shown). Another high-pressure area was located over the central Mediterranean Sea. A small and weak low-pressure area (1012 hPa) was located in southern Turkey during those days. At 850 hPa, the temperature in the eastern Mediterranean area was around 8°C at 00 UTC on the 5th and around 10°C at 00 UTC on 6th January, and no horizontal gradient of temperature was observed in the eastern Mediterranean Sea at this height.
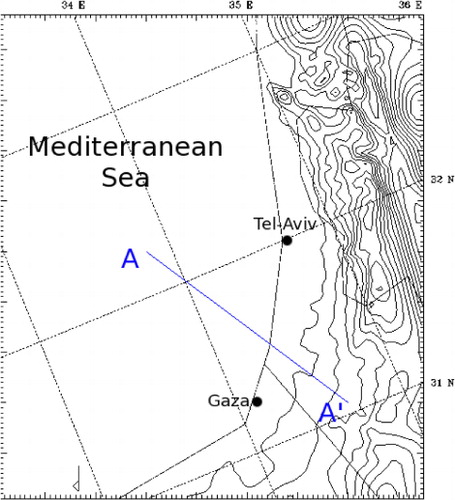
The WRF simulation contains four nested domains with a horizontal grid space of 27, 9, 3 and 1 km. shows domain 3 which covers 255×291 km2.
Fig. 2. Smallest domain (1 km horizontal resolution) defined in WRF simulation for the Israel–Lebanon event. The blue line AA’ indicates the projection of the vertical cross section used to analyse the episode.
shows the simulated divergence (negative convergence) areas (colour contours) and the wind field (arrows) in domain 3 at several hours during the night of 6 January 2011. Two different areas of convergence appear in the simulation. The first one is located inland as a result of the orography. The second area, a few kilometres offshore, forms a convective line due to the interaction of the drainage winds with a prevailing westerly synoptic wind. This line of convergence was stationary for several hours (from 00 to 09 UTC).
Fig. 3. Simulated divergence (negative convergence, colour contours) and wind field (arrows) in the smallest domain at (a) 00 UTC, (b) 04 UTC and (c) 08 UTC on 6 January 2011. The black dot indicates the city of Tel-Aviv. The maximum wind speed is 7.4 m s−1.

Around this convergence line, the model simulates several convective cells that produce precipitation. shows the simulated hourly accumulated precipitation pattern and the wind field in domain 3 at several hours. Several precipitation cells appear around the line of convergence, forming an offshore precipitation line that remains practically stationary from 00 to 08 UTC. Afterwards, some precipitation cells are displaced onshore, producing precipitation near the coastline.
Fig. 4. Simulated hourly accumulated precipitation (colour contours) and wind field (arrows) at (a) 00 UTC, (b) 04 UTC, (c) 06 UTC and (d) 08 UTC on 6 January 2011. The black dot indicates the city of Tel-Aviv. The maximum wind speed is 6.8 m s−1 (a), 6.1 m s−1 (b), 7.3 m s−1 (c) and 6 m s−1 (d).

The stationary offshore line of convergence and precipitation that forms can be explained by the intensity of drainage winds, which is associated to land–sea thermal differences (Khain et al., Citation1993). The simulated potential temperature inland during the night of 6th January was around 280–282 K; over the sea it was 290 K. This strong thermal gradient increased the intensity of drainage winds that reached to 6 m s−1, a velocity comparable to the westerly synoptic flow. At 09 UTC, the drainage wind speed decreased and the convective line disappeared. From 09 UTC to 11 UTC, the stronger westerly synoptic flow moved several cells onshore, where they then disappeared (not show). After sunrise, the land–sea thermal difference decrease and consequently the drainage wind disappeared.
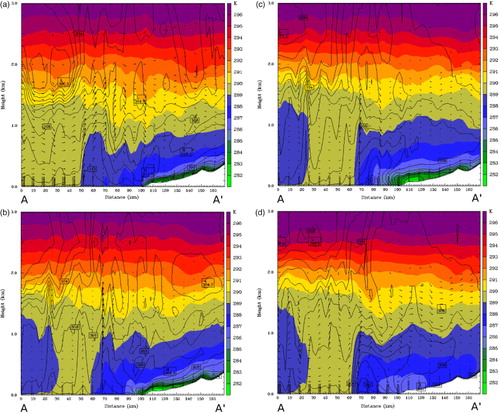
shows the potential temperature (colour contours), the equivalent potential temperature (contour lines) and the wind field (arrows) at the vertical cross section along the line shown in at several hours on 6 January 2011. From 00 UTC until early morning (a), a cold air mass remained stationary a few kilometres offshore until early morning (d). At the head of this cold front, the warm and wet air mass moved upwards, transporting moisture and heat, as indicated by the equivalent potential temperature contour lines (values of around 308–310 K at sea level). Weak atmospheric instability is detected at low levels, as indicated by the decrease in the equivalent potential temperature with height, from 309 K to 304 K at sea level between 1500 and 2000 m. This instability favours the upward transport of heat and moisture from the sea surface (290 K of potential temperature and 10 g/kg of absolute humidity) aloft. Along the line of precipitation, the simulated LFC is located between 600 m to 800 m during the hour of 00 to 08 UTC. The depth of the cold air mass increased from 500 to 600 m at 00 UTC (see a) to 1000 m at 06 and 08 UTC (c and d) as this cold air mass remained stationary offshore and there were continuous drainage winds that provided cold mass to the line of convergence. The maximum vertical wind was produced from 03 to 06 UTC, corresponding to the maximum cell formation (see b and c). b shows strong vertical winds at the head of a cold front at 04 UTC. The warm and wet air moved upward over the cold air at 1.1 m s−1 of vertical velocity, from sea level to more than 3000 m. At 06 UTC (c), the vertical velocity decreased to 0.9 m s−1 to 2000 m. At 08 UTC (d) the vertical velocity decreased to 0.4 m s−1 reaching 1000 m, deflecting horizontally and moving downward.
Fig. 5. Vertical cross section defined along the blue line AA’ shown in of the simulated potential temperature (colour contours), equivalent potential temperature (line contours) and wind field (arrows) at (a) 00 UTC, (b) 04 UTC, (c) 06 UTC and (d) 08 UTC on 6 January 2011.
shows the following values along the AA’ line at the boundary between the cold drained air and the sea air: the simulated depth of the drained cold air mass (h), the relative frontal velocity of the wind against the cold drained air mass (U), LFC, NLFC/U and B. The Brunt-V äis äl ä frequency (N) is evaluated by considering the difference in potential temperature from the ground to the height of the layer involved in the interaction with the cold drained air mass (Miglietta and Rotunno, Citation2012).
Table 1. The simulated depth of the cold drained air (h), LFC, the frontal relative velocity of synoptic and drainage winds (U), parameters NLFC/U and B at several hours during the night of 6 January 2011
Miglietta and Rotunno (Citation2010) showed numerically that the drainage and synoptic flows counterbalance each other if NLFC/U is around 2.5. According to the obtained values in this event the line of convergence should not be stationary because this parameter is around one for the simulation performed. However, according to the reflectivity radar images (not shown) and the WRF simulation (Figs. Citation3–Citation5), the convective line is approximately stationary a few kilometres offshore. It is important to note that NLFC/U does not take into account the synoptic features and only considers idealized profiles. Consequently, the application of the criteria proposed by Miglietta and Rotunno (Citation2010) to a real case has to be carefully considered (M. M. Miglietta personal communication).
In order to analyse the alteration of the synoptic flow by a mountain range, Durran and Klemp (Citation1987) defined the parameter Nh/U, where h is the height of the mountain range and U the wind velocity perpendicular to the mountain. In their numerical experiments, they found that the air flows easily over the mountain ridge with little blockage and minor accelerations on the lee side of the ridge for values of Nh/U around 0.25. For values of 5.0, the flow is entirely blocked by the mountain and the air is forced with large vertical accelerations. Values of around 1.4 represent little blockage over the flat terrain and moderate mountain waves formed on the ridge. Considering the cold mass drained as a mountain, the obtained value of the parameter Nh/U in this event is around 1.1 and 1.25. Therefore, a little blockage is produced by the cold drained air mass, and an alteration of the synoptic flow is produced over the cold air, with some waves.
Finally, the parameter obtained for B is always higher than the LFC. According to Wang et al. (Citation2000), this value indicates that the precipitation is formed over the flow separation line, as shown in Figs. Citation3–Citation5.
3.2. Case 2: the Libyan event on 30 January 2008
According to the TRMM database, five precipitation cells formed along the coastline of Libya at 03 UTC and disappeared at 06 UTC on 30 January 2008. These cells formed a stationary line of precipitation just over the coastline. The maximum recorded 3 hours accumulated precipitation was around 11 mm in the core of the three cells.
The NCEP synoptic reanalysis on the 29th at 00 UTC shows a high-pressure area over the west and central Mediterranean basin (1030 hPa at sea level). A low pressure-area was located over Turkey (1000 hPa), and a northern flow was coming to the coastline of Libya. On the 30th at 00 UTC, the high-pressure of the central Mediterranean basin extended to the south. The isobar of 1030 hPa was located over the coastline of Libya. The low pressure of Turkey moved to the northeast. Consequently, prevailing surface northerly winds existed. At 850 hPa, the NCEP reanalysis shows that at 00 UTC on the 30th, a cold tongue from the north reached Egypt (0 to −5°C) and that a warm mass was located in the central Mediterranean basin (5 to 10°C over Tunis). Between these two different air masses, there was a weak thermal gradient (0 and 5°C over Libya).
Three nested domains were defined with a horizontal grip space of 18, 6 and 2 km. shows the smallest domain used, which covers 710×656 km2. The red and blue lines are the projections of the vertical cross sections used to analyse the role of the shape of the coastline.
Fig. 6. Smallest domain defined in WRF simulation on 30 January 2011. The red (BB’) and blue (AA’) lines are the projection of the vertical cross section.
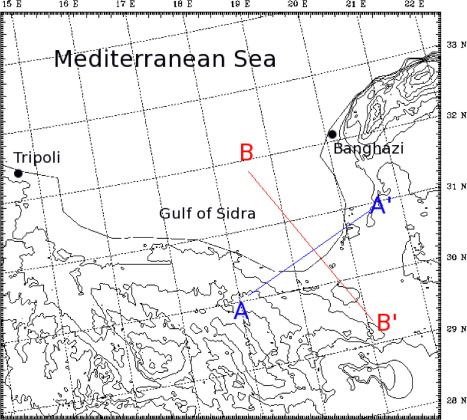
A few kilometres offshore, the model produces a narrow and weak line of convergence parallel to the coastline in the whole Gulf of Sidra (not shown). Around this line of convergence the model does not produce any precipitation except over the sea along the line AA’, in the southwestern extremity of the Gulf.
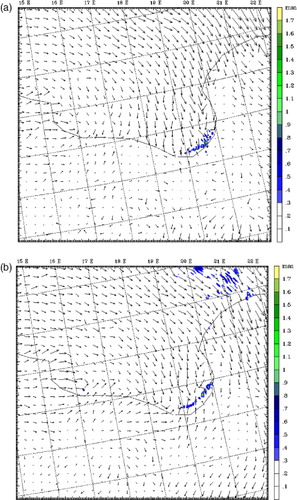
shows the hourly accumulated precipitation (colour contour) and the wind field (arrows) at 03, and 08 UTC on 30 January 2011, which was obtained by the WRF simulation. Several precipitation cells appeared at 01 UTC and slowly moved offshore forming a stationary offshore line of precipitation near the coastline in the Gulf of Sidra from 03 UTC to 08 UTC, when precipitation cells disappeared. The rainfall rate was lower than 1.5 mm h−1. also shows the opposite direction of the northerly synoptic flow and the southerly drainage winds in the area where the precipitation was formed.
Fig. 7. Simulated hourly accumulated precipitation (colour contours) and wind field (arrows) in the smallest domain at 03 UTC (a) and 08 UTC (b). The maximum wind speed is 11.3 m s−1 at 03 UTC and 12.1 m s−1 at 08 UTC.
shows the potential temperature (contour colour), wind pattern (arrows) and equivalent potential temperature (contour lines) on 30th January at the vertical cross section along the line AA’, defined in at several hours. The concave shape of the coastline plays an important role in enhancing convergence and upward movements. At 00 UTC, an inland cold air mass began to move slowly offshore from the opposite east–west coastlines (see a). As the two opposing air masses approached each other, the convergence increased and the warm and wet Mediterranean air mass was forced upward (see b). Then vertical velocity increased to more than 1 m s−1 (maximum vertical velocity is 1.2 m s−1), enough to overcome layers of stable atmosphere and reach LFC, located at around 800–1100 m in height from 01 to 07 UTC. Note that in this case, the equivalent potential temperature decreased with height (a local, unstable layer appeared) while the equivalent potential temperature increased with height over the drained cold air. Consequently, a stable stratification prevailed producing weak convection. The potential temperature changed slightly with height, which indicates a low Brunt-V äis äl ä frequency. Consequently, it was possible for weak vertical movements (waves over the cold air) to be formed. A few hours later, at 08 UTC, both cold masses joined and a cold layer formed over the sea (see c) producing a descending movement of the air masses and causing the precipitation cells to disappear. Over this cold air mass, the equivalent potential temperature increased with height, which denotes a stable stratification at low levels.
Fig. 8. Vertical cross section defined along the blue line AA’ shown in of the simulated potential temperature (colour contours), equivalent potential temperature (line contours) and the wind field (arrows) on 30 January 2011 at (a) 03 UTC, (b) 06 UTC and (c) 08 UTC. The maximum vertical velocity is 1.3 m s−1.

In addition to the convergence of these air masses from opposite areas of the concave coast, many other drained cold air masses moved seaward, converging offshore with the northerly synoptic flow and/or with the other drainage winds that moved offshore from many other areas of the concave coastline (such as those shown in ), enhancing the upward movements of the warm and wet air mass. As an example, an analysis has been performed on the wind field and the potential temperature in a vertical cross section along the line BB’ defined in on 30th January from 03 to 08 UTC (not shown). The head of this cold air mass was stationary a few kilometres offshore for several hours, at approximately junction of lines AA’ and BB’, defined in . In this area, the convergence of cold air drained from inland followed different directions, due to the concave shape of the coastline, and produced an upward transport of heat and moisture, enhancing the formation of convective cells.
3.3. Case 3: the Adriatic, Ionian and Tyrrhenian Seas event on 27 September 2004
High SST values are commonly recorded during late summer and early autumn in the Mediterranean basin. Consequently, the air over the sea is much warmer than it is inland during the night. A large land–sea thermal difference appears to favour a situation in which cold inland air moves offshore. This situation may also occur during the winter months (cases 1 and 2). However, during the summer and early autumn, higher SST values provides moisture and heat that can be transported, which enhances precipitation more than during the winter events.
According to the TRMM database, on the night of 27 September 2004, many offshore precipitation cells formed at 03 UTC in the Tyrrhenian Sea, in the Mediterranean Sea, on the Adriatic coast of Italian peninsula and in the centre of the Adriatic sea. From 03 UTC to 06 UTC, the accumulated precipitation increased from 6 to 24 mm in the Adriatic Sea, and from 6 to 12 mm in the Tyrrhenian Sea. During this same period, several cells appeared in northern Sicily, accumulating around 20 mm in 3 hours. At 09 UTC the precipitation areas disappeared.
According to the NCEP reanalysis, a small and weak low-pressure area (1010 hPa at sea level) was located over the Ionian Sea on 27th September at 00 UTC. Surrounding this, relatively high-pressure areas defined the atmosphere (1015 hPa in the central Italian Peninsula, 1025 hPa and 1020 hPa in both the western and eastern Mediterranean basin). A relatively cold air front from northern Europe affected the central Mediterranean (temperatures from 5 to 10°C at 850 hPa).
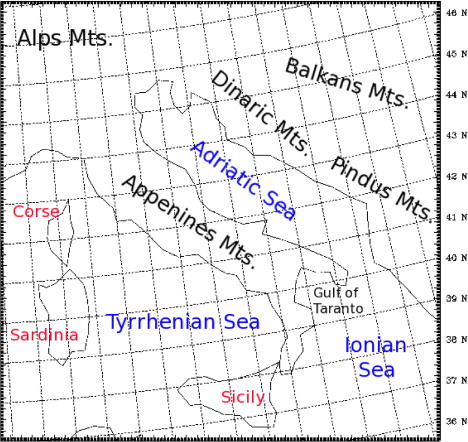
shows the domain defined in the WRF simulation for studying this event. The grid spacing is 3×3 km2 and covers 1200×1200 km2. The simulation was initialized at 12 UTC on 26th September, more than 12 hours prior to the event, and it ended at 18 UTC on 27th September.
shows the simulated hourly accumulated precipitation pattern (colour contours) and the wind field (arrows) at 03 and 08 UTC. Different precipitation areas appear in the simulation. The first one is located in the Tyrrhenian Sea off the coastlines of the Italian peninsula and Sicily (indicated as 1 in a). Strong drainage winds (around 11 m s−1) move from the northwestern Italian coast into the Tyrrhenian Sea, leading a cold air mass with a depth of around 500 m height (not shown). After moving 100 km offshore, it deflects to the south, probably forced by the drainage winds coming from Corsica and Sardinia. These drainage winds interact with the drainage winds coming from the Southern part of the Italian Peninsula, enhancing convection.
Fig. 10. Simulated accumulated precipitation (colour contours) and wind field (arrows) at (a) 03 UTC and (b) 08 UTC on 27 September 2004. The maximum wind speed is 11.1 m s−1 and 12.5 m s−1 in upper and lower panels, respectively.
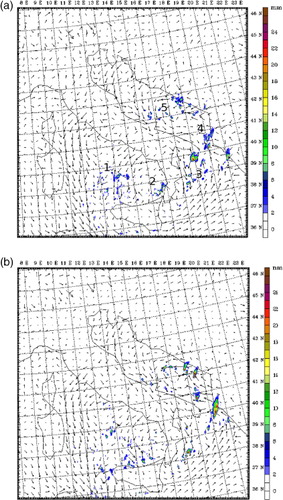
The second area of precipitation indicated as 2 in a appears at the north coast of Sicily. Drainage winds from north Sicily converge frontally a few kilometres offshore with a northeast flow (drainage wind coming from the southwest of Italy).
A third area (3 in a) can be observed in the Ionian Sea, in the Gulf of Taranto, where drainage winds reach 12 m s−1 at 03 UTC and converge offshore with a southwest synoptic flow. Several convective cells adopted a line of precipitation.
A fourth area (4 in a) can be differentiated in the extreme southeast of the Adriatic Sea, where southeast drainage winds move offshore to the Adriatic Sea. Several kilometres offshore, northwest drainage winds from the Italian inland move offshore in the Adriatic Sea. Both drainage winds converge offshore, forming several convective cells that form a big quasi-stationary precipitation area. Finally, the last interested area is located over the Adriatic Sea, between the Apennines and Balkan Mountains (indicated as 5 in a). At 20 UTC (not shown), the interaction of drainage winds from both coastlines is the cause of convection in this area, and precipitation in the southern part, where this interaction between drainage winds forms a cyclonic movement over the Adriatic Sea that lasts until early morning (see a and b).
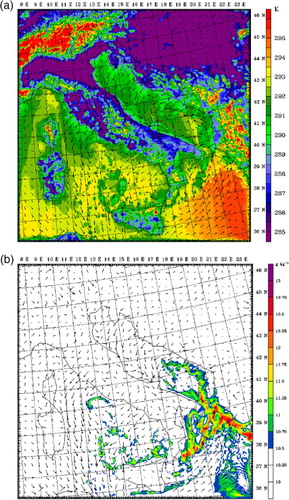
Drainage winds also have an important role in cooling the air over the sea. a shows the simulated potential temperature at 06 UTC. At the boundary between the cold drained air mass and the warm air mass, water vapour accumulates and forms lines of high moisture. b shows the water vapour-mixing ratio at 06 UTC. In the areas of convergence, a large amount of moisture exists, corresponding approximately to the precipitation cells shown in .
4. Conclusions
Three different events of nocturnal convection and precipitation in the Mediterranean basin have been studied.
The TRMM image database has been used to detect nocturnal precipitation areas near the coastline in different areas of the Mediterranean basin. By using the NCEP reanalysis, we have discarded those precipitation events caused by synoptic phenomena, such as large dynamic low-pressure areas, polar fronts, or a synoptic trough affecting the considered region. Finally, the WRF model has been used to analyse the selected events.
The first analysed event (Israel event on 6 January 2011) is characterized by a large sea–land thermal gradient of around 8–10 K (from 290 K over the sea to 280–282 K inland). The precipitation, detected by TRMM and simulated by the WRF model, shows a good correlation in both intensity and location, but not in extension. In this event, the WRF simulation shows a stationary convergence line offshore caused by the interaction of drainage winds with an easterly synoptic flow of similar wind speed, around 6 m s−1. The cold air depth increases from around 500 m at 00 UTC to around 1000 m at 08 UTC, higher than the LFC during the whole night. Consequently, convection is triggered by the cold air mass (drained air). The convective cells are formed over the boundary of both cold and relatively warm air masses, as indicated by the values of B.
In case 2 (Libya event on 30 January 2011), the concave shape of the Gulf of Sidra plays an important role in enhancing convergence and convection. The TRMM images show a large precipitation area over the coastline of the Gulf of Sidra, formed by several large cells. The WRF model does not reproduce the precipitation areas, and only small cells are reproduced in a small part of the Gulf of Sidra, where the large concavity of the coastline exists. The cells are formed by offshore convergence near the coastline, caused by inland cold air and led by drainage winds from many areas along the concave coastline in the extreme East of the extreme Gulf of Sidra. Drainage winds move offshore frontally from the opposite parts of the concave coastline, converging offshore. Additionally, drainage winds also converge frontally with the northern synoptic flow. The result is a convergence area that moves heat and moisture upwards from the sea, at velocities that reach 1.2 m s−1. This strong vertical velocity moves moisture and warm air upward, where it reaches the LFC that is located at around 800–1100 m. However, there is a large atmospheric stability aloft which prevents the formation of severe convection.
The last analysed case occurred over the Adriatic, Ionian and Tyrrhenian Seas on 27 September 2004. TRMM images show many precipitation cells along the coastline of these seas forming at 03 and disappearing at 06 UTC. However, the WRF simulation does not reproduce exactly the same extension and intensity, mainly in the northern part of the defined domain. The WRF simulation shows the interaction of drainages winds with other drainage winds offshore and with a synoptic flow as the mechanism that produces this kind of precipitation.
In addition to the events presented in this paper, more events have been detected and simulated in the whole Mediterranean basin and in all seasons, finding that the dynamics that produce nocturnal convection are similar to those produced in tropical areas. However, in the Mediterranean basin, the convective cells are smaller and produce weaker precipitation than those detected in tropical seas.
The nocturnal precipitation events detected and simulated occurred in a stable or weakly unstable atmosphere and commonly have a local scale. For this reason, it can be difficult to forecast. However, the knowledge of the local and regional features (drainage wind formation, shape of the coastline, SST) and the mechanisms explained in this paper could help to improve the forecasting by a numerical model, which sometimes does not have enough resolution to detect these precipitation cells.
5. Acknowledgments
This project has been carried out by using the resources of the Supercomputing Center of Catalonia (CESCA) and it has been performed under the Spanish MICINN project CGL2009-08609, and the INTERREG EU project FLUXPYR EFA 34/08. The images and data used in this study were acquired using the GES-DISC Interactive Online Visualization And Analysis Infrastructure (Giovanni) as part of NASA's Goddard Earth Sciences (GES) Data and Information Services Center (DISC).
References
- Acker J. G. Leptoukh G. Online analysis enhances use of NASA earth science data. EOS. 2007; 88(2): 14–17. 10.3402/tellusa.v65i0.20027.
- Callado, A and Pascual, R. 2002. Storms in front of the mouth rivers in north-eastern coast of Iberian peninsula. In: Proceedings of the 4th Plinius Conference on Mediterranean Storms. Mallorca: Spain, pp. 59–62.
- Dudhia M. Numerical study of convection observed during the winter monsoon experiment using a mesoscale two-dimensional model. J. Atmos. Sci. 1989; 46: 3077–3107.
- Durran D. R. Klemp J. B. Another look at downslope winds. Part II: nonlinear amplification beneath wave-overturning layers. J. Atmos. Sci. 1987; 44: 3402–3412.
- Goldreich Y. Mozes H. Rosenfeld D. Radar analysis of cloud systems and their rainfall yield in Israel. Isr. J. Earth Sci. 2004; 53: 63–76. 10.3402/tellusa.v65i0.20027.
- Haddad, Z. S, Smith, E. A, Kummerow, C. D, Iguchi, T, Farrar, M. R. and co-authors. 1997. The TRMM day-1 radar/radiometer combined rain profiling algorithm. J. Meteor. Soc. Jpn. 75, 799–809.
- Heiblum R. H. Koren I. Altaratz O. Coastal precipitation formation and discharge based on TRMM observations. Atmos. Chem. Phys. 2011; 11: 13201–13217. 10.3402/tellusa.v65i0.20027.
- Hong S. Dudhia J. Chen S. A revised approach to ice microphysical processes for the bulk parameterization of clouds and precipitation. Mon. Weather. Rev. 2004; 132: 103–120.
- Hong S.-Y. Pan H.-L. Nonlocal boundary layer vertical diffusion in a medium-range forecast model. Mon. Weather. Rev. 1996; 124: 2322–2339.
- Houze R. A. Geostis S. G. Marks F. D. West A. K. Winter monsoon convection in the vicinity of north Borneo. Part I: structure and time variation of the clouds and precipitation. Mon. Weather. Rev. 1981; 109: 1595–1614.
- Huffman, G. J, Adler, R. F, Bolvin, D. T, Gu, G, Nelkin, E. J. and co-authors. 2007a. The TRMM Multi-satellite precipitation analysis: quasi-global, multi-year, combined-sensor precipitation estimates at fine scale. J. Hydrometeorol. 8(1), 38–55. 10.3402/tellusa.v65i0.20027.
- Huffman G. J. Adler R. F. Curtis S. Bolvin D. T. Nelkin E. J. Global rainfall analyses at monthly and 3-hr time scales in a book. Measuring Precipitation from Space: EURAINSAT and the Future. Levizzani V.Bauer P.Turks F. J.Kluwer Academic Pub. B.V, Dordrecht: The Netherlands, 2007b; 291–306.
- Khain A. P. Rosenfeld D. Sednev I. L. Coastal effects in the Eastern Mediterranean as seen from experiments using a cloud ensemble model with a detailed description of warm and ice microphysical processes. Atmos. Res. 1993; 30: 295–319. 10.3402/tellusa.v65i0.20027.
- Malda D. Vilà-Guerau de Arellano J. Van der Berg W. D. Zuurendonk I. W. The role of atmospheric boundary layer-surface interactions on the development of coastal fronts. Ann. Geophys. 2007; 25: 341–360. 10.3402/tellusa.v65i0.20027.
- Mapes B. Warner T. Xu M. Negri A. Diurnal patterns of rainfall in northwestern South America. Part III: diurnal gravity waves and nocturnal convection offshore. Mon. Weather. Rev. 2003; 131: 830–844.
- Mazón J. Pino D. Pluviometric anomaly in the Llobregat delta. J. Meteor. Clim. Med. 2009; 5: 31–50.
- Miglietta M. M. Rotunno R. Numerical simulations of low-CAPE flows over a mountain ridge. J. Atmos Sci. 2010; 67: 2291–2401. 10.3402/tellusa.v65i0.20027.
- Miglietta, M. M and Rotunno, A. 2012. Application of theory to simulations of observed cases of orographically forced convective rainfall. Mon. Weather. Rev. 140, 3039–3053. DOI: http://dx.doi.org/10.1175/MWR-D-11-00253.1.10.3402/tellusa.v65i0.20027.
- Meyer J. H. Radar observations of Land Breeze Fronts. J. Appl. Meteor. 1971; 10: 1224–1232.
- Mlawer E. J. Taubman S. J. Brown P. D. Iacono M. J. Clough S. A. Radiative transfer for inhomogeneous atmospheres: RRTM, a validated correlated-k model for the longwave. J. Geophys. Res. 1997; 102: 663–682. 10.3402/tellusa.v65i0.20027.
- Mori, S, Hamada, J.I, Tauhid, Y.I, Yamanaka, M.D, Okamoto, N. and co-authors. 2004. Diurnal land–sea rainfall peak and migration over Sumatra Island, Indonesian maritime continent observed by TRMM satellite and intensive rawinsonde soundings. Mon. Weather. Rev. 132, 2021–2039.
- Newmann J. Land breezes and nocturnal thunderstorms. J. Meteor. 1951; 8: 60–67.
- Ohsawa T. Ueda H. Hayashi T. Watanabe A. Masumoto J. Diurnal variations of convective activity and rainfall in tropical Asia. J. Meteor. Soc. Jpn. 2001; 79: 333–352. 10.3402/tellusa.v65i0.20027.
- Reeves H. D. Rotunno R. Orographic flow response to validations in upstream humidity. J. Atmos. Sci. 2008; 66: 3557–3570. 10.3402/tellusa.v65i0.20027.
- Sarrand, B, Dulac, F, Baldi, M, Bargaoui, Z, Cindrie, K. and co-authors. 2012. Precipitation in the Mediterranean basin as seen from the 2000–2010 TRMM-3B42-v6 database. EGU. Gen. Assem. 2012. 11965.
- Schoenberg L. M. Doppler radar observation of land-breeze cold front. Mon. Weather. Rev. 1984; 112: 2455–2464.
- Simpson J. E. Britter R. E. A laboratory model of atmospheric mesofront. Q. J. Roy. Meteor. Soc. 1980; 106: 485–500. 10.3402/tellusa.v65i0.20027.
- Wang J. J. Rauber R. Ochs H. T. III. Carbone R. E. The effects of the island of Hawaii on offshore rainband evolution. Mon. Weather. Rev. 2000; 128: 1052–1069.
- Yang G. Y. Slingo J. M. The diurnal cycle in the tropics. Mon. Weather. Rev. 2001; 129: 784–801.
- Yu C.-K. Jou B. J.-D. Radar observations of the diurnally forced offshore convective lines along the southeastern coast of Taiwan. Mon. Weather. Rev. 2004; 133: 1613–1636. 10.3402/tellusa.v65i0.20027.
- Zuidema P. Convective clouds over the Bay of Bengal. Mon. Weather. Rev. 2003; 131: 780–798.
