ABSTRACT
Mean sea level (MSL) in the Baltic Sea is influenced by several factors and therefore presents a complex behaviour over a wide range of time-scales. This work performs a multi-scale analysis of MSL variability in the Baltic Sea using discrete wavelet analysis. The North Atlantic Oscillation (NAO) is well known for having a strong influence in MSL variability over the Baltic; however, the relationship between MSL and NAO at different time-scales is still little understood. In this work a comparison of MSL and NAO variability is performed for a wide range of temporal scales, uncovering distinct relationships in high-frequency and long-term temporal variability. The annual and sub-annual scales are found to account for more than 50% of the total MSL variability. The MSL annual cycle is analysed and a shift from low to high amplitude values is identified in the 1970s for most stations. MSL is found to be anti-correlated to NAO at short time-scales while on the long-term NAO and MSL appear to be positively correlated for most stations. The physical mechanisms behind these distinct relationships deserve deeper study.
1. Introduction
Sea level long-term variability and its association with climate variability is a particularly relevant topic in a climate change context (Vermeer and Rahmstorf, Citation2009). Sea level reflects changes in the ocean, atmosphere and cryosphere making it a useful integral indicator of climate variability and climate change. Long-term regional sea level variability is also of a significant societal interest in terms of input for coastal management and planning, as well as long-term assessment of risk of storm surges and extreme sea level events.
Historical sea level measurements are available from tide gauges. However, one must take into account that tide-gauges evaluate sea level changes relative to fixed points in land. Thus, these records are often contaminated by land movements (upwards or downwards) as a consequence of local or global movements (Tsimplis et al. Citation2006). Very prolonged sea level records are therefore particularly important for climate studies (Ekman, Citation1999).
The measurement of sea level in the Baltic Sea has a very long and rich history (Ekman, Citation2009). The Baltic region holds an exceptional network of very long and reliable sea level records making it particularly appealing for the study of long-term sea level changes and other geophysical phenomena such as postglacial land uplift (Ekman and Mäkinen, Citation1996) and the pole tide (Ekman and Stigebrandt, Citation1990).
Long-term sea level changes in the Baltic are strongly influenced by different physical mechanisms including: (1) wind stress and surface pressure patterns associated with atmospheric circulation dynamics (Yan et al., Citation2004; Jevrejeva et al., Citation2005; Hünicke and Zorita, Citation2008); (2) changes in the hydrological cycle, including precipitation (snow and rainfall), but also evapotranspiration (Hünicke and Zorita, Citation2006, Citation2008); (3) thermal effects (Chen and Omstedt, Citation2005; Hünicke and Zorita, Citation2006); (4) long-term glacio-isostatic movements (Ekman and Mäkinen, Citation1996). Moreover, with the exception of the latter, all these mechanisms are seasonal dependent, with the westerly winds being determinant in winter (with smaller contributions from the temperature and precipitation) while the role played by precipitation increases during summer (Hünicke and Zorita, Citation2006, Citation2008).
The Baltic is a semi-enclosed sea and therefore heavily affected by winds over the North Sea and the Baltic entrance that control the exchange of water through the narrow Danish Straits (Samuelsson and Stigebrandt, Citation1996). Wind forcing in the Baltic region is closely associated with North Atlantic atmospheric circulation patterns and therefore the state of the North Atlantic Oscillation (NAO). The influence of the NAO pattern on sea level has been shown to explain a large fraction of mean sea level (MSL) variability in the North Sea (Tsimplis et al., Citation2006) but also over most of the Mediterranean basin (Tsimplis and Josey, Citation2001) and the eastern sector of the North Atlantic (Woolf et al., Citation2003). Previous studies have shown that sea level records from the Baltic display a significant correlation with the NAO during winter (Johansson et al., Citation2001; Andersson, Citation2002; Lehmann et al., Citation2002; Omstedt et al., Citation2004; Jevrejeva et al., Citation2005). The positive winter NAO can modulate the Baltic MSL through various mechanisms, all related with the shift in the preferred location of storm-tracks (Trigo, Citation2006), this includes: (1) the strength of the westerlies, that can pile the water in the northern and eastern sectors of the Baltic (Jevrejeva et al., Citation2005); (2) the lower than average surface pressure over the Baltic Sea region, that contribute to high MSL values through the inverse barometer effect (Tsimplis and Josey, Citation2001); (3) higher values of precipitation over the Scandinavian and Baltic Sea area, thus increasing the fresh water run-off into the Baltic (Hünicke and Zorita, Citation2006); and, finally (4) higher than-average temperature, that can increase the water column height through expansion (Hünicke and Zorita, Citation2008).
Nevertheless, the impact of the NAO on the Baltic Sea level varies considerably in space within this semi-enclosed basin (Hünicke and Zorita, Citation2006) and, additionally, it is not stationary in time, varying significantly since the mid-19th century (Jevrejeva et al., Citation2005). This heterogeneous relationship between NAO and the Baltic Sea level is partially due to the effect of other relevant physical mechanisms such as temperature (Chen and Omstedt, Citation2005) and precipitation (Hünicke and Zorita Citation2006, Citation2008), two climatic fields that are also related to the winter NAO phase (Hünicke and Zorita, Citation2008). It should be noticed that the vast majority of NAO related publications only focus on the winter season, when this pattern is more significant and its impacts affect an area that spans between North America and Eurasia. However, in recent years a number of studies have analysed in detail the dynamics of summer NAO Feldstein (Citation2007); Folland et al. (Citation2009) including the associated impacts upon the European climate (e.g. Bladé et al., Citation2012). According to this later study the influence of summer NAO in northern European latitude precipitation is the reverse (i.e. less precipitation) to what can be observed in the winter (see in Bladé et al., Citation2012) and this results from the high pressure values that dominate these latitudes and the prevailing winds (see in Bladé et al., Citation2012).
The present study addresses the association between Baltic Sea level and the state of the NAO from a scale-based perspective. In contrast with previous studies (e.g. Yan et al., Citation2004; Jevrejeva et al., Citation2005) a discrete wavelet analysis (Percival and Walden, Citation2006) is performed. Furthermore longer records are analysed, including the last decade, and the analysis is performed over the complete monthly records, thereby not restricting focus to the winter season. Given the wide range of variability scales present in sea level signals, discrete wavelet techniques are particularly useful in the analysis of tide gauge records as well as climate indices such as the NAO (Barbosa et al., Citation2006). In this work a monthly time-series is used to describe the state of the NAO, rather than a winter-only index, and the influence of the NAO on sea level variability is assessed over a consistent set of scales, from high-frequency to long-term temporal scales, using the discrete wavelet transform.
2. Data
2.1. Mean sea level
Mean sea level data consist from monthly records from 11 tide gauges located around the Baltic Sea coastline with a predominance on the northern shore (). Long and continuous records (covering at least the 20th century and with less than 2% of missing observations, ) are selected from the Permanent Service for Mean Sea Level (PSMSL) database (Woodworth and Player, Citation2003).
Fig. 1. Location of tide gauges over the Baltic Sea.
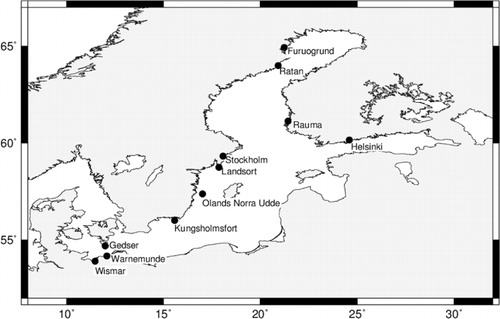
Table 1. Analysed tide gauge records
The Baltic region experiences a significant uplift due to postglacial rebound which causes a decreasing trend in relative sea level observed by tide gauges (). The postglacial land uplift effect is reflected as a linear component of the long-term eustatic sea level change combined with any other long-term signals related with regional climate forcing, such as the pressure and wind stress associated with the NAO pattern. Since the focus of the present study is on scale-based sea level changes, rather than long-term trends, the glacial isostatic adjustment GIA signal is not a relevant component and, therefore, the analysis was performed on the raw data.
Fig. 2. Time-series of MSL for each location after removing the GIA trend and the mean from the original records.

However, it is worth noting that the analysis was also performed on GIA corrected sea level records using the GIA estimates based on the VM4 earth model (Peltier, Citation2004) from the PSMSL website (http://www.psmsl.org) and the same results were obtained (not shown).
2.2. North Atlantic Oscillation index
North Atlantic Oscillation monthly data were extracted from the Climate Research Unit (CRU) extended NAO database, covering the period from 1828 to 2012, which is derived from station observations in Stykkisholmur/Iceland and Gibraltar/Iberian Peninsula (Jones et al., Citation1997). This index has been found to provide a better representation of the spatial configuration of the entire NAO dipole (Pozo-Vázquez et al., Citation2000).
We should stress that our MSL time-series ends in 2010, therefore extending (by at least on more decade) most previous studies of Baltic Sea level trends and variability (Ekman, Citation1999; Johansson et al., Citation2001; Andersson, Citation2002; Lehmann et al., Citation2002; Omstedt et al., Citation2004; Chen and Omstedt, Citation2005; Jevrejeva et al., Citation2005; Hünicke and Zorita, Citation2006, Citation2008). This is particularly relevant as this updated dataset period provides an additional decade after the intense increase of winter NAO index observed between 1970s and mid 1990s (Trigo et al., Citation2004).
3. Methods
Discrete wavelet analysis is a powerful, non-parametric method that is particularly adequate to evaluate temporal variability of geophysical variables at different temporal scales (Percival and Walden, Citation2006). Most time-series in geosciences are non-stationary with important changes in time of major periodicities (Torrence and Compo, Citation1998). Thus, the application of standard power spectrum techniques (such as the Fast Fourier Transform) is not the most suitable method. The Maximal Overlap Discrete Wavelet Transform (MODWT) (Percival and Mojfeld, Citation1997) is the base of two possible additive decompositions of a given time-series: an analysis of variance over J time-scales and a multiresolution analysis (MRA) that consists in re-expressing the original time-series as a sum of sub-series corresponding to each time-scale (Percival, Citation2008). This decomposition results in J+1 sub-series: J wavelet coefficient (D
j
) time-series corresponding to pass-band filtering scales of 2
j
to 2
j+1 months (j=1, 2,…, J) and a scaling coefficients time-series (smooth, S
J
) corresponding to scales above 2
J
months.
The MODWT allows partitioning the total variance by scale and may be interpreted as the equivalent to the spectral density function, but regarding scales instead of frequencies. Wavelet covariance provides a measure of the association between two series for each scale and is simply defined as the covariance of the wavelet coefficients for a given scale (Lindsay et al., Citation1996). Wavelet correlation can also be derived by normalisation of the wavelet covariance.
In this work the MODWT is applied to both MSL time-series and the monthly index describing the state of the NAO in order to characterise the temporal variability of the data on a scale-by-scale basis. The empirical wavelet variance is computed (excluding boundary wavelet coefficients) for each sub-series of MSL and NAO in order to identify the most relevant scales of variability for each dataset, and the wavelet correlation is calculated to assess the association between MSL and NAO for each temporal scale. All results are presented with a 95% confidence level.
4. Results
shows the MSL time-series analysed in this work. Results are presented in detail for Furuogrund, located in the northern part of the Baltic Sea (), in Section 4.1, and then summarised for all other locations in Section 4.2.
4.1. Furuogrund
The Furuogrund record, as shown in (upper panel), is characterised by fluctuations around an approximately constant level during the 1916–2010 period. A more detailed description of the variability structure of MSL at Furuogrund is provided by the MRA decomposition shown in . The additive decomposition into six (J=6) scales is based on the MODWT with a Daubechies (Citation1988) least-assymetric filter of width L=8. The annual component is captured by scale (8 to 16 months), multi-year variability is captured by scales
and
and the decadal variations or above are, respectively, represented by
and the smooth series. Scales
and
correspond to monthly and semi-annual variations, respectively. shows high variability on annual and intra-seasonal scales. The dominance of these scales (
–
) is confirmed by the wavelet variance analysis (), which indicates that the annual and the semi-annual cycles are the main contributors to MSL variability, accounting together for more than half of the total variance (34 and 24%, respectively).
Fig. 3. MRA decomposition of MSL in Furuogrund. From top to bottom: D1-D6 wavelet coefficients associated with time-scales of 2
j
to 2
j+1 months (j=1, 2,…, 6); S6 scaling coefficients (smooth), corresponding to time-scales above 27 (128) months. Vertical dashed lines mark the regions at the beginning and end of the series that are affected at least to some degree by boundary conditions.
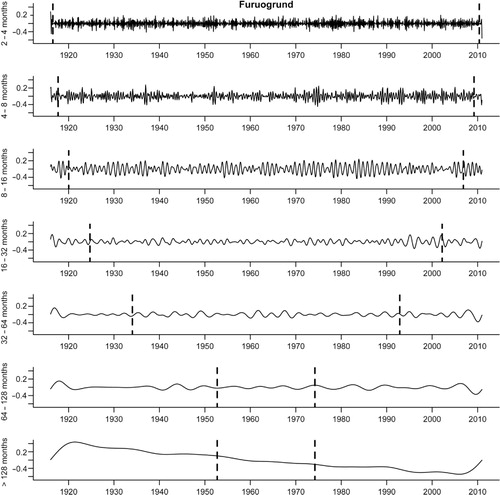
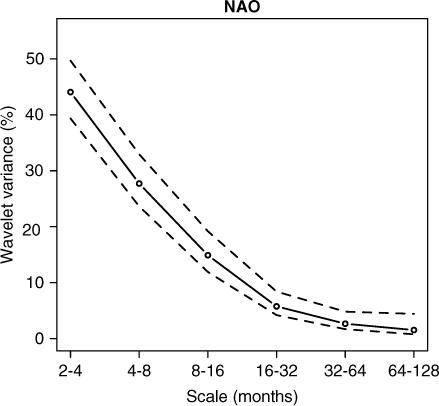
Fig. 4. Normalised empirical variance (%) of MSL in Furuogrund. The dashed lines indicate the 95% confidence interval.

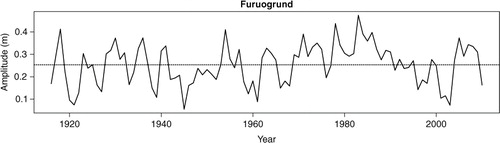
Due to its high contribution to overall MSL variability, the annual cycle deserves to be studied in greater detail. In Furuogrund, the average monthly MSL (not shown), computed by simply calculating the average of each month over the whole period, indicates that sea level peaks around December, decreasing during winter and spring (January–May), as a result of large changes in atmospheric pressure and accompanying strong winds in late autumn/early winter (Samuelsson and Stigebrandt, Citation1996). The MSL seasonal cycle does not capture eventual changes in amplitude and phase from year-to-year. Observation of the wavelet coefficients corresponding to the annual signal (scale ) suggests a complex temporal behaviour and that the amplitude of the annual cycle is not constant: throughout the 95-yr period, it varies between low values, for instance in the 1940s and early 21st century, and high ones in the 1970s and 1980s. This is confirmed by the observation of the yearly amplitude time-series computed as the difference between the maximum and minimum values of the annual signal obtained by MRA for each year () which exhibits high year-to-year variations but also slow fluctuations over several decades. Two distinct periods appear to be distinguishable, separated by a transition from low amplitudes to large ones in the 1970s, in accordance with previous long-term assessments of amplitude changes during the 20th century (Hünicke and Zorita, Citation2008). In fact, from 1916 to 1970 more than 57% of those years present amplitudes below average (0.25 m), while in the period from 1970 onward, amplitudes below average only account for 33% of the years. The relationship between changes in the amplitude of the annual cycle and the winter NAO index is analysed by calculating the correlation between the two variables. The NAO is known to influence MSL, in particular variations between winter and spring, through changes in sea level pressure (SLP) and wind forcing (Hünicke and Zorita, Citation2006,
Citation2008). However, the simple correlation between the two series is not significantly different from zero.
Fig. 5. MSL annual amplitude during the period 1916–2010 for Furuogrund.
The relationships between NAO and MSL can be further uncovered by performing a MRA on the NAO time-series (over the period that is common to both series, i.e. 1916–2010), based on the same scales as used for MSL and comparing the results. The MRA decomposition of the NAO dataset () and the corresponding wavelet variance () highlight the well known highly variable behaviour of NAO, since the short scales (–
) account for about 72% of the total variance. These results are in agreement with previous works that have analysed the main modes of NAO variability using more classical methods (e.g. Gámiz-Fortis et al., Citation2002).
Fig. 6. As in , but for NAO time-series. Vertical dashed lines mark the regions at the beginning and end of the series that are affected at least to some degree by boundary conditions.
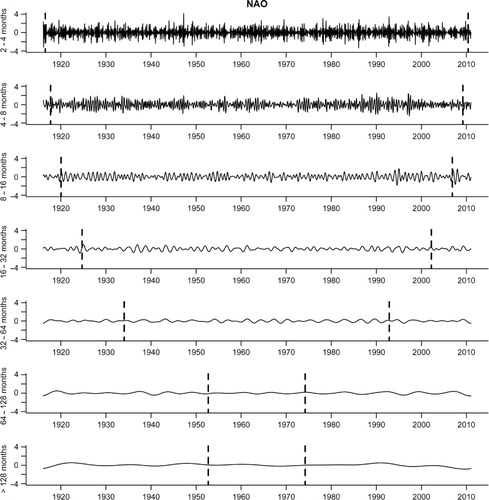
Fig. 7. As in , but for the NAO time-series. The dashed lines indicate the 95% confidence interval.
Superimposing the two MRA decompositions (not shown) MSL variability features appear to correspond to NAO variability patterns, especially for longer time-scales. In order to evaluate whether MSL and NAO scale-based variability patterns are related, the wavelet correlation between the variables was calculated over scales to
().
Fig. 8. Wavelet correlation between MSL in Furuogrund and NAO for scales of 2
j
to 2
j+1 months (j=1, 2,…, 6). The dashed lines indicate the 95% confidence interval.
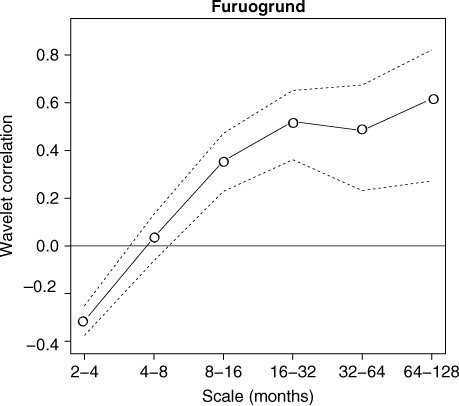
Above the annual signal (8–16 months) the correlation between the two variables increases consistently with scale, i.e. coherence between MSL and NAO is higher for larger scales (low frequency variations). Therefore the relation increases when we consider multi-annual and decadal scales. On very short scales MSL and NAO are anti-correlated, i.e. positive NAO values are associated with lower MSL values, while long-term variations in MSL are positively correlated with the state of the NAO.
4.2. Baltic Sea level records
Here we extend the wavelet analysis performed in Section 4.1 to all the sea level stations located around the Baltic Sea (). The yearly amplitude series obtained from the annual signal resulting from the corresponding MRA decomposition are shown in . Except for the stations in the south-western part of the Baltic (Gedser, Wismar and Warnemunde) all the other stations exhibit changes in the annual amplitude similar to the Furuogrund station, with a clear trend from low amplitudes between the late 1940s to predominantly high ones in the early 1980s. This result is in agreement with studies focusing only on the MSL decadal variability that have shown the strong dependence of northern and eastern stations on the major regional SLP patterns (Hünicke and Zorita, Citation2008). In contrast the southern stations exhibit a stabler, even slightly decreasing temporal pattern. Changes in the seasonality of Baltic Sea level are influenced by atmospheric conditions over the Baltic area, but as in the case of Furuogrund, the correlation between the yearly amplitude time-series in and the winter NAO index is not statistically significant. This gradual dissociation between MSL and NAO at annual and decadal scales, for the southern Baltic stations, is compatible with previous results that have stressed the role of hydrological variables (namely precipitation) for those stations (Hünicke and Zorita, Citation2008).
Fig. 9. As in but for all MSL records.

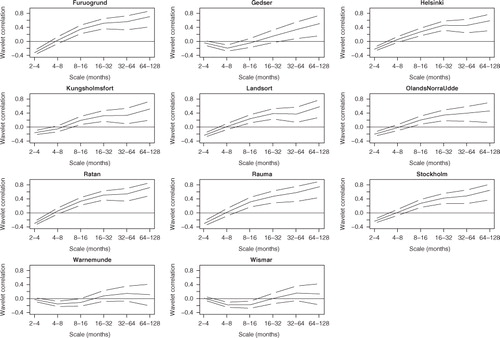
The scale-based correlation between MSL and NAO shown in varies considerably over the Baltic area. For the southern stations at the German coast, Warnemunde and Wismar, the correlation between MSL and NAO is not significant. Gedser, the Danish station in the Baltic entrance, exhibits an intermediate behaviour with no significant high-frequency correlation but significant positive correlation between MSL and NAO on multi-year and longer time-scales, increasing with scale. All the other stations, farther from the Baltic entrance, exhibit the same scale-by-scale correlation pattern with a statistically significant anti-correlation between MSL and NAO on very short time-scales and a positive correlation on long time-scales, increasing with scale.
Fig. 10. As in but for all MSL records. The dashed lines indicate the 95% confidence interval.
5. Discussion and conclusions
The discrete wavelet approach applied in this work allowed to derive a flexible description of sea level variability in the Baltic Sea considering a wide range of temporal scales. The annual cycle, which explains a large fraction of the variance (about 30%) of the analysed tide gauge records, exhibits significant variability in amplitude from year-to-year.
The wavelet results show an increase in amplitude of the annual cycle, that could be summarised by a linear trend over the whole period, but the annual patterns obtained in this work are far more complex and variable. The changes in seasonal amplitude identified here are of the order of 20–40 cm and spatially consistent, with stations in the Baltic entrance exhibiting more stable annual amplitudes than the northern stations. Furthermore, a transition from lower to higher annual amplitudes in the 1970s is visible in all records except the ones located in the Baltic entrance.
The results are consistent with previous findings inferred from ‘moving Fourier’ analysis of an increase in the amplitude of the seasonal cycle in the late 20th century associated with atmospheric changes in wind stress over the ocean (Ekman and Stigebrandt, Citation1990; Plag and Tsimplis, Citation1999). Wavelets allow for a more realistic description of temporal changes in the seasonal cycle, avoiding the arbitrary pre-setting of windows needed for ‘moving Fourier’ approaches. Since these changes in seasonality are expected to be related to atmospheric processes and affect the Baltic as a whole, a possible speculative mechanism for explaining this 1970s shift in annual amplitudes is the 1970s synchronisation event and corresponding climate regime shift (Swanson and Tsonis, Citation2009). A simple correlation analysis does not find a statistically significant correlation between temporal changes in the annual amplitude and the state of the NAO, suggesting additional seasonal forcings such as snow cover or temperature, although these forcings may also be partially related to the NAO (Tsimplis et al., 2006). According to Hünicke and Zorita (Citation2008) wind forcing alone cannot explain the amplitude of annual cycles and trends detected. The contribution from temperature and precipitation must be taken into account if one aims to model the inter-annual variability with accuracy. The temporal structure of changes in sea level seasonality in the Baltic Sea and possible physical mechanisms deserve further investigation.
The correlation between MSL and NAO in the wavelet domain is spatially coherent, with negligible correlations for the stations in the Baltic entrance and significant correlations, increasing with scale, for the remaining stations. These results are consistent with the findings of Hünicke and Zorita (Citation2008) that the NAO exerts a strong influence on winter sea level variability in the central and northern tide gauge stations, with a much weaker influence in the southern Baltic Sea. For the tide gauge stations at the central and northern Baltic Sea stations the wavelet correlation results show a statistically significant negative correlation between MSL and NAO on short time-scales, and a significant positive correlation on long time-scales. On short time-scales atmospheric effects on sea level are mainly via a direct (inverse barometer) pressure forcing. In terms of long-term variability the link between MSL and the atmosphere is mainly via wind forcing and therefore positively correlated with the state of the NAO.
In terms of long-term variability the link between MSL and the NAO is relatively straightforward to explain ( and ). Thus, high values of correlation between MSL and NAO (0.6 <R<0.8) for the lower frequency class (64–128 months) observed in many stations around the Baltic Sea reflects the integrated effect of the NAO on all the three climate driven mechanisms mentioned in Section 1 (i.e. wind and pressure patterns, changes in the hydrological cycle and thermal effects). Please note first time SLP mentioned is on page 8, not Section 1, which mentions surface pressure patterns rather than sea level pressure. SLP pattern, precipitation and temperature). However, on short time-scales atmospheric effects on sea level are more difficult to disentangle and can be season dependent. In this regard the recent results by Bladé et al. (Citation2012) showing a complete reverse configuration of the NAO impact on precipitation in winter (positive) and summer (negative) over the Baltic Sea and also in wind direction appear to play a key role on the lack of NAO–MSL link at the sub-annual time-scales.
Finally, we must also acknowledge that other important modes of large scale atmospheric circulation variability might play a role at these scales. Among these other modes the Eastern Atlantic (EA) pattern and the Scandinavian (SCAN) pattern are the two most likely candidates to interact with the 3 climate-related physical mechanisms described in Section 1. This might be the case taking into account the spatial configuration of these patterns and their impact in the SLP, wind and precipitation fields over the study area as previously studied by one of us (e.g. Trigo et al., Citation2008). The authors expect to address in the future the role, if any, played by EA and SCAN in the variability of the Baltic MSL at different time-scales and to evaluate if these modes are correlated with the NAO at some time-scales but not at others.
This study examines the association between sea level variability in the Baltic Sea and the NAO over the whole 20th century. However, the impact of large-scale atmospheric circulation, as represented by the NAO index, on Baltic Sea level, is not stationary in time (Andersson, Citation2002). Stationarity is assumed here as a first approximation, further extension of the present work would relax this stationarity assumption.
Acknowledgements
This work has been supported by FCT (Ana Bastos funded by fellowship SFRH/BD/78068/2011, Susana Barbosa funded by contract under Programme Ciencia2008) and by the DAAD/FCT project ‘Temporal changes in sea level variability: from local to regional scales’ (project ID 50750929). Ricardo Trigo was partially supported by the FCT through project STORMEx FCOMP-01-0124-FEDER-019524 (PTDC/AAC-CLI/121339/2010) co-funded by FEDER through COMPETE programme.
Related Research Data
References
- Andersson H. Influence of long-term regional and large-scale atmospheric circulation on the Baltic Sea level. Tellus A. 2002; 54: 76–88. 10.3402/tellusa.v65i0.20077.
- Barbosa S. M. Silva M. E. Fernandes M. J. Wavelet analysis of the Lisbon and Gibraltar North Atlantic Oscillation winter indices. Int. J. Climatol. 2006; 26: 581–593. 10.3402/tellusa.v65i0.20077.
- Bladé, I, Liebmann, B, Fortuny, D and Oldenborgh, G. 2012. Observed and simulated impacts of the summer NAO in Europe: implications for projected drying in the Mediterranean region. Clim. Dynam. 39, 709–727. ISSN 0930-7575. 10.3402/tellusa.v65i0.20077.
- Chen, D and Omstedt, A. 2005. Climate-induced variability of sea level in Stockholm: influence of air temperature and atmospheric circulation. Adv. Atmos. Sci. 22, 655–664. ISSN 0256-1530. 10.3402/tellusa.v65i0.20077.
- Daubechies, I. 1988. Orthonormal bases of compactly supported wavelets. Comm. Pure Appl Math. 41(7), 909–996. ISSN 1097-0312. 10.3402/tellusa.v65i0.20077.
- Ekman M. Climate changes detected through the world's longest sea level series. Global Planet. Change. 1999; 21: 215–224. 10.3402/tellusa.v65i0.20077.
- Ekman, M. 2009. Åland Islands Summer Institute for Historical Geophysics, ISBN 978-952-92-5241-1.
- Ekman M. Mäkinen J. Recent postglacial rebound, gravity change and mantle flow in Fennoscandia. Geophys. J. Int. 1996; 126: 229–234. 10.3402/tellusa.v65i0.20077.
- Ekman M. Stigebrandt A. Secular change of the seasonal variation in sea level and of the pole tide in the Baltic Sea. J. Geophys. Res. 1990; 95(C4): 5379–5383. 10.3402/tellusa.v65i0.20077.
- Feldstein, S. B. 2007. The dynamics of the North Atlantic Oscillation during the summer season. Q. J. Roy. Meteorol. Soc. 133(627), 1509–1518. ISSN 1477-870X. 10.3402/tellusa.v65i0.20077.
- Folland, C. K, Knight, J, Linderholm, H. W, Fereday, D, Ineson, S. and co-authors. 2009. The summer North Atlantic Oscillation: past, present, and future. J. Clim. 22(5), 1082–1103. ISSN 0894-8755. 10.3402/tellusa.v65i0.20077.
- Gámiz-Fortis, S. R, Pozo-Vázquez, D, Esteban-Parra, M. J and Castro-Díez, Y. 2002. Spectral characteristics and predictability of the NAO assessed through singular spectral analysis. J. Geophys. Res. 107(D23), 4685. ISSN 0148-0227.10.3402/tellusa.v65i0.20077.
- Hünicke, B and Zorita, E. 2006. Influence of temperature and precipitation on decadal Baltic Sea level variations in the 20th century. Tellus A. 58(1), 141–153. ISSN 0280-6495. 10.3402/tellusa.v65i0.20077.
- Hünicke, B and Zorita, E. 2008. Trends in the amplitude of Baltic Sea level annual cycle. Tellus A. 60(1), 154–164. ISSN 0280-6495. 10.3402/tellusa.v65i0.20077.
- Jevrejeva S. Moore J. C. Woodworth P. L. Grinsted A. Influence of large-scale atmospheric circulation on European sea level: results based on the wavelet transform method. Tellus A. 2005; 57(2): 183–193. 10.3402/tellusa.v65i0.20077.
- Johansson M. Boman H. Kahma K. Launiainen J. Trends in sea level variability in the Baltic Sea. Boreal Env. Res. 2001; 6: 159–179.
- Jones, P. D, Jonsson, T and Wheeler, D. 1997. Extension to the North Atlantic Oscillation using early instrumental pressure observations from Gibraltar and south-west Iceland. Int. J. Climatol. 17(13), 1433–1450. ISSN 1097-0088.
- Lehmann A. Krauss W. Hinrichsen H. H. Effects of remote and local atmospheric forcing on circulation and upwelling in the Baltic Sea. Tellus A. 2002; 54: 299–316. 10.3402/tellusa.v65i0.20077.
- Lindsay, R, Percival, D and Rothrock, D. 1996. The discrete wavelet transform and the scale analysis of the surface properties of sea ice. IEEE Trans. Geosci. Rem. Sens. 34(3), 771–787. ISSN 0196-2892. 10.3402/tellusa.v65i0.20077.
- Omstedt A. Peterssen C. Rohde J. Winsor P. Baltic Sea climate: 200 yr of data on air temperature, sea level variation, ice cover, and atmospheric circulation. Clim. Res. 2004; 25: 205–216. 10.3402/tellusa.v65i0.20077.
- Peltier, W. 2004. Global glacial isostasy and the surface of the ice-age earth: the ice-5G (VM2) model and grace. Annu. Rev. Earth Planet. Sci. 32, 111–149. ISSN 0084-6597. DOI: 10.3402/tellusa.v65i0.20077.
- Percival, D. B. 2008. Analysis of Geophysical Time Series using Discrete Wavelet Transforms: An Overview. Volume 112 of Lecture Notes in Earth Sciences. Springer: Berlin/Heidelberg, pp. 61–79.
- Percival D. B. Mojfeld H. Analysis of subtidal coastal sea level fluctuations using wavelets. J. Am. Stat. Assoc. 1997; 92: 868–880. 10.3402/tellusa.v65i0.20077.
- Percival, D. B and Walden, A. T. 2006. Wavelet Methods for Time Series Analysis (Cambridge Series in Statistical and Probabilistic Mathematics). Cambridge University Press. ISBN 0521685087. Online at: http://www.worldcat.org/isbn/0521685087.
- Plag H. P. Tsimplis M. N. Temporal variability of the seasonal sea level cycle in the North Sea and Baltic Sea in relation to climate variability. Global Planet. Change. 1999; 20: 173–203. 10.3402/tellusa.v65i0.20077.
- Pozo-Vázquez, D, Esteban-Parra, M, Rodrigo, F and Castro-Díez, Y. 2000. An analysis of the variability of the North Atlantic Oscillation in the time and the frequency domains. Int. J. Clim. 20(14), 1675–1692. ISSN 1097-0088.
- Samuelsson M. Stigebrandt A. Main characteristics of the long-term sea level variability in the Baltic Sea. Tellus A. 1996; 48(5): 672–683. 10.3402/tellusa.v65i0.20077.
- Swanson, K. L and Tsonis, A. A. 2009. Has the climate recently shifted?. Geophys. Res. Lett. 36, L06711. 10.3402/tellusa.v65i0.20077.
- Torrence C. Compo G. P. A practical guide to wavelet analysis. Bull. Am. Meteorol. Soc. 1998; 79: 61–78.
- Trigo, I. 2006. Climatology and interannual variability of storm-tracks in the Euro-Atlantic sector: a comparison between ERA-40 and NCEP/NCAR reanalyses. 26(2–3), 127–143. 10.3402/tellusa.v65i0.20077. Online at: http://dx.doi.org/10.1007/s00382-005-0065-9.
- Trigo, R. M, Pozo-Vázquez, D, Osborn, T. J, Castro-Díez, Y, Gámiz-Fortis, S. and co-authors. 2004. North Atlantic Oscillation influence on precipitation, river flow and water resources in the Iberian Peninsula. Int. J. Climatol. 24(8), 925–944. ISSN 1097-0088. 10.3402/tellusa.v65i0.20077.
- Trigo, R. M, Valente, M. A, Trigo, I. F, Miranda, P. M. A, Ramos, A. M. and co-authors. 2008. The impact of North Atlantic wind and cyclone trends on European precipitation and significant wave height in the Atlantic. Ann. New York Acad. Sci. 1146, 212–234. DOI: 10.3402/tellusa.v65i0.20077.
- Tsimplis M. Shaw A. Flather R. Woolf D. The influence of the North Atlantic Oscillation on the sea level around the northern European coasts reconsidered: the thermosteric effects. Phil. Trans. R. Soc. A. 2006; 364(1841): 845–856. 10.3402/tellusa.v65i0.20077.
- Tsimplis, M. N and Josey, S. A. 2001. Forcing of the Mediterranean Sea by atmospheric oscillations over the North Atlantic. Geophys. Res. Lett. 28(5), 803–806. 10.3402/tellusa.v65i0.20077.
- Vermeer, M and Rahmstorf, S. 2009. Global sea level linked to global temperature. Proc. Natl. Acad. Sci. 106(51), 21527–21532. 10.3402/tellusa.v65i0.20077.
- Woodworth P. L. Player R. The permanent service for mean sea level: an update to the 21st century. J. Coast. Res. 2003; 19: 287–295.
- Woolf, D. K, Shaw, A. G. P and Tsimplis, M. N. 2003. The influence of the North Atlantic Oscillation on sea-level variability in the North Atlantic region. J. Atmos. Ocean Sci. 9(4), 145–167. 10.3402/tellusa.v65i0.20077.
- Yan, Z, Tsimplis, M. N and Woolf, D. 2004. Analysis of the relationship between the North Atlantic Oscillation and sea-level changes in northwest Europe. Int. J. Climatol. 24(6), 743–758. ISSN 1097-0088. 10.3402/tellusa.v65i0.20077.