Abstract
The tropical region is an area of maximum humidity and serves as the major humidity source of the globe. Among other phenomena, it is governed by the so-called Inter-Tropical Convergence Zone (ITCZ) which is commonly defined by converging low-level winds or enhanced precipitation. Given its importance as a humidity source, we investigate the humidity fields in the tropics in different reanalysis data sets, deduce the climatology and variability and assess the relationship to the ITCZ. Therefore, a new analysis method of the specific humidity distribution is introduced which allows detecting the location of the humidity maximum, the strength and the meridional extent. The results show that the humidity maximum in boreal summer is strongly shifted northward over the warm pool/Asia Monsoon area and the Gulf of Mexico. These shifts go along with a peak in the strength in both areas; however, the extent shrinks over the warm pool/Asia Monsoon area, whereas it is wider over the Gulf of Mexico. In winter, such connections between location, strength and extent are not found. Still, a peak in strength is again identified over the Gulf of Mexico in boreal winter. The variability of the three characteristics is dominated by inter-annual signals in both seasons. The results using ERA-interim data suggest a positive trend in the Gulf of Mexico/Atlantic region from 1979 to 2010, showing an increased northward shift in the recent years. Although the trend is only weakly confirmed by the results using MERRA reanalysis data, it is in phase with a trend in hurricane activity – a possible hint of the importance of the new method on hurricanes. Furthermore, the position of the maximum humidity coincides with one of the ITCZ in most areas. One exception is the western and central Pacific, where the area is dominated by the double ITCZ in boreal winter. Nevertheless, the new method enables us to gain more insight into the humidity distribution, its variability and the relationship to ITCZ characteristics.
1. Introduction
Atmospheric humidity is an important quantity of the atmosphere, especially of the lower troposphere. Humidity is given by the amount of water vapour per amount of air and is determined by evaporation, advection and precipitation (e.g. Bengtsson, Citation2010). The distribution and the transport of humidity within the atmosphere are important for the hydrological cycle and the global radiation energy budget (e.g. Ruckstuhl et al., Citation2007). While evaporation, condensation (cloud formation) and precipitation are essential parts of the hydrological cycle, water vapour behaves as a greenhouse gas and modulates the radiative transfer within large parts of the atmosphere via direct (absorption, emission and reflection) and indirect (cloud cover and convective heating) effects (e.g. Sherwood, Citation2010). The modulation of radiative transfer itself is back-coupled to evaporation, condensation and precipitation, which suggests an interaction (equilibrium) of the hydrological cycle and the radiation energy budget. As an example, Holloway and Neelin (Citation2009) showed a positive relationship between lower-tropospheric humidity and tropical deep convection, the latter which is related to radiative heating (cooling) at the surface (top) (e.g. Fu et al., Citation1995). Consistently, Bengtsson (Citation2010) argued that ‘there is widespread evaporation (maximum some 2 m per year) on each side of the inter-tropical convergence zone (ITCZ), transporting water vapor into the ITCZ […]’, a first hint at the relation between tropical deep convection in the ITCZ and lower-tropospheric humidity.
The ITCZ itself is an important feature of the tropical atmosphere. It is generated by the converging trade winds of the Northern and Southern Hemispheres building up an area of high convective activity encircling the earth near the equator (Holton, Citation1992) and is known to interact with other phenomena like the monsoon circulation (Sultan and Janicot, Citation2000; Maloney and Shaman, Citation2008; Allen and Armstrong, Citation2012) and El Niño Southern Oscillation (Bain et al., Citation2010). To determine the ITCZ, several methods were developed ranging from: detecting the location of maximum precipitation above a certain threshold (e.g. Zhang, Citation2001), using visible and infrared satellite observations of high reflective cloud cover (HRC) (e.g. Waliser and Gautier, Citation1993), estimating the convergence of wind fields (e.g. Zheng et al., Citation1997; Zagar et al., Citation2011), assessing the relative vorticity structures (e.g. Magnusdottir and Wang, Citation2008) or multiple variable criteria (e.g. Bain et al., Citation2010). Despite this wealth of different methods, some deficiencies in representing the ITCZ are mentioned in the literature. In particular over the continents, where the trade winds are not well developed, some methods fail to detect the ITCZ (Nicholson, Citation2009). Besides, cloud clusters are induced by westward propagating wave disturbances (Chang, Citation1970; Reed, Citation1970) and form locally (Holton et al., Citation1971) which could impact a proper definition of the ITCZ based on precipitation (Nicholson, Citation2009). Due to the mentioned problems, most of the studies only present zonally averaged ITCZ locations for defined regions.
Although humidity is a key quantity of the atmosphere, there are still discrepancies between different reanalysis products. Uppala et al. (Citation2005) reported that in the widely used ERA-40 data set, the humidity fields are affected by difficulties with the assimilation of humidity information and the poorly represented global transport of moisture in the atmosphere. In the recently released successor, the ERA-interim data set, improvements were made by, for example employing a four-dimensional variation method in the data assimilation scheme (Chuang et al., Citation2010; Simmons et al., Citation2010; Dee et al., Citation2011). Still, whether or not these discrepancies have a significant impact on the humidity distribution and its variability in the tropics remains unclear.
Thus, this study aims at investigating the specific humidity field in the tropics, its relation to the ITCZ and the impact of deviations between different reanalysis products on these findings. Therefore, a new method is introduced to deduce characteristics of the meridional distribution of specific humidity. The method yields three parameters of the humidity distribution – location, amplitude and width, which are generated for each longitude. The dependency on longitude enables additional regional insights of the humidity distribution and its potential relations to regional ITCZ's characteristics.
This study is structured as follows. In Section 2, the data set and the post-processing of the data is introduced. Then, the new method detecting the meridional maximum of specific humidity is presented in Section 3 including robustness tests with respect to the resolution of the input data and differences between different reanalysis data sets. In Section 4, the climatology, the variability of the humidity distribution characteristics and potential connections to the ITCZ are presented. Finally, the results are discussed and conclusive remarks are given in Section 5.
2. Data and processing
In this study, we use two reanalyses of the European Center for Medium-Range Weather Forecasts (ECMWF): the ERA-40 data set (Uppala et al., Citation2005) and the ERA-interim data set (Dee et al., Citation2011). The ERA-40 data set is generated with the medium-range forecasting system of the ECMWF in a horizontal resolution of T159 (approximately 1°×1°) and 60 vertical levels. This reanalysis is available from September 1957 to June 2002. The newer reanalysis ERA-interim is produced with an updated version of the model on a horizontal resolution of T255 (roughly 79 km) with 60 vertical levels and covers the period 1979–2010. The important new step of this reanalysis product is that a four-dimensional variation method is applied as data assimilation scheme. Both data sets are compared within the overlapping period from 1979 to 2002 to test the robustness of the results. Furthermore, MERRA reanalysis data (Bosilovich et al., Citation2011) is used as an independent data set to test parts of our results.
The data sets are commonly used on different resolutions, for example T21, T31, T63, T106, T159 and T255. To investigate the role of reanalysis horizontal resolution, the data are interpolated to a triangular truncated spectral grid (i.e. T239) and truncated to coarser resolutions, that is T213, T159, T106, T85, T63, T42, T31 and T21. The truncated fields are then back-transformed to the Gaussian grids N180, N160, N120, N80, N64, N48, N32, N24 and N16 and further bilinearly interpolated to the corresponding regular grid to apply the new method.
Before presenting the method to assess the humidity distribution, the two reanalysis data sets are briefly compared for the overlapping time period 1979–2002. Therefore, we use averaged relative differences, defined as
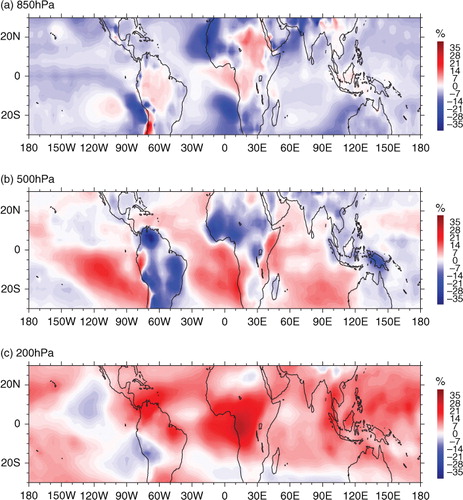
where X refers to the variable of interest. As the new method is based on specific humidity Q we show ε Q based on the period 1979–2002 for three different levels: 850, 500 and 200 hPa (). Relative differences are found in all three levels with largest amplitudes mostly over the continents (). At 850 hPa, a pattern is evident over northern Africa with a maximum amplitude of approximately 20–30% (a). At 500 hPa, deviations over South America, the Sahel zone, the Himalayas and over Papua New Guinea with a similar amplitude are found. ERA-40 overestimated specific humidity Q at those areas by up to 30% relative to ERA-interim (1b). In contrast, ERA-40 underestimates the specific humidity content in the upper atmosphere (e.g. 200 hPa) by 20–30% in some regions. The difference pattern extends more to central Africa, into the equatorial east Atlantic, and over Central America to northern South America elongated into the western part of the Atlantic (c). The deviations could be partly assigned to the higher horizontal resolution of ERA-interim and, as Dee et al. (Citation2011) reported, its improved representation of the hydrological cycle. The deviations in specific humidity Q are substantial and thus, we will strictly distinguish the two reanalysis data sets.
Fig. 1 Mean relative differences (i.e. ERA-interim minus ERA-40 relative to ERA-interim) for specific humidity Q in the tropics (±30°) at (a) 850 hPa, (b) 500 hPa, and (c) 200 hPa for the period January 1979 to August 2002.
3. Estimation of humidity maximum
In this section, we first introduce the method to derive characteristic humidity parameters. Then, we test the robustness of the method with respect to the resolution of the input data and compare the two reanalysis data sets in the overlapping period from 1979 to 2002.
The new method is based on monthly means of specific humidity averaged over the lower free troposphere excluding the boundary layer to reduce orography effects, that is 850, 775, 700, 600 and 500 hPa equally weighted. Furthermore, it is applied on single levels to investigate vertical structures. The humidity distribution parameters are estimated by fitting a Gaussian function1
to the meridional humidity field at each longitude. Note that φ
max refers to the meridional location of the specific humidity maximum at a certain longitude, Q
max to the maximum value and to the meridional variance of specific humidity.
To fit the Gaussian function, the data are transformed, that is we take the logarithm of eq. (1), which is justified as specific humidity is a positive quantity. The transformation reduces the problem to fit a parabola and leads to a linearised form (linear in the parameters), namely2
which is quadratic in φ and can be written as3
where a, b and c represent the unknown parameters. For fitting, we apply least squares for each longitude (Wilks, Citation2006). To restrict the meridional location of the humidity maximum to a certain extent around the equator, a weighting is applied to the data of specific humidity Q and to each equation of the linear equation system of the parabolic regression according to4
where P i,i are the diagonal elements of the weighting matrix P. The parameters 0≤k<1 and p=1, 2, … determine how strong the weighting decreases with latitude φ i , with i denoting the index of the latitude vector. The two weighting parameters introduce a possibility to tune the method. Furthermore, the described weighting decreases the contribution of the points far away from the maximum and reduces problems arising from potential secondary maxima in higher latitudes.
Once the linearised parameters are estimated, the back-transformed parameters are given by5
6
7
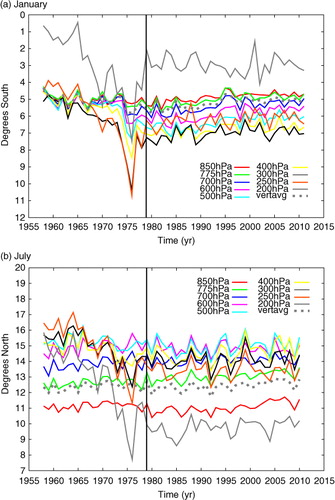
The application on single pressure levels is intended to reveal vertical structures. For this purpose, the used range is extended by adding the levels 400, 300, 250 and 200 hPa. A vertical dependency is found for both seasons. shows that the specific humidity maximum in boreal summer (July) moves northward with height from around 11°N at 850 hPa to roughly 15°N at 500 hPa and then again moves equatorward with height to around 10°N at 200 hPa. During winter (January), a similar structure with opposite curvature is observed for the southern hemisphere. The specific humidity maximum moves southward with height from around 5°S at 850 hPa to around 7°S at 300 hPa and then moves equatorward again for higher levels. However, the meridional extent of the structure in winter (January) is somewhat more confined than in summer. Note that only ERA-interim results are interpreted as ERA-40 shows unreliable variability especially in the upper levels – systematic changes between the two data sets are evident.
Fig. 2 Zonal mean meridional maximum location of specific humidity for single pressure levels in (a) January and (b) July. The dashed line indicates the estimated locations using the vertically averaged humidity fields including all shown levels. The transition from ERA-40 to ERA-interim reanalysis data is marked by the solid vertical line in 1979.
To test the dependence on the weighting, sensitivity experiments using k=0.95, 0.80, 0.50, 0.00 are performed. shows that the zonal mean maximum location (indicated by circumflexes at the top) is significantly depending on the weighting factor k during boreal summer (i.e. July), where the maximum moves far north from the equator. In contrast, during boreal winter (i.e. January) the zonal mean maximum location is only slightly affected. Furthermore, the weighting equally shifts the estimates of the mean maximum location towards the equator at each longitude (not shown). To match the mean specific humidity maximum well, k=0.95 turned out to be appropriate. Thus, further results are presented for the weighting factor k=0.95.
Fig. 3 Zonal mean distribution of observed specific humidity (weighted using k=0.95), the estimated Gaussian fit and the zonal mean precipitation represented by ERA-interim reanalysis data over the time period from 1979 to 2010 for January and July. The circumflexes denote the estimated Gaussian maxima for the weighting factor k=0.95, 0.80, 0.50, 0.00 for January (blueish) and July (reddish); colours are chosen from dark (k=0.95) to light (k=0.00), where the latter equals no weighting.
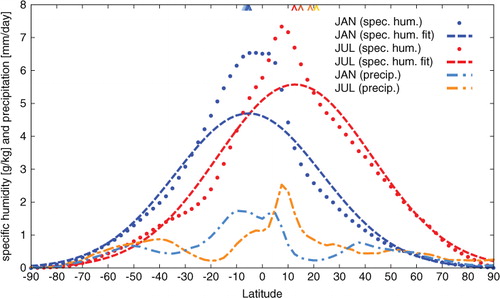
In addition, illustrates the weighted zonal mean distribution of specific humidity and the corresponding Gaussian fits for January and July, where the humidity maximum reaches the southern- and northernmost location in these months, respectively. The Gaussian fit represents the distribution well. However, the amplitude is underestimated and despite the applied weighting the maximum locations are somewhat poleward deviated. Nevertheless, the relative changes of the amplitude and maximum location from one month to another (i.e. from January to July) are captured.
To test the robustness of the new method, we apply it to fields with different grid resolutions. Thus, ERA-interim data of monthly mean specific humidity Q from January, 1979 to August 2002 in 0.5°×0.5° resolution are vertically averaged using the pressure levels 850, 775, 700, 600 and 500 hPa. The mean differences of the zonal-averaged maximum location and the mean location for the Atlantic region (10°W–60°W) relative to the highest resolution are presented in . In the zonal mean, the humidity maximum is slightly shifted southward for the months of July and August (roughly−0.08°), when reducing the resolution of the input data, whereas for June and September the humidity maximum location deviations are small. On the contrary, all other months show a northward displacement with a maximum in April of around 0.16°.
Fig. 4 Mean deviations of (a) zonal mean and (b) Atlantic (10°W to 60°W) specific humidity maximum location relative to T239 resolution for ERA-interim data from January 1979 to December 2010. To scale the x-axis, the number of meridional grid points is used. For January and July, one standard deviation of the error relative to T239 is indicated by the error bars.
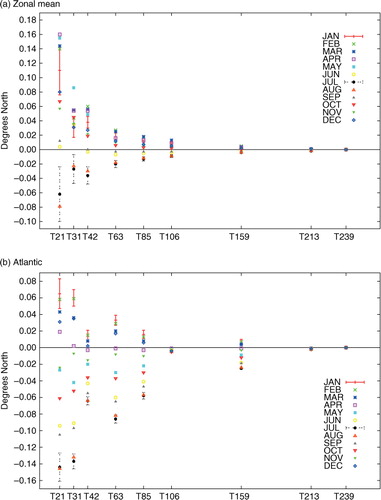
This analysis is repeated for the Atlantic region from 10°W to 60°W to test whether the humidity maximum location is sensitive to the resolution with respect to specific longitudes. We find that in the Atlantic the meridional location of the humidity maximum is stronger southward displaced than for the zonal mean (b). Still, this displacement is limited to a maximum deviation smaller than −0.15° for the most coarse resolution T21.
In both cases (Atlantic and zonal mean) the deviations are larger in boreal summer and winter, where the specific humidity maximum reaches the most northern (southern) latitudes, respectively. However, the results show that the impact of horizontal resolution on the location of the maximum is small, but leads to an insignificant underestimation of its seasonal cycle with respect to coarser resolutions.
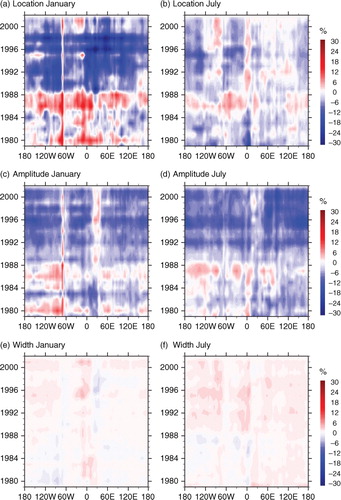
In addition, the new method is applied to ERA-40 and ERA-interim data separately, because of their discrepancies in specific humidity (as illustrated in ). The seasonal cycle of the zonal mean maximum location deduced from ERA-40 resembles one of the ERA-interims (not shown). There are, however, some rather small discrepancies, in particular for the maxima and minima of the seasonal cycle. ERA-40 shows a slight tendency to overestimate the maximum location in January and July compared to ERA-interim. The zonal mean deviations (i.e. ERA-40 minus ERA-interim) of the location estimates for July, August and September are 0.28°N, 0.06°N and −0.12°N and −0.28°N, −0.25°N and −0.06°N for December, January and February, respectively. In a–f, the relative differences for the location, the amplitude and the width estimates are shown. In a, c, d and f, a shift around 1989 is detected, whereas in e and b no obvious shift is identified. The abrupt changes are suspected to be a consequence of the improvements made from ERA-40 to ERA-interim concerning the hydrological cycle (Dee et al., Citation2011). However, shows that the relative difference of the estimates for ERA-40 and ERA-interim data is evidently larger in boreal winter (i.e. January) than during boreal summer (i.e. July). This could be a consequence of the meridional oscillation asymmetry, namely the fact that the specific humidity maximum during boreal summer reaches its northernmost zonal mean location at around 12°N, while in boreal winter the most southern zonal mean location is reached at around 6°S. Consequently, the same absolute difference in specific humidity between ERA-40 and ERA-interim will have a larger effect on the relative difference of the location estimate during boreal winter. However, shows that the relative difference is small for the width estimate compared to one of the maximum locations and the amplitudes.
Fig. 5 Hovmoeller diagrams of the relative differences (i.e. ERA-interim minus ERA-40 relative to ERA-interim) of the location, amplitude, and width estimates according to the introduced method using specific humidity in (a), (c), and (e) for January, (b), (d), and (f) for July.
In summary, we conclude that the method is robust with respect to the horizontal resolution of the input data and is applicable to single levels, but combining the two data sets is not permitted. To investigate the climatology and trends of specific humidity, ERA-interim data from January 1979 to December 2010 in 2.5°×2.5° resolution are used only due to uncertainties in ERA-40 data.
4. Climatology, trends and the relation to the ITCZ
In this section, we present the shape, the inter-annual variability and potential trends of the specific humidity distribution based on the new method introduced in Section 3. The focus is set to boreal winter and summer illustrated by the months January and July, respectively.
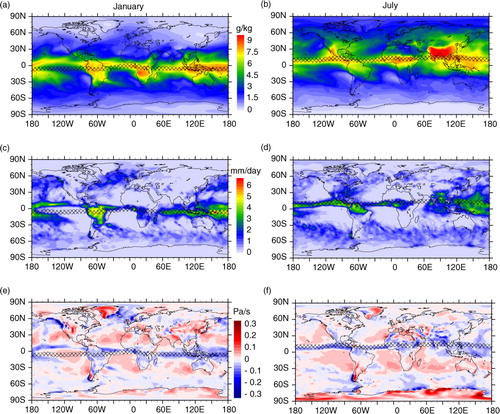
The mean maximum location estimated using the vertically averaged specific humidity field from 1979 to 2010 during January and July (ERA-interim) is given in . In January, the maximum is located at around 5°S, while in July it is northward displaced to around 12°N. The estimated width span roughly a band of ±30°. In winter, the detection of the humidity maximum is more difficult due to the double structure of the distribution over the Pacific Ocean resembling the double ITCZ structure (Zhang, Citation2001; Gu et al., Citation2005; Kumar et al., Citation2011). To illustrate this problem, the fields of (a) specific humidity, (c) daily precipitation and (e) the vertical wind component are shown in for January 1990 as an example. The new method allows for one maximum only, therefore the position of the maximum is not properly estimated in the area 160–120 °W. A weaker double structure is also found in the south-western Atlantic (Grodsky and Carton, Citation2003), which slightly shifts the maximum southward. It is important to note that such signatures influence the estimates of width, location and amplitude of the specific humidity distribution according to the method introduced in Section 3. Thus, results in winter and early spring (not shown) have to be interpreted with caution in these areas. In summer, the fields of specific humidity, daily precipitation and the vertical wind component are consistent with the estimated maximum (b, d, f). Additionally, selecting other years using ERA-interim exhibits similar results (not shown).
Fig. 6 Estimated mean location during January (blue) and July (red) estimated using ERA-interim reanalysis data from 1979 to 2010. The shaded areas indicate the width of the according Gaussian fit.
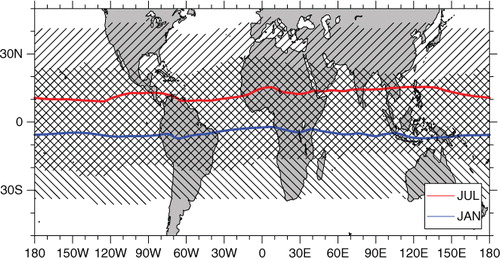
Fig. 7 Monthly means of specific humidity (a, b), daily precipitation (c, d) and vertical wind component (e, f) for January and July 1990, respectively. The stippled area indicates the 99% threshold of the estimated Gaussian distribution maximum.
Another important aspect of the analysis is that the estimated location of the specific humidity maximum resembles in most parts common definitions of the ITCZ, that is precipitation maximum (). In contrast to the existing ITCZ detection methods, like wind-based methods (Zheng et al., Citation1997; Zagar et al., Citation2011), the new method identifies a maximum in specific humidity at each longitude consistent with the observed precipitation maximum and updraft in most cases (). However, the method misses the observed maximum of specific humidity at a longitude from roughly 70°E to 120°E (b) and estimates a southerly shifted maximum location. This shortcoming results from the steep decrease of the humidity distribution in the north and the accompanying distinctive asymmetry as the decrease to the south is shallower. In this case, the capability of the Gaussian function to match the shape of the meridional humidity distribution is reduced and thus leads to a deviation from the observed specific humidity maximum. In contrast, the assumption of a Gaussian function does perform well for most cases, that is the mean picture (). As described in Section 1, the ITCZ is commonly defined by maximum precipitation (e.g. Zhang, Citation2001) or the convergence of winds (e.g. Zheng et al., Citation1997; Zagar et al., Citation2011), which latter is related to vertical motion. Thus, outside of regions suffering from the double structure, it is justified to relate the estimated specific humidity maximum to the convergence of winds, the related updraft, and the area of maximum precipitation. Consequently, the application of the new method on specific humidity shows potential to derive the meridional location of the ITCZ in these regions.
Furthermore, we present the long-term mean and the corresponding deviations of all three parameters for both seasons to assess the variability and potential trends of the specific humidity distribution ().The long-term means show that the most southerly position of the maximum is over the warm pool area and the area western Pacific/South America in winter (January), whereas it is nearly at the equator over the Atlantic and Africa (−3°N; a; top panel). In summer (July), again the maximum is shifted northward over the warm pool and Indian Ocean area due to the Asia Monsoon system (b; top panel). Another northward shift is found over western Pacific/Central America. Additionally, the maximum is also strongly northward displaced over West Africa due to the West African Monsoon. These stronger southward (January) and northward (July) shifts go along with peaks in the amplitude (c, d; top panels), in particular over the Amazon area in January and the warm pool area in summer. Interestingly, the northward shift over West Africa is not accompanied by a distinct maximum of specific humidity, whereas the northward position over the Gulf of Mexico region coincide with a maximum of specific humidity. The missing coincidence over West Africa could have its origin in the dry Saharan Air Layer (SAL) affecting the vertical extent of humidity and lead to a lower mean humidity content in this particular region. Keep in mind that we vertically average over the levels 850, 775, 700, 600 and 500 hPa which matches the height of the SAL (e.g. Prospero and Carlson, Citation1972; Diaz et al., Citation1976; Lothon et al., Citation2008). The long-term mean of the width is more difficult to interpret (e, f; top panels). In the winter (January) the method suffers from the double structure. Accordingly, two maxima of width are found over the Pacific and the Atlantic. In summer (July), the width is increased over the central Pacific, the Gulf of Mexico and West Africa, whereas the specific humidity distribution has a more narrow shape over the warm pool region. However, all three characteristics of the specific humidity distribution bear insights of the longitudinal and meridional behaviour and potential relationship to other phenomena, for example the Monsoon systems.
Fig. 8 Long-term mean (top of panel) and Hovmoeller diagrams of deviations (bottom of panel) for January (left) and July (right): (a, b) meridional location, (c, d) amplitude, and (e, f) width estimates using ERA-interim specific humidity Q from 1979 to 2010.
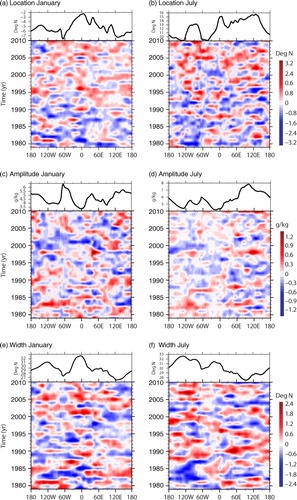
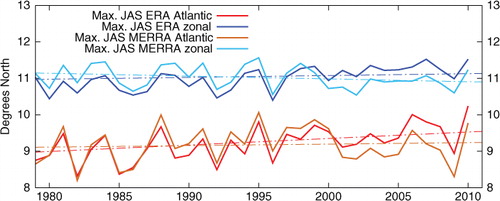
To investigate the variability, the corresponding Hovmoeller diagrams of the deviations from the long-term mean are presented. The variability of location is longitudinally dependent in both seasons (a, b), that is the ocean basins and continents behave differently. After 1979, a slight trend towards a more northward displaced specific humidity maximum in the Atlantic and West Africa appears, whereas the warm pool area and the Pacific seem to be dominated by inter-annual variability. The trend of the maximum location over the Atlantic and the Gulf of Mexico is more evident in July than in January. Again, the warm pool is dominated by inter-annual variability, while the position of the maximum over West Africa shows decadal-scale variations. Thus, in both seasons the two characteristics are dominated by inter-annual variability and no trends are identified, except a widening of the specific humidity distribution in July over the western Pacific. To support the aforementioned trend in the Atlantic region, MERRA reanalysis data are used as a comparison. In , the trends for ERA-interim and MERRA data of the zonal mean and the Atlantic signal during July–August–September (JAS) are shown. As discussed, ERA-interim exhibits a distinctive trend in the Atlantic region of roughly 0.5° in 30 yr. This trend is only weakly supported by the MERRA reanalysis, where the amplitude of the same trend is limited to 0.1° in 30 yr. The zonal mean signal derived by ERA-interim data shows an insignificant trend to a slightly northerly displaced maximum location whereas MERRA data implies a slight trend to a southerly located specific humidity maximum. Although the two reanalyses provide slightly different results regarding trends, their signals (Atlantic and zonal mean) are highly correlated (). However, the mentioned Atlantic trend to a more northerly displaced specific humidity maximum remains uncertain.
Fig. 9 Estimated zonal and Atlantic (10°W to 60°W) maximum location (solid) and trends (dash-dotted) for vertically averaged (850, 775, 700, 600, and 500 hPa) ERA-interim (blue; red) and MERRA (cyan; orange) specific humidity field in JAS.
5. Summary and conclusions
In this study, we assessed specific humidity fields of two different reanalysis products with emphasis on the tropics. Therefore, we introduced a new method to detect the maximum of specific humidity which further enables the estimation of additional characteristics.
The comparison of both reanalysis data sets shows strong discrepancies in the tropical humidity field, which affects the location of the specific humidity maximum as well as the strength and the meridional extent. In particular in the year 1989 the ERA-40 data show a strong change in all three characteristics and both seasons, which is attributed to changes in the assimilation scheme as well as assimilated data (Uppala et al., Citation2005). Additionally, the variability and the mean prior to 1979 in the ERA-40 data is different to ERA-interim, as illustrated by the zonal mean meridional maximum location on single pressure levels. Thus, we conclude that both data sets cannot be merged and trends and variability need to be interpreted for ERA-interim only.
However, the application of the new method using different horizontal resolutions exhibits its robustness on the resolution of the input data. Furthermore, the method is applied to single pressure levels and bears insights in the vertical dependency of the specific humidity maximum. It is found that from bottom (850 hPa) to top (200 hPa), the maximum location undergoes a curvature with height from around 11°N up to roughly 15°N and then back to 10°N during boreal summer. During boreal winter, a similar structure with opposite curvature south of the Equator from roughly 5°S to around 7°S and back to 3°S is found. The obtained structure could be interpreted as an imprint of the Hadley cell.
Finally, the new method shows potential to investigate the vertical dependency of the specific humidity distribution. Furthermore, we conclude that the estimates of specific humidity maximum location are consistent with other parameters commonly used to define the ITCZ, for example precipitation maximum and vertical motion. In contrast to other methods, the use of specific humidity is shown to be applicable to each longitude rather than zonal mean strips and thus reveals local characteristics with respect to longitude. Furthermore, the distribution of specific humidity is shown to be approximately normally distributed over latitude and benefits from the distribution smoothness of specific humidity compared to precipitation or vertical motion used by other methods. As a consequence, the new method has potential to gain insights with higher temporal and/or higher spatial resolution. Although, the method has some shortcomings to represent distribution asymmetries and double maxima, it matches the mean meridional specific humidity distribution well.
However, the new method yields additional insights in spatial and temporal features of the tropical specific humidity distribution. The analysis of the three characteristics using ERA-interim data indicates that there is a trend to a more northward displaced specific humidity maximum and an accordingly enhanced atmospheric humidity content over the tropical Atlantic and the Gulf region during boreal summer. Although the trend is only weakly confirmed by the results using MERRA reanalysis data, it is in phase with a trend in hurricane activity – a possible hint of the importance of the new method on hurricanes.
Acknowledgements
This work was supported by the Sinergia Project FUPSOL funded by the Swiss National Science Foundation. ERA-40 and ERA-interim data used in this study have been provided by European Centre for Medium-Range Weather Forecasts (ECMWF; more information is available online at http://data.ecmwf.int/data/index.html). Furthermore, MERRA data are provided by Modelling and Assimilation Data and Information Services Center (MDISC) of the National Aeronautics and Space Administration (NASA). For the interpolation from regular to spectral grid, the truncation, the back-transformation, and the bi-linear remapping the functions gp2sp, sp2sp, sp2gp, and remapbil of the tool CDO (version 1.5.0) are used (https://code.zmaw.de/projects/cdo from the Max-Plank-Institute of Meteorology, Hamburg, Germany).
Related Research Data
References
- Allen M. B , Armstrong H. A . Reconciling the intertropical convergence zone, Himalayan/Tibetan tectonics, and the onset of the Asian monsoon system. J. Asian Earth Sci. 2012; 44: 36–47.
- Bain C. L , De Paz J , Kramer J , Magnusdottir G , Smyth P , co-authors . Detecting the ITCZ in instantaneous satellite data using spatiotemporal statistical modeling: ITCZ climatology in the East Pacific. J. Clim. 2010; 24(1): 216–230.
- Bengtsson L . The global atmospheric water cycle. Environ. Res. Lett. 2010; 5(2): D025001. DOI: 10.10881/1748-9326/5/2/025001.
- Bosilovich M. G , Robertson F. R , Chen J . Global energy and water budgets in MERRA. J. Clim. 2011; 24(22): 5721–5739.
- Chang C.-P . Westward propagating cloud patterns in the tropical Pacific as seen from time-composite satellite photographics. J. Atmos. Sci. 1970; 27: 313–322.
- Chuang H , Huang X , Minschwaner K . Interannual variations of tropical upper tropospheric humidity and tropical rainy-region SST: comparisons between models, reanalyses, and observations. J. Geophys. Res. 2010; 115(D21): D21125.
- Dee D. P , Uppala S. M , Simmons A. J , Berrisford P , Poli P , co-authors . The ERA-interim reanalysis: configuration and performance of the data assimilation system. Q. J. Roy. Meteorol. Soc. 2011; 136: 1972–1990.
- Diaz H. F , Carlson T. N , Prospero J. M . A study of the structure and dynamics of the Saharan air layer over the northern equatorial Atlantic during BOMEX. Weather Modif. Program Office. 1976; 32: 61.
- Fu Q , Krueger S. K , Liou K. N . Interactions of radiation and convection in simulated tropical cloud clusters. J. Atmos. Sci. 1995; 52(9): 1310–1328.
- Grodsky S. A , Carton J. A . The intertropical convergence zone in the South Atlantic and the equatorial cold tongue. J. Clim. 2003; 16(4): 723–733.
- Gu G , Adler R. F , Sobel A. H . The Eastern Pacific ITCZ during the boreal spring. J. Atmos. Sci. 2005; 62(4): 1157–1174.
- Holloway C. E , Neelin J. D . Moisture vertical structure, column water vapor, and tropical deep Convection. J. Atmos. Sci. 2009; 66(6): 1665–1683.
- Holton J. R . An Introduction to Dynamic Meteorology. 1992; San Diego: International Geophysics Series Academic Press.
- Holton J. R , Wallace J. M , Young J. A . On boundary layer dynamics and the ITCZ. J. Atmos. Sci. 1971; 28(2): 275–280.
- Kumar M. R. R , Devasthale A , Levy G , Sankar S , Bakan S , co-authors . A multi-sensor climatological view of double ITCZs over the Indian Ocean. Int. J. Remote Sens. 2011; 33(9): 2925–2936.
- Lothon M , Sad F , Lohou F , Campistron B . Observation of the diurnal cycle in the low troposphere of West Africa. Mon. Weather Rev. 2008; 136(9): 3477–3500.
- Magnusdottir G , Wang C.-C . Intertropical convergence zones during the active season in daily data. J. Atmos. Sci. 2008; 65(7): 2425–2436.
- Maloney E. D , Shaman J . Intraseasonal variability of the West African monsoon and Atlantic ITCZ. J. Clim. 2008; 21(12): 2898–2918.
- Nicholson S. E . A revised picture of the structure of the “monsoon” and land ITCZ over West Africa. Clim. Dynam. 2009; 32: 1155–1171.
- Prospero J. M , Carlson T. N . Vertical and areal distribution of Saharan dust over the western equatorial North Atlantic Ocean. J. Geophys. Res. 1972; 77(27): 5255–5265.
- Reed R . Structure and characteristics of easterly waves in the equatorial western Pacific during July–August 1967. Proc. Symp. Trop. Meteorol. 1970. EII, 1–8.
- Ruckstuhl C , Philipona R , Morland J , Ohmura A . Observed relationship between surface specific humidity, integrated water vapor, and longwave downward radiation at different altitudes. J. Geophys. Res. 2007; 112: D03302. DOI: 10.1029/2006JD007850.
- Sherwood S. C . Direct versus indirect effects of tropospheric humidity changes on the hydrologic cycle. Environ. Res. Lett. 2010; 5: 025206. DOI: 10.1088/1748-9326/5/2/025206.
- Simmons A. J , Willett K. M , Jones P. D , Thorne P. W , Dee D. P . Low-frequency variations in surface atmospheric humidity, temperature, and precipitation: inferences from reanalyses and monthly gridded observational data sets. J. Geophys. Res. 2010; 115(D1): D01110.
- Sultan B , Janicot S . Abrupt shift of the ITCZ over West Africa and intra-seasonal variability. Geophys. Res. Lett. 2000; 27(20): 3353–3356.
- Uppala S. M , Kållberg P. W , Simmons A. J , Andrae U , Bechtold V. Da Costa , co-authors . The ERA-40 re-analysis. Q. J. Roy. Meteorol. Soc. 2005; 131: 2962–3012.
- Waliser D. E , Gautier C . A Satellite-derived climatology of the ITCZ. J. Clim. 1993; 6(11): 2162–2174.
- Wilks D . Statistical Methods in the Atmospheric Sciences. 2006. International Geophysics Series, 2nd ed. San Diego: Academic Press.
- Zagar N , Skok G , Tribbia J . Climatology of the ITCZ derived from ERA Interim reanalyses. J. Geophys. Res. 2011; 116: D15103. DOI: 10.1029/2011JD015695.
- Zhang C . Double ITCZs. J. Geophys. Res. 2001; 106(D11): 11785–11792.
- Zheng Q , Yan X.-H , Liu W. T , Tang W , Kurz D . Seasonal and interannual variability of atmospheric convergence zones in the tropical Pacific observed with ERS-1 scatterometer. Geophys. Res. Lett. 1997; 24(3): 261–263.