
 ?Mathematical formulae have been encoded as MathML and are displayed in this HTML version using MathJax in order to improve their display. Uncheck the box to turn MathJax off. This feature requires Javascript. Click on a formula to zoom.
Abstract
Soil moisture–atmosphere feedbacks play an important role in the regional climate over many regions worldwide, not only for the mean climate but also for extreme events. Several studies have shown that the extent and severity of droughts and heat waves can be significantly impacted by dry or wet soil moisture conditions. To date, the impact of soil moisture on heavy rainfall events has been less frequently investigated. Thus, we consider the role of soil moisture in the formation of heavy rainfall using the Oder flood event in July 1997 as an example. Here, we used the regional climate model CCLM as an uncoupled standalone model and the coupled COSTRICE system, where CCLM is coupled with an ocean and a sea ice model over the Baltic and North Sea regions. The results from climate simulations over Europe show that the coupled model can capture the second phase (18–20 July) of heavy rainfall that led to the Oder flood, while the uncoupled model does not. Sensitivity experiments demonstrate that the better performance of the coupled model can be attributed to the simulated soil moisture conditions in July 1997 in Central Europe, which were wetter for the coupled model than for the uncoupled model. This finding indicates that the soil moisture preceding the event significantly impacted the generation of heavy rainfall in this second phase. The better simulation in the coupled model also implies the added value that the atmosphere–ocean coupling has on the simulation of this specific extreme event. As none of the model versions captured the first phase (4–8 July), despite the differences in soil moisture, it can be concluded that the importance of soil moisture for the generation of heavy rainfall events strongly depends on the event and the general circulation pattern associated with it.
1. Introduction
Soil moisture controls the partitioning of available energy into latent and sensible heat fluxes and conditions the amount of surface runoff. By controlling evapotranspiration, it links energy, water and carbon fluxes (Koster et al., Citation2004a; Dirmeyer et al., Citation2006; Seneviratne and Stöckli, Citation2008). Thus, soil moisture–atmosphere feedback effects play an important role in the regional climate in several regions worldwide (e.g. Koster et al., Citation2004a; Seneviratne et al., Citation2006b; Taylor and Ellis, Citation2006; Hirschi et al., Citation2011; see also Seneviratne et al., Citation2010 for an overview). For some of these regions, soil moisture memory can contribute significantly to such land–climate interactions (e.g. Delworth and Manabe, Citation1988; Koster and Suarez, Citation2001; Seneviratne et al., Citation2006a) and the development of the regional climate on seasonal time-scales (e.g. Schlosser and Milly, Citation2002; Koster et al., Citation2004b; Koster et al., Citation2010). Land surface processes can have effects on extreme events (Pitman et al., Citation2012), and several studies have noted that soil moisture at the beginning of an event can have a significant impact on the extent and severity of droughts and heat waves (e.g. Lorenz et al., Citation2010; Quesada et al., Citation2012). For example, positive soil moisture–precipitation feedback is likely to prolong and/or intensify drought (e.g. Taylor et al., Citation2013). Fischer et al. (Citation2007) indicated that the record-breaking European heat wave in 2003 was heightened by the major soil moisture anomalies that were caused by a large precipitation deficit together with early vegetation green-up in the months preceding the extreme summer event. Loew et al. (Citation2009) showed that these soil moisture anomalies were observable through remote sensing.
The impact of soil moisture on the severity of floods is straightforward: higher soil moisture conditions preceding an extreme rainfall event will lead to larger amounts of runoff and, consequently, to more extreme flooding associated with the rainfall event. However, the potential impact of soil moisture on extreme rainfall events has been less often a scientific focus until now. Recent studies of climate change projections (e.g. Gutowski et al., Citation2004; Pan et al., Citation2004) suggest that summer precipitation strongly depends on surface processes, notably in the simulation of regional extremes (Randall et al., Citation2007).
Therefore, in the present study, we conduct an in-depth investigation of the extreme rainfall event occurring from 18 to 20 July 1997, which led to the peak of the so-called ‘Oder flood’ (or ‘Odra flood’) in July 1997. Here, we present a regional climate modelling study, which indicates that the state of soil moisture preceding the event largely influenced the formation of the associated extreme rainfall over Central Europe. Section 2 describes the model and experiment settings. Section 3 describes the synoptic conditions that led to the Oder flood and analyses the main results of the modelling study. A discussion of results and conclusions is presented in Section 4.
2. Model and experiments
The atmospheric model COSMO-CLM (Rockel et al., Citation2008; hereafter, CCLM) was applied in two configurations in this study. First, the CCLM version cosmo4.8_clm17 was applied in an uncoupled mode using sea surface temperature (SST) from the ERA-Interim (hereafter, ERA-Int) reanalysis (Dee et al., Citation2011) over ocean surfaces. Note that even though the SST is provided every 6 h, its actual temporal resolution is daily. Second, CCLM is a component of the coupled system model COSTRICE (Ho-Hagemann et al., Citation2013), which also comprises the ocean model TRIMNP (Tidal Residual and Intertidal Mudflat Simulations model of the University of Trento, Italy; see Casulli and Cattani, Citation1994) and the sea ice model CICE version 5.1 from Los Alamos National Laboratory in the USA (www.oceans11.lanl.gov/trac/CICE/wiki). In the two-way air–sea coupling setup of COSTRICE using the coupler OASIS3-MCT version 2.0 (Valcke et al., Citation2013), TRIMNP and CICE are driven by mean state variables (e.g. sea level pressure, temperature, humidity and wind) and fluxes (e.g. precipitation, surface shortwave incoming radiation, surface longwave downward radiation, and latent and sensible heat fluxes) from CCLM. In return, CCLM receives skin temperatures, which are a combination of SSTs from TRIMNP and the sea ice skin temperatures from CICE, weighted by the sea ice concentration. For non-matching areas between the domains of CCLM and TRIMNP (see ), the ERA-Int SST was also used.
Fig. 1 Integration domain of CCLM (whole area) including the sponge zone (grey area), TRIMNP (blue & light blue), and CICE (light blue). Central Europe is marked by the red rectangular area.
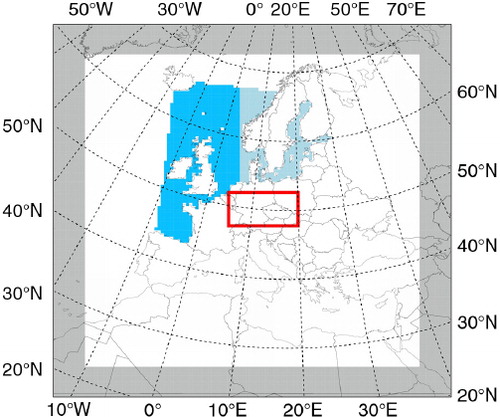
In both configurations, CCLM is set up with a horizontal grid mesh size of 50 km and 32 vertical atmosphere layers for the CORDEX Europe domain () and is driven by the 6-h ERA-Int reanalysis data as the initial and lateral boundary conditions. The convective parameterisation scheme of Tiedtke (Citation1989), which is a mass-flux scheme with a moisture-convergence closure, is used as the default in CCLM. The Tiedtke scheme distinguishes between shallow and deep convection based on the strength of the moisture convergence. The TERRA soil model (Schrodin and Heise, Citation2001) of CCLM includes 10 levels at depths of 0.005, 0.025, 0.07, 0.16, 0.34, 0.7, 1.42, 2.86, 5.74, and 11.5 m.
Two long-term experiments (EXPs) were conducted using the two configurations mentioned above: an uncoupled EXP using the standalone CCLM (hereafter, UNCPL) and a coupled EXP using the COSTRICE system (hereafter, CPL). For CPL, the CCLM, TRIMNP and CICE models exchange data every hour. The runs started in January 1979 and ended in December 2009. In CPL, CCLM has obtained SST feedback from the ocean and sea ice models (, light blue area) since June 1985, as the 1979–1985 period is considered as the spin-up time prior to the coupling. In addition, three 1-month sensitivity EXPs were designed to simulate the Oder flood extreme event with the uncoupled CCLM, and these EXPs were restarted on 1 July 1997 (). In the experiment UNCPL_SSTCPL, the CPL's SST was used as a lower boundary condition for the uncoupled CCLM. In UNCPL_resCPL, only the restart file is replaced by the one from CPL, whereas the ERA-Int SST is still used as a lower boundary condition. For UNCPL_SST_resCPL, both SST and the restart file of CPL are used. Note that a restart file of CCLM contains a simulation dump at a given time and includes approximately 90 quantities. Performing a warm start from a restart file produces binary identical results to those of a continuous run if the model configuration is the same.
Table 1. Sensitivity experiments (EXPS) using different sea surface temperature (SST) data for the coupling area, and the restart conditions on 1 July 1997 to simulate the Oder flood extreme event
3. The extreme rainfall event in July 1997
The Oder flood event in July 1997 was one of the most severe flood events in Europe, which caused considerable damage in Poland, Czech Republic and Germany. The flood was also called the Great Flood Odra (Kundzewicz et al., Citation1999). This event included two main phases. The first phase occurred from 4 to 8 July, due to a quasi-stationary mature depression that formed over the Mediterranean Sea in the beginning of July and moved northward to Central Europe, where it remained for several days, causing extreme rainfall (Keil et al., Citation1999). During the second phase of the event, another series of intensive rains occurred from 15 to 23 July. Kundzewicz et al. (Citation1999) noted that the highest precipitation from 17 to 22 July was recorded in the drainage basins of the Bystrzyca and Kaczawa rivers (tributaries to the Odra; up to 120–300 mm).
To understand the synoptic conditions that caused the event, we used data (gwlneudatum.dat) from the German Weather Service (introduced by Peter Hoffmann, PIK, 2015) and a definition from James (Citation2006) to consider five alternative weather types occurring in Europe in July 1997. First, a trough dominated Western Europe (TRW) in the beginning of the month (1–5 July), which started the first phase of the event; then, there was an Anticyclonic Northerly (NA) from 6 to 13 July and the Scandinavian High and a trough over Central Europe (HFZ) from 14 to 17 July. A Cyclonic North-Easterly (NEZ) type lasted from 18 to 23 July, which caused the second phase, and, finally, a Cyclonic Westerly (WZ) prevailed at the end of the month (24–31 July).
To assess the model's performance in capturing this event, we mainly use ERA-Int data. The data for the analyses of this event and also for long-term climate trends are prepared as follows. The time series of the 1-h or 3-h output of CCLM on a 0.44° grid are used to construct the daily and monthly means. The daily data of E-OBS (Haylock et al., Citation2008) on a 0.22° grid and of ERA-Int on a grid of approximately 0.7° are interpolated into the CCLM grid for comparisons. When analysing for the Central Europe area, data are averaged over the red rectangular domain in . Note that in the following, maps will only show the CCLM integration domain without the relaxation zone of 10 grid points (ca. 500 km) for the lateral boundary conditions if not mentioned otherwise.
3.1. Coupled vs. uncoupled experiment
First, the differences between the UNCPL and CPL for this event are analysed in the following section. While the CPL's long-term means (here i.e. 1986–2009) for air surface temperature at 2-m height and precipitation are rather similar to those of the UNCPL (not shown), for the shorter term, for example, 5 yr (1986–1990), the CPL and UNCPL differ somewhat in their monthly means, but the distinction is generally negligible (Ho-Hagemann et al., Citation2014). For extreme events, however, their simulations are relatively distinct, though the differences in magnitudes and patterns vary from event to event. Here, we analyse these differences in more detail for the Great Flood in the Odra river basin (Kundzewicz et al., Citation1999).
As described above, the Oder flood event was widespread over Central Europe, and both of its two major phases had relatively long durations. Randall et al. (Citation2007) noted that large-scale and long-duration extreme events generally result from the persistence of weather patterns associated with air–sea and air–land interactions. Therefore, it is expected that the CPL and UNCPL will yield rather different simulations, as air–sea interactions are only taken into account by the CPL.
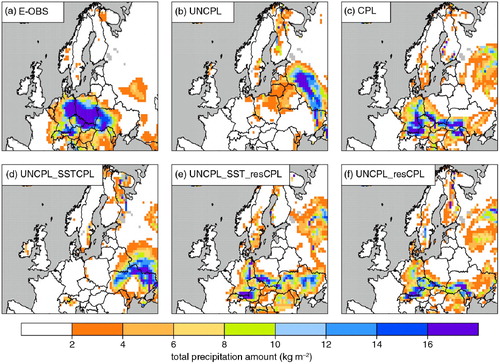
For the first phase of the event, however, the CPL and UNCPL behave similarly, as both of them underestimate the heavy rainfall over Poland compared with the E-OBS data (not shown). For phase 2 (), the heavy rainfall areas over Germany, Poland, Czech Republic, west Ukraine and north Switzerland (shown in E-OBS data, a) were captured much better by the CPL (c) than the UNCPL (b) although the heavy rainfall area over Poland is underestimated in the CPL.
Fig. 2 Mean precipitation (mm/day) of E-OBS data and the various experiments averaged for 18–20 July 1997. All panels show only a section of the integration domain focusing on Central Europe.
The underestimation of the phase 1 rainfall seems to be related to the fact that both experiments miss the low over the Mediterranean Sea and its movement to the north that brought heavy rainfall along the trajectory shown in (phase 1, top panel) using the 3-h data of ERA-Int. In , for each grid point, a value is given according to the sequence of the 12 time steps if the 3-h rainfall exceeds the 90th percentile (hereafter, 90PC, which was calculated based on the 3-h time series of July rainfall from during 1979–2009). For example, at 00:00 UTC on 5 July 1997, if the rainfall of a grid point from the last 3 h exceeds the 90PC, the grid point obtains a value of 1, otherwise 0. Similarly, at 03:00 UTC, the grid point obtains a value of 2, otherwise 0, and so on. Overlapping areas between the map of 00:00 UTC and the map of 03:00 UTC are set to the value of 03:00 UTC. For other time steps, this is done in an analogous manner. Thus, indicates the origin and the movement in time of heavy rainfall from the starting point of the extreme event. As the 90PC of both experiments differs from the 90PC of ERA-Int, each experiment uses its own 90PC. Note that using the 90PC of ERA-Int for the experiments yields similar patterns.
Fig. 3 Time evolution of the precipitation of (a) ERA-Int data, (b) uncoupled (UNCPL) and (c) coupled (CPL) experiments at the beginning of the two phases 5–6 July (top panel) and 17–18 July 1997 (bottom panel). The colour shows the 3-h step from 00:00 UTC on the first day to 09:00 UTC on the second day, if the 3-h rainfall exceeds the 90th percentile at each step. All panels focus on the European part of the integration domain.
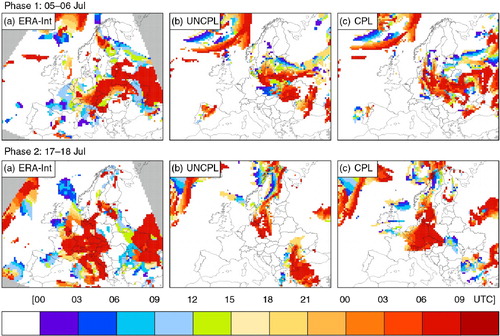
In phase 2, ERA-Int data show a joining of three major rainfall sources in Central Europe (a, bottom panel), one from the depression over the Mediterranean Sea moving northward, one from a low over the North Atlantic Ocean crossing the North Sea, and a smaller branch from the North Atlantic Ocean crossing England. In addition, rainfall was also locally generated over Central Europe due to convection, which is a typical situation in the summer. The joining of rainfall sources is revealed more clearly on the maps of 3-h precipitation together with the wind vectors from 00:00 UTC 17 July to 09:00 UTC 18 July (not shown). After the joining started at 18:00 UTC 17 July, the heavy rainfall occurred and lasted over Central Europe for the several next days. This phenomenon is not found in the UNCPL; instead, a heavy rainfall area formed in an area further north-east 1–2 d later (b). The joining is better captured by the CPL (c, bottom panel); however, the branch from the North Atlantic Ocean crossing the North Sea captured by the CPL has a break for several hours in between, and the branch crossing England is weaker compared with that shown in the ERA-Int reanalysis data (a, bottom panel). Again, the branch from the Mediterranean Sea is not captured by the CPL. Consequently, the CPL's heavy rainfall area (c) has a smaller area and a lower intensity than that of the E-OBS data (a). This result supports a hypothesis that, in the summer, the Mediterranean Sea plays an important role in generating depressions or sub-tropical cyclones that can bring heavy rainfall northward to Europe (especially those generated in the Gulf of Genoa). Without capturing this branch in the model, the heavy rainfall of CPL's phase 2 is underestimated compared with that of the E-OBS data. Thus, it would be useful to conduct an air–sea coupling experiment over the Mediterranean Sea for this extreme event. Note that Akhtar et al. (Citation2014) coupled CCLM with NEMO-MED for hurricane simulations and showed that the coupled system can better simulate the track lengths, warm cores and high wind speeds of Medicanes (Mediterranean hurricanes) than the uncoupled CCLM at a relatively high resolution (i.e. a 0.08° grid), though not at coarser resolutions (i.e. 0.44° and 0.22° grids). However, simulated rainfall was not analysed in their study, although it is very likely that the rainfall simulated over areas impacted by the Medicanes would have been improved in the coupled system due to the better performance of the Medicane simulation. However, this issue is beyond the scope of the present study.
The CPL's better simulation of the heavy rainfall pattern in phase 2 and thus of the associated quasi-stationary depression can be attributed to the ocean surface–atmosphere interaction and feedback reproduced in the coupled system. This finding may be related to the more adequate behaviour of SSTs that are available at a higher frequency (1 h) in the CPL than that of the daily SSTs from ERA-Int that are used as 6-h forcing in the UNCPL. The monthly mean disparity between the CPL and UNCPL for the SSTs over the coupling areas (the North Sea and the Baltic Sea) is approximately 1–2 degrees, with positive biases in the North Sea along the British coastline and a part of North Atlantic Ocean and negative biases in the German Bight and the Baltic Sea. The SST differences are associated with a higher 500 hPa geopotential height of 0–200 m over the sea/ocean and a similar amount lower over the European continent. This re-distribution of pressure may cause the CPL simulation to be approximately 40–60 mm/month drier over the ocean and wetter over land compared with the UNCPL simulation. However, during the extreme event (17–20 July; ), there is a larger negative SST bias over a large part of the North Sea and along the Norwegian coastline in the CPL compared with that of the UNCPL, especially on 18 and 19 July, though a warm bias still exists along the British coastline and on a part connected to the North Atlantic Ocean. This lower SST is associated with a lower geopotential height of 600–1200 m over the North Sea coastal area and all of Central Europe. A lower geopotential height (compared with other locations at the same latitude) indicates the presence of a storm or trough at mid-troposphere levels. Consequently, more precipitation over Central Europe is generated in the CPL compared with that of the UNCPL until 20 July, when the CPL's SST is similar to the UNCPL's SST and this phenomenon vanishes.
Fig. 4 Daily mean differences between the CPL and UNCPL for the surface temperature (K) (filled colour) and 500 hPa geopotential height (m) (contours) from 17 to 20 July 1997. Contours show values in a range of [–1200, 1200] with an interval of 200 m. Dashed contours for negative values and solid contours for positive values.
![Fig. 4 Daily mean differences between the CPL and UNCPL for the surface temperature (K) (filled colour) and 500 hPa geopotential height (m) (contours) from 17 to 20 July 1997. Contours show values in a range of [–1200, 1200] with an interval of 200 m. Dashed contours for negative values and solid contours for positive values.](/cms/asset/e153de44-07f8-4e56-9c1f-cef789cfdd5e/zela_a_11817115_f0004_ob.jpg)
In addition to the impact of the simulated SST in July 1997 on the simulation of the extreme event, the past history of the simulated climate that is reflected in the land surface and atmospheric states, especially soil moisture, in the beginning of the month plays an important role. To find out whether the simulated SST or soil moisture is responsible for the CPL's better performance, three sensitivity experiments were conducted that are analysed in the following section.
3.2. Sensitivity experiments
To investigate whether the better temporal resolution of SST in the CPL causes the better simulation of the heavy rainfall event during the second phase of the Oder event, the CPL's SST was used as a lower boundary condition for the uncoupled CCLM that was restarted on 1 July 1997 (UNCPL_SSTCPL). However, the heavy rainfall from 18 to 20 July 1997 (phase 2) is not captured with this setup either, as shown in d. Note that the 6-h SST taken from the CPL (instead of the 1-h SST used in the CPL) may still be unable to fully capture the diurnal cycle of SST, as simulated in the CPL.
However, when both SST and the restart file of the CPL are applied (UNCPL_SST_resCPL), the second phase of the event is captured with a similar rainfall area to that of the CPL, although the intensity is not as high as in the CPL (e). Hence, the restart state on 1 July plays an important role in reproducing the rainfall extreme event occurring from 18 to 20 July 1997. To consider the impact of SST and its diurnal cycle, in UNCPL_resCPL (f), only the restart file of the CPL is replaced, while the ERA-Int SST is still used as a lower boundary condition for the uncoupled CCLM. This experiment results in a similar rainfall simulation as the UNCPL_SST_resCPL (e). On the one hand, the CPL's better performance compared with that of the UNCPL_resCPL or the UNCPL_SST_resCPL implies the impact of the air–sea coupling-related interaction and feedback on the simulations. On the other hand, the better performance of the CPL and two EXPs of the UNCPL with the restart file of the CPL compared with the UNCPL and the UNCPL_SSTCPL shows that memory in the atmosphere/land system induced by its state on 1 July is crucial for the adequate simulation of the Oder flood extreme event. As most of the atmosphere/land-influencing synoptical-scale processes in July comprise only a small amount of memory, it can be concluded that soil moisture is a key player in transmitting this memory, especially giving its known importance in land–climate interactions (see Section 1). Differences may also be imposed by different states of soil temperatures that would appear in the development of land surface temperatures that interact with the atmosphere.
Therefore, the simulated surface temperature (T_S) and the soil moisture content (W_SO) for all 10 levels were analysed for July 1997. However, below 0.7 m, soil moisture differences between the experiments are negligible; therefore, only the results of the uppermost six levels from the surface (until 0.7 m) are considered in the following section.
3.3. The land surface state in the beginning of July 1997
On 1 July 1997 at 00:00 UTC, that is, the restarting time, the soil moisture states of the UNCPL and CPL differ noticeably in the six upper layers of the soil (a). The CPL's soil moisture is generally larger than that of the UNCPL, except over Northern Europe. The difference is largest near the surface and mostly vanishes below the 6th layer. When considering the soil moisture mean across Central Europe in July (a), the UNCPL and UNCPL_SSTCPL always provide lower soil moisture than the CPL and the other two experiments using the restart file from the CPL. This difference is present at the beginning of July and continues throughout the month. It is especially pronounced during phase 2 of the event, as capturing the heavy rainfall significantly increases soil moisture in the CPL, UNCPL_SST_resCPL and UNCPL_resCPL. Although using SSTs from different sources, the UNCPL_SST_resCPL and UNCPL_resCPL provide relatively the same soil moisture content. This result clearly shows the persistent memory of soil moisture that slowly changes over the month and thus justifies the chosen setup of the sensitivity experiments using the restart state on 1 July 1997.
Fig. 5 (a) Relative difference (%) of average soil moisture within the upper six soil layers (until a soil depth of 0.7 m) and (b) T_S differences (K) between the CPL and UNCPL at the beginning of 1 July 1997.
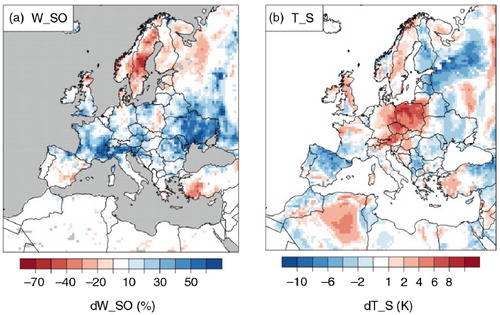
Fig. 6 (a) Area averaged soil moisture (m) summed up for six uppermost levels of the various experiments over Central Europe in July 1997 and (b) difference of simulated daily surface temperature against ERA-Int data over Central Europe in July 1997.
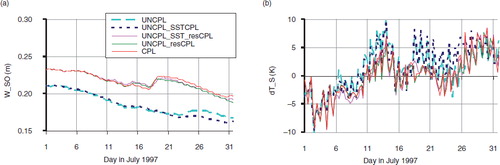
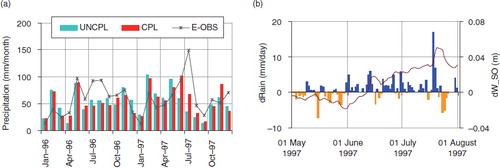
On 1 July 1997, the CPL's T_S is approximately 3 K higher than that of the UNCPL over Central Europe (b). Also, on this date, the CPL's T_S is closer to the ERA-Int T_S than the UNCPL (b). Despite these differences in the beginning of July, there is no apparent memory effect in the surface temperature over Central Europe, which can be observed especially in the first days of July, when the experiments do not show systematic deviations from each other. Later in the month, deviations are caused by the different atmospheric behaviours and the associated surface energy fluxes. Note that the CPL's surface temperatures are generally closer to the ERA-Int data than those of the UNCPL. In addition, the CPL's monthly precipitation mean for June 1997 is closer to the E-OBS data than that of the UNCPL (a), although the UNCPL and CPL perform similarly in previous months, with a dry bias in summer and a wet bias in winter. The CPL's monthly precipitation mean for June (101 mm/month) is in good agreement with the E-OBS data (93 mm/month), whereas the UNCPL (58 mm/month) reveals a large dry bias. The CPL's higher amount of precipitation, leading to wetter soil moisture conditions than in the UNCPL, is consistent with the analysis of Kundzewicz et al. (Citation1999) about the soil moisture status over Poland at the end of June and the beginning of July 1997. They stated that precipitation in the second half of June had filled much of the naturally available water retention, thus saturating soil storage. The CPL's better performance in June is likely associated with the beneficial impact of the air–sea coupling over the Baltic Sea and North Sea; the CPL could thus better reproduce the observed sequence of weather events in the weeks preceding the flood event and provide, in turn, a better restart condition than the UNCPL for July 1997. Thus, it seems that the beneficial impact of the coupling between the atmosphere and the seas depends on the season and the large-scale weather situation. However, determining the exact reason for this beneficial impact is beyond the scope of the present study, but it is important to note here that the UNCPL's dry bias for June evidently leads to the dry bias of soil moisture content in July (b). Here, it can be noted that CCLM's dry summer bias is a common RCM bias, as many RCMs tend to simulate too little summer precipitation over these areas (e.g. Hagemann et al., Citation2004; Jacob et al., Citation2007; Christensen et al., Citation2010).
Fig. 7 (a) Monthly mean of precipitation (mm/month) of the UNCPL, CPL and E-OBS data averaged over Central Europe for January 1996–December 1997; (b) Differences between the CPL and UNCPL for precipitation (mm/day) (bars: blue for positive values, orange for negative values) and for the soil moisture (m) summed up for six uppermost levels (brown solid line). Data are averaged over Central Europe for 1 May–31 July 1997.
3.4. On the role of soil moisture in July 1997
The soil moisture slightly decreases from 1 July until an increase appears after 18 July 1997, when the heavy rainfall over Central Europe is simulated in the CPL, UNCPL_resCPL and UNCPL_SST_resCPL (a). This figure shows an evident part of the positive feedback loop between soil moisture and precipitation: more precipitation leads to more soil moisture. A question arising here is how the wet soil moisture state contributes to the extreme event.
Some modelling studies have suggested that there are not only positive feedback loops between soil moisture and precipitation but also negative ones that, under specific conditions, such as convective instability and/or cloud formation, may be stronger over dry soils (e.g. Hohenegger et al., Citation2009; Froidevaux et al., Citation2014). However, to date, the latter results appear mostly confined to single-column, cloud-resolving, and some high-resolution regional climate simulations (Seneviratne et al., Citation2010) and may also depend on the choice of the convective parameterisations (e.g. Giorgi et al., Citation1996). An important mechanism favouring the initiation of rain over drier soil is the development of meso-scale circulations driven by soil moisture heterogeneity (Pielke, Citation2001), which has been confirmed in an observational analysis over the Sahel by Taylor et al. (Citation2011). In Europe, the soil moisture influence on convective initiation is much weaker than in the Sahel, but similar structures imply that soil moisture heterogeneity is critical (C. Taylor, pers. comm., 2015). Guillod et al. (Citation2015) noted that precipitation events tend to be located over drier patches, but they generally occur over wet conditions; positive temporal soil moisture–precipitation relationships are thus driven by large-scale soil moisture. Thus, negative feedbacks seem to have more of an impact on high resolution and thus on the local scale, where the effects of land surface heterogeneity for the inferred feedbacks also need to be taken into account (Chen and Avissar, Citation1994; Pielke et al., Citation1998; Taylor et al., Citation2013). As the Oder flood is more of a large-scale event, one can expect that negative feedbacks did not have a major impact on its formation. To consider the potential feedback loop and understand its mechanisms during the second phase, shows the difference between the CPL and UNCPL in the top six levels of soil moisture content, evaporation, and sensible and latent heat fluxes averaged for 1–17 July, the time period prior to the event's second phase.
Fig. 8 Differences between the CPL and UNCPL for (a) the six uppermost levels of soil moisture (m), (b) surface evaporation (positive upward) (kg m−2/day), (c) sensible heat flux (positive upward) (W m−2) and (d) latent heat flux (positive upward) (W m−2). Data are averaged for 1–17 July 1997.
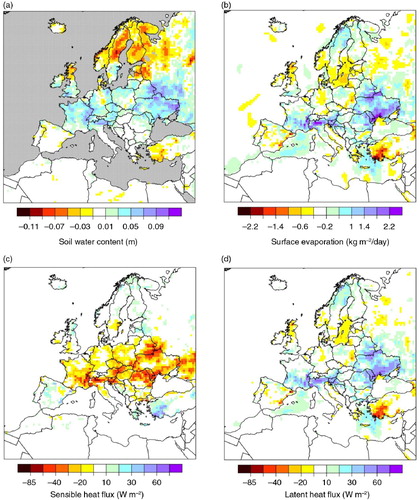
Obviously, in the time prior to the event, the soil moisture of Central Europe in the CPL is higher than that in the UNCPL (a), which leads to more evaporation (b) and latent heat fluxes (d) from the land into the atmosphere. For the CPL over Central Europe, more evapotranspiration and enhanced moisture convergence (a) lead to more humidity in the atmosphere; more cloud water (b) is created and, in turn, more clouds (c). Details about the calculation of the moisture convergence are described in the Appendix. The cloud formations reduce the incoming shortwave radiation to the surface (not shown), which, together with the enhanced latent cooling via evapotranspiration, lead to a cooler surface than in UNCPL (b). This cooler surface also seems to be reflected in the sensible heat flux into the atmosphere over Central Europe, which is less in the CPL than in the UNCPL (c). Note that the CPL's surface temperature is closer to the ERA-Int data than that of the UNCPL during the extreme event (b).
Fig. 9 Daily variation of (a) moisture convergence (mm/day), (b) the vertical integrated cloud water (kg m−2), (c) the total cloud cover and (d) the planetary boundary-layer thickness (m) of the UNCPL and CPL averaged over Central Europe for July 1997.
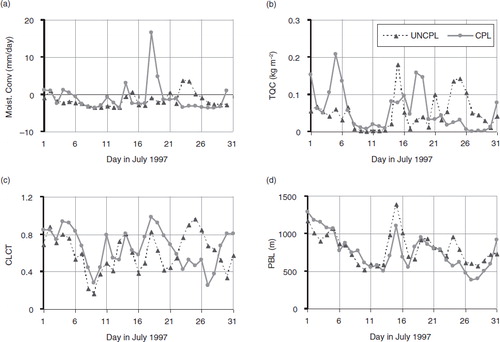
Moreover, the wetter the air advected into the region and the greater the additional water added by evapotranspiration, the lower the height of the top of the planetary boundary layer (PBL; Hayden and Pielke, Citation2015). d shows that on 18 July 1997, the CPL has a lower PBL than the UNCPL because of its higher moisture convergence (a) and higher vertical integrated cloud water (b) due to the antecedent wetter soil moisture conditions in the CPL. A shallower PBL, in turn, favours moist convection over wet surfaces (Hohenegger et al., Citation2009). Consistent with this process, on 18 July 1997, more moisture was rising upward and supported the formation of more deep convective clouds in the CPL (b) than in the UNCPL (a). Because moisture convergence is likely to be proportionately enhanced as the moisture content increases, it should lead to similarly enhanced precipitation rates (Stocker et al., Citation2001). Consequently, heavy rainfall started on 18 July in the CPL. As the drier soil moisture conditions in the UNCPL did not lead to this rainfall, it can be concluded that soil moisture played a significant role for the pattern and severity of the phase 2 rainfall during the Oder flood event.
Fig. 10 (a) Moisture convergence (mm/day) differences between the CPL and UNCPL for 17 and 18 July 1997; (b) Averaged daily vertical integrated cloud water (kg m−2) of the UNCPL and CPL for 17–18 July 1997.
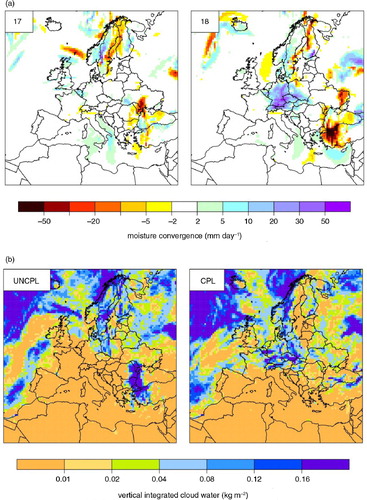
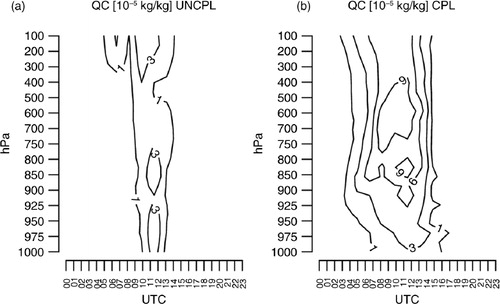
Fig. 11 Vertical distribution (pressure in hPa) of cloud water content QC (10–5 kg/kg) over time (UTC) of (a) the UNCPL and (b) the CPL for 18 July 1997, averaged over Central Europe.
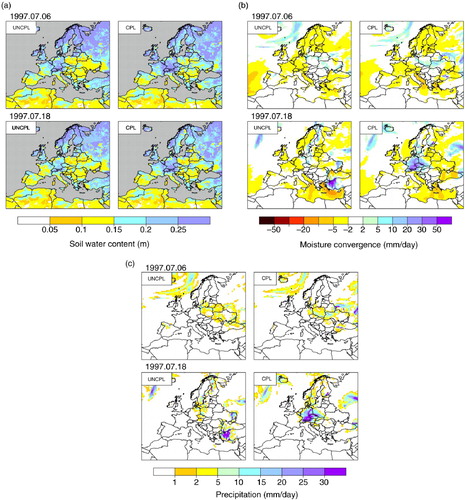
Nevertheless, high soil moisture content is a necessary, though insufficient, condition for triggering the heavy rainfall event in this case study. By comparing the daily soil moisture of the six top levels (a), moisture convergence (b) and precipitation (c) for 6 July (phase 1) and 18 July (phase 2) of the UNCPL and CPL simulations, we can see that although soil moisture content of the CPL on 6 July is as high as it is on 18 July, the heavy rainfall area over Central Europe on 6 July is not captured, as the simulated rainfall is much lower than on 18 July. This low rainfall is associated with a rather low moisture convergence on 6 July (approximately 2–5 mm/day), which is approximately 10 times less than on 18 July (approximately 20–50 mm/day). Note that the ERA-Int data shows a similar intensity of moisture convergence (approximately 20–60 mm/day) on these 2 d. An area of moisture divergence over the North Sea in the CPL on 18 July (b) implicitly suggests that a source of moisture from the sea was transferred to Central Europe. Consequently, high soil moisture content, together with the large-scale circulation moisture transport, can be seen to contribute to the phase 2 extreme event.
Fig. 12 Daily (a) soil moisture (m) of six uppermost levels, (b) moisture convergence (mm/day), and (c) precipitation (mm/day) of the UNCPL and CPL for 6 and 18 July 1997.
4. Summary and conclusion
In this study, we highlighted the impact of soil moisture on an extreme rainfall event associated with the Oder flood in July 1997. We also noted the added value that the regional climate model CCLM coupled with an ocean model has on the simulation of the event. CCLM was used in an uncoupled setup using ERA-Int SSTs (UNCPL) as well as within the COSTRICE system, where it was coupled with the TRIMNP ocean model and the CICE sea ice model over the Baltic and Nordic Seas (CPL). Climate simulations using both setups were conducted over Europe, and lateral boundary conditions were provided by ERA-Int data. Here, it was found that the CPL captured the heavy rainfall during the second phase (18–20 July) of the event, while the UNCPL did not. To investigate the reason for this different behaviour, several sensitivity experiments using SSTs and the restart file of the CPL climate simulation were conducted with the uncoupled setup for July 1997. With the same model setup, except for the restart state and associated soil moisture on 1 July 1997, the uncoupled CCLM, using the wetter soil moisture conditions from the CPL (UNCPL_resCPL), was able to capture the rainfall of phase 2, while the uncoupled CCLM (UNCPL), using its own drier conditions, could not. An analogous result was yielded when also the SST from the CPL was used (for the UNCPL_SST_resCPL and UNCPL_SSTCPL).
These results indicate the important role that soil moisture plays in the pattern and severity of this heavy rainfall event. The wetter soil moisture state of the CPL is also consistent with the results of Kundzewicz et al. (Citation1999), who noted that surface water storages were saturated in Poland at the end of June 1997. The higher soil moisture leads to more evapotranspiration and latent heat fluxes transferred from the land into the atmosphere, which supports the moisture convergence that leads to the formation of cloud water and convection; in turn, heavy rainfall is eventually generated. This process chain is a typical positive feedback loop between soil moisture and precipitation that acts on the large scale over Central Europe to initiate this event. Previously, this positive feedback loop was typically identified on longer time-scales, for example, monthly. For instance, Schär et al. (Citation1999) investigated the impact of initial soil moisture in 2-month-long RCM simulations for the months of July 1990 and July 1993 and concluded that soil moisture anomalies could have strong impacts on subsequent precipitation in Spain, France and Central Europe.
As this wetter soil moisture is only simulated in the CPL (not in the UNCPL), an added value of the atmosphere–ocean coupling over the Baltic and North Seas is indicated for the simulation of rainfall over Central Europe, especially for the summer of 1997 and specific extreme events, such as the heavy rainfall during the second phase of the Oder flood event. For the latter, conditions reveal that local feedbacks are at least as important as the large-scale circulation features. In situations in which this is not the case, soil moisture differences will not have a discernible impact on the characteristics of an extreme event, as is the case for phase 1 (4–8 July) of the Oder flood. Despite of the soil moisture differences, none of the experiments captures the heavy rainfall over Central Europe due to the missing representation of the low coming in from the Mediterranean Sea. In this respect, Kotlarski et al. (Citation2012) simulated the Elbe river flood in 2002 with an extended regional climate model and found that soil moisture initialisation had only a limited influence on the simulated precipitation pattern. Thus, the impact of soil moisture seems to be highly event-dependent. Nevertheless, its state can be a key factor for the simulation and, in turn, for the prediction of an extreme rainfall event, as our study has shown in the case of the Oder flood.
However, soil moisture is not a unique factor that generates heavy rainfall; instead, the lateral convergence of moisture from the North Sea and the Mediterranean Sea also plays an important role, as it brings moisture from the seas to the land. The moisture branch from the North Sea to Central Europe was captured by the coupled system, while it was missed in the uncoupled experiment. The capturing of this branch can thus also be identified as a positive impact of the atmosphere–ocean coupling over the North Sea and Baltic Sea.
It has to be noted that added value of the atmosphere–ocean coupling may depend not only on the event considered but also on other factors, such as the RCM, domain and integration period used. For example, Gröger et al. (Citation2015) used the coupled system model RCAO driven by ERA40 reanalysis data for the Baltic and North Sea regions and found that the simulated air temperature and precipitation of coupled and uncoupled experiments do not differ over land; they only differ over the coupling ocean area, even in cases of extreme rainfall events. This finding conflicts with our findings, but the northern border of their air–sea coupling domain over the North Sea is much further to the South than in the COSTRICE domain used in the present study. As the spectral nudging technique was not applied in their experiments, it seems that the atmospheric model RCA is either more ‘stable’ than CCLM or the RCAO coupling domain over the ocean is not large enough to cause large-scale changes in the atmosphere. In fact, COSTRICE was tested in several experiments using various configurations of forcing data, domain, vertical coordinates, relaxation sponge, etc., and a common result between these experiments was that coupled and uncoupled simulations always differ, especially in cases of extreme events, not only over the coupling ocean areas but also over the adjacent land, though the differences vary with each configuration. The impact of the air–sea coupling on the adjacent land in COSTRICE is consistent with findings in some other studies, for example, Samuelsson et al. (Citation2010), who coupled the lake model FLake with RCA3.5, and Pham et al. (Citation2014), who coupled CCLM with NEMO over the North Sea and Baltic Sea, although their studies mainly analysed the effects on air temperature.
Even if the same RCM is used, the model configuration may impact the results. For instance, if spectral nudging (von Storch et al., Citation2000) is applied, where large-scale atmospheric states are imposed on the RCM simulation (which is usually performed for higher atmospheric model layers, for example, above 850 hPa, and with increasing strength towards higher levels to ensure that the regional processes near the surface are not disturbed), the impact of the air–sea coupling on the simulations might be less visible due to the constraint of large-scale circulation characteristics on the RCM simulation. Moreover, the spatial resolution strongly impacts the simulation of extreme rainfall events (Randall et al., Citation2007). Often, a resolution of 50 km, as used for CCLM in the present study, is rather coarse for considering extreme events. Thus, this low resolution may also have contributed to the underestimation of heavy rainfall in both experiments. Typically, the higher the resolution, the better the representation of the physical processes and topography in the RCM, and the better the extreme rainfall may be captured. For example, CLM-COM11, an atmosphere-only version on a 0.11° grid (described in Kotlarski et al., Citation2014), provided more rainfall than the UNCPL in the second phase of the Oder event, as more convective rainfall was created (not shown). Nevertheless, the heavy rainfall area of the Oder event is relatively large due to the associated large-scale moisture convergence; therefore, the CPL is able to reproduce the extreme event for this case study on a 50 km grid. On the other hand, it is rather difficult to increase CCLM's resolution in the current coupled system COSTRICE for a long-term simulation due to the limitation of computing resources. Future work may include a shorter simulation using a higher resolution of the coupled system to examine the role of resolution in the Oder flood event. Moreover, CCLM seems to be relatively sensitive to vertical atmospheric coordinates. The chosen coordinate in this study causes more dry bias in summer than in the CCLM setup used in a study by Kotlarski et al. (Citation2014).
In the future, an analysis is planned for other heavy rainfall events with respect to the impact of soil moisture, on the one hand, and whether the atmosphere–ocean coupling leads to the improved capture of these events, on the other hand. Here, it might be desirable to develop some measures that can be used to identify weather situations in which the state of soil moisture is crucial for the initiation of heavy rainfall events.
5. Acknowledgements
This study has been supported by funding from the German project REKLIM. We acknowledge the E-OBS dataset from the EU-FP6 project ENSEMBLES (www.ensembles-eu.metoffice.com) and the data providers in the ECA&D project (www.ecad.eu). We appreciate the use of the ERA-Interim reanalysis product provided by the European Centre for Medium-Range Weather Forecasts (ECMWF). We express our thanks to Peter Hoffmann (Potsdam Institute for Climate Impact Research – PIK) for introducing and providing the weather type data of the German Weather Service. We also thank Klaus Arpe (scientist emeritus) and Jan-Peter Schulz (German Weather Service – DWD) for fruitful discussions.
Related Research Data
References
- Akhtar N. , Brauch J. , Dobler A. , Béranger K. , Ahrens B . Medicanes in an ocean–atmosphere coupled regional climate model. Nat. Hazards Earth Syst. Sci. 2014; 14: 2189–2201.
- Casulli V. , Cattani E . Stability, accuracy and efficiency of a semi-implicit method for three dimensional shallow water flow. Comput. Math. Applic. 1994; 27: 99–112.
- Chen F. , Avissar R . Impact of land-surface moisture variability on local shallow convective cumulus and precipitation in large-scale models. J. Appl. Meteorol. 1994; 33: 1382–1401.
- Christensen J. H. , Kjellstrom E. , Giorgi F. , Lenderink G. , Rummukainen M . Weight assignment in regional climate models. Clim. Res. 2010; 44: 179–194.
- Dee D. P. , Uppala S. , Simmons A. J. , Berrisford P. , Poli P. , co-authors . The era-interim reanalysis: configuration and performance of the data assimilation system. Q. J. R. Meteor. Soc. 2011; 137: 553–597.
- Delworth T. L. , Manabe S . The influence of potential evaporation on the variabilities of simulated soil wetness and climate. J. Clim. 1988; 1: 523–547.
- Dirmeyer P. , Koster R. , Guo Z. A. D . Do global models properly represent the feedback between land and atmosphere?. J. Hydrometeorol. 2006; 7: 1177–1198.
- Fischer E. M. , Seneviratne S. I. , Vidale P. L. , Lüthi D. , Schär C . Soil moisture – atmosphere interactions during the 2003 European summer heat wave. J. Clim. 2007; 20: 5081–5099.
- Froidevaux P. , Schlemmer L. , Schmidli J. , Langhans W. , Schär C . Influence of background wind on the local soil moisture-precipitation feedback. J. Atmos. Sci. 2014; 71: 782–799.
- Giorgi F. , Mearns L. O. , Shields C. , Mayer L . A regional model study of the importance of local versus remote controls of the 1988 drought and the 1993 flood over the central United States. J. Clim. 1996; 9: 1150–1162.
- Gröger M. , Dieterich C. , Meier H. E. M. , Schimanke S . Thermal air-sea coupling in hindcast simulations for the North Sea and Baltic Sea on the NW European shelf. Tellus A. 2015; 67 26911. DOI: http://dx.doi.org/10.3402/tellusa.v67.26911 .
- Guillod B. P. , Orlowsky B. , Miralles D. G. , Teuling A. J. , Seneviratne S. I . Reconciling spatial and temporal soil moisture effects on afternoon rainfall. Nat. Commun. 2015; 6: 1–6.
- Gutowski W. J. , Otieno F. , Arritt R. W. , Takle E. S. , Pan Z . Diagnosis and attribution of a seasonal precipitation deficit in a US regional climate simulation. J. Hydrometeorol. 2004; 5: 230–242.
- Hagemann S. , Machenhauer B. , Jones R. , Christensen O. B. , Deque M. , co-authors . Evaluation of water and energy budgets in regional climate models applied over Europe. Clim. Dyn. 2004; 23: 547–567.
- Hayden B. P. , Pielke R. A . Planetary boundary layer (PBL). Atmospheric science . 2015. http://www.britannica.com/science/planetary-boundary-layer .
- Haylock M. R. , Hofstra N. , Klein Tank A. M. G. , Klok E. J. , Jones P. D. , co-authors . A European daily high-resolution gridded data set of surface temperature and precipitation for 1950–2006. J. Geophys. Res. 2008; 113: 1–12.
- Hirschi M. , Seneviratne S. , Alexandrov V. , Boberg F. , Boroneant C. , co-authors . Observational evidence for soil-moisture impact on hot extremes in southeastern Europe. Nat. Geosci. 2011; 4: 17–21.
- Ho-Hagemann H. , Rockel B. , Kapitza H. , Behrens J . Impacts of different coupling methods on regional atmosphere – ocean simulations. 2014; Geesthacht, Germany: International Baltic Earth Secretariat Publication. 26–27.
- Ho-Hagemann, H. T. M., Rockel, B., Kapitza, H., Geyer, B. and Meyer, E. 2013. COSTRICE – an atmosphere – ocean – sea ice model coupled system using OASIS3. Technical Report No. 2013-5//ISSN 2191-7833. Helmholtz-Zentrum Geesthacht, Geesthacht, Germany.
- Hohenegger C. , Brockhaus P. , Bretherton C. S. , Schär C . The Soil Moisture–Precipitation feedback in simulations with explicit and parameterized convection. J. Clim. 2009; 22: 5003–5020.
- Jacob D. , Bärring L. , Christensen O. B. , Christensen J. H. , Hagemann S. , co-authors . An inter-comparison of regional climate models for Europe: design of the experiments and model performance. Clim. Change. 2007; 81: 31–52.
- James P. M . An assessment of European synoptic variability in Hadley Centre Global Environmental models based on an objective classification of weather regimes. Clim. Dyn. 2006; 27: 215–231.
- Keil C. , Volkert H. , Majewski D . The Oder flood in July 1997: transport routes of precipitable water diagnosed with an operational forecast model. Geophys. Res. Lett. 1999; 26: 235–238.
- Koster R. D. , Dirmeyer P. A. , Guo Z. , Bonan G. , Chan E. , co-authors . Regions of strong coupling between soil moisture and precipitation. Science. 2004a; 305: 1138–1140.
- Koster R. D. , Mahanama S. , Yamada T. J. , Balsamo G. , Boisserie M. , co-authors . The contribution of land initialization to subseasonal forecast skill: first results from the GLACE-2 Project. Geophys. Res. Lett. 2010; 37 L02402. DOI: http://dx.doi.org/10.1029/2009GL041677 .
- Koster R. D. , Suarez M. J . Soil moisture memory in climate models. J. Hydrometeorol. 2001; 2: 558–570.
- Koster R. D. , Suarez M. J. , Liu P. , Jambor U. , Berg A. , co-authors . Realistic initialization of land surface states: impacts on subseasonal forecast skill. J. Hydrometeorol. 2004b; 5: 1049–1063.
- Kotlarski S. , Hagemann S. , Krahe P. , Podzun R. , Jacob D . The Elbe river flooding 2002 as seen by an extended regional climate model. J. Hydrol. 2012; 472: 169–183.
- Kotlarski S. , Keuler K. , Christensen O. B. , Colette A. , Déqué M. , co-authors . Regional climate modelling on European scales: a joint standard evaluation of the EURO-CORDEX RCM ensemble. Geosci. Model Dev. 2014; 7: 1297–1333.
- Kundzewicz Z. W. , Szamalek K. , Kowalczak P . The great flood of 1997 in Poland. Hydrol. Sci. J. 1999; 44: 855–870.
- Loew A. , Holmes T. , De Jeu R . The European heat wave 2003: early indicators from multisensoral microwave remote sensing?. J. Geophys. Res. 2009; 114: D05103.
- Lorenz R. , Jaeger E. B. , Seneviratne S. I . Persistence of heat waves and its link to soil moisture memory. Geophys. Res. Lett. 2010; 37: L09703.
- Pan Z. , Christensen J. H. , Arritt R. W. , Gutowski W. J. , Takle E. S. Jr. , co-authors . Evaluation of uncertainties in regional climate change simulations. J. Geophys. Res. 2004; 106: 17735–17752.
- Pham T. V. , Brauch J. , Dieterich C. , Frueh B. , Ahrens B . New coupled atmosphere–ocean–ice system COSMO-CLM/NEMO: assessing air temperature sensitivity over the North and Baltic Seas. Oceanologia. 2014; 56: 167–189.
- Pielke R. A . Influence of the spatial distribution of vegetation and soils on the prediction of cumulus convective rainfall. Rev. Geophys. 2001; 39: 151–177.
- Pielke R. A. , Avissar R. , Raupach M. , Dolman A. J. , Zeng X. B. , co-authors . Interactions between the atmosphere and terrestrial ecosystems: influence on weather and climate. Glob. Change Biol. 1998; 4: 461–475.
- Pitman A. J. , De Noblet-Ducoudré N. , Avila F. B. , Alexander L. V. , Boisier J.-P. , co-authors . Effects of land cover change on temperature and rainfall extremes in multi-model ensemble simulations. Earth Sys. Dyn. 2012; 3: 213–231.
- Quesada B. , Vautard R. , Yiou P. , Hirschi M. , Seneviratne S. I . Asymmetric European summer heat predictability from wet and dry southern winters and springs. Nat. Clim. Change. 2012; 2: 736–741.
- Randall D. A. , Wood R. A. , Bony S. , Colman R. , Fichefet T. , co-authors . Climate models and their evaluation. Climate Change 2007: the Physical Science Basis. 2007; Cambridge University Press, Cambridge, UK: Contribution of Working Group I to the Fourth Assessment Report of the Intergovernmental Panel on Climate Change.
- Rockel B. , Will A. , Hense A . Special issue Regional climate modelling with COSMO-CLM (CCLM). Meteorologische Zeitschrift. 2008; 17: 347–348.
- Samuelsson P. , Kourzeneva E. , Mironov D . The impact of lakes on the European climate as simulated by a regional climate model. Boreal Environ. Res. 2010; 15: 113–129.
- Schär C. , Lüthi D. , Beyerle U. , Heise E . The soil-precipitation feedback: a process study with a regional climate model. J. Clim. 1999; 12: 722–741.
- Schlosser C. A. , Milly P. C. D . A model-based investigation of soil moisture predictability and associated climate predictability. J. Hydrometeorol. 2002; 3: 483–501.
- Schrodin R. , Heise E . The Multi-Layer Version of the DWD Soil Model TERRA_LM. 2001; Offenbach, Germany: Deutscher Wetterdienst. COSMO Technical Report No. 2.
- Seneviratne S. I. , Corti T. , Davin E. , Hirschi M. , Jaeger E. B. , co-authors . Investigating soil moisture–climate interactions in a changing climate: a review. Earth Sci. Rev. 2010; 99: 125–161.
- Seneviratne S. I. , Koster R. D. , Guo Z. , Dirmeyer P. A. , Kowalczyk E. , co-authors . Soil moisture memory in AGCM simulations: analysis of global land–atmosphere coupling experiment (GLACE) data. J. Hydrometeorol. 2006a; 7: 1090–1112.
- Seneviratne S. I. , Lüthi D. , Litschi M. , Schär C . Land–atmosphere coupling and climate change in Europe. Nature. 2006b; 443: 205–209.
- Seneviratne S. I. , Stöckli R . Brönnimann , etal. The role of land-atmosphere interactions for climate variability in Europe. Climate Variability and Extremes during the Past 100 years. 2008; Dordrecht, Netherlands: Springer Verlag. 179–193. Adv. Global Change Research, 33.
- Stocker T. F. , Clarke G. K. C. , Le Treut H. , Lindzen R. S. , Meleshko V. P. , co-authors . Manabe S. , Mason P . Chapter 7: Physical climate processes and feedbacks. Climate Change 2001: the Physical Science Basis. 2001; Cambridge, United Kingdom and New York, NY, USA: Cambridge University Press. Contribution of Working Group I to the Third Assessment Report of the Intergovernmental Panel on Climate Change.
- von Storch H. , Langenberg H. , Feser F . A spectral nudging technique for dynamical downscaling purposes. Mon. Wea. Rev. 2000; 128: 3664–3673.
- Taylor C. M. , Birch C. E. , Parker D. J. , Dixon N. , Guichard F. , co-authors . Modeling soil moisture–precipitation feedback in the Sahel: importance of spatial scale versus convective parameterization. Geophys. Res. Lett. 2013; 40: 6213–6218.
- Taylor C. M. , Ellis R. J . Satellite detection of soil moisture impacts on convection at the mesoscale. Geophys. Res. Lett. 2006; 33 L03404. DOI: http://dx.doi.org/10.1029/2005GL025252 .
- Taylor C. M. , Gounou A. , Guichard F. , Harris P. P. , Ellis R. J. , co-authors . Frequency of Sahelian storm initiation enhanced over mesoscale soil-moisture patterns. Nat. Geosci. 2011; 4: 430–433.
- Tiedtke M . A comprehensive mass flux scheme for cumulus parameterization in large-scale models. Mon. Wea. Rev. 1989; 117: 1779–1800.
- Valcke S. , Craig T. , Coquart L . OASIS3-MCT User Guide, OASIS3-MCT 2.0. 2013; France: Toulouse. Technical Report TR/CMGC/13/17, CERFACS/CNRS SUC URA No 1875.
6. Appendix
Moisture convergence (C) is calculated based on the precipitation amount (P), the evaporation flux (E) (positive upward), and the vertical integrated water content (IWV), using the equation from Hagemann et al. (Citation2004):
For example, to calculate C for 17 July, dt=1 day, C=(IWV(0:00, 18th) – IWV(0:00, 17th))/86400 s+P (daily 17th) –E (daily 17th).