
Abstract
Changes in Arctic clouds during boreal winter (December through February) and their relationship with sea ice and atmospheric conditions in recent decades have been examined using satellite and reanalysis data, and they are compared with output data from atmospheric general circulation model (AGCM) experiments. All the datasets used in this study consistently show that cloud amount over the Arctic Ocean (north of 67°N) decreased until the late 1990s but rapidly increased thereafter. Cloud increase in recent decade was a salient feature in the lower troposphere over a large part of the Arctic Sea, in association with obvious increase of lower tropospheric temperature and moisture. The comparison between the two periods before and after 1997 indicates that interannual covariability of Arctic clouds and lower tropospheric temperature and moisture was significantly enhanced after the late 1990s. Large reduction of sea ice cover during boreal winter decreased lower tropospheric static stability and deepened the planetary boundary layer. These changes led to an enhanced upward moisture transport and cloud formation, which led to considerable longwave radiative forcing and, as a result, strengthened the cloud–moisture–temperature relationship in the lower troposphere. AGCM experiments under reduced sea ice conditions support those results obtained by satellite and reanalysis datasets reproducing the increases in cloud amount and lower tropospheric temperature and their enhanced covariability.
1. Introduction
The existence of clouds has immediate impacts on the surface radiation balance. Clouds tend to warm the surface by absorbing and re-emitting longwave radiation from the Earth's surface while having a cooling effect by reflecting incoming shortwave radiation from space. This radiative property of clouds is important for the Arctic climate and its changes (e.g. Curry et al., Citation1996; Choi et al., Citation2014). Clouds cover the Arctic region by more than 50 % throughout the year (Eastman and Warren, Citation2010a), interacting with various atmospheric and oceanic variables (Francis and Hunter, Citation2006; Schweiger et al., Citation2008). During boreal winter (December through February), the net cloud radiative forcing (CRF) at the Arctic surface is about 20 W m−2 despite nearly zero incoming solar radiation, which is due to the strong longwave radiative effect of Arctic clouds (Shupe and Intrieri, Citation2004). Therefore, the surface temperature in the Arctic during winter is affected considerably by clouds. Wang and Key (Citation2003) reported that both Arctic clouds and surface temperature have decreased by 5.7 % decade−1 and 0.34 K decade−1, respectively, for the period 1982–1999 according to the Extended Advanced Very High Resolution Radiometer (AVHRR) Polar Pathfinder (APP-x) data. By analysing the same satellite observation, Liu et al. (Citation2009) found that changes in Arctic clouds accounted for surface cooling of 0.91 K decade−1 for the period of 1982–2004.
Meanwhile, Arctic clouds are greatly affected by surface conditions. Curry et al. (Citation1996) showed that the formation of Arctic clouds can be boosted by enhanced turbulent heat fluxes from the surface and subsequent horizontal and vertical convergence of moisture and energy, suggesting a positive feedback effect to the surface temperature. Vavrus (Citation2004) argued that this positive feedback process plays a crucial role in amplifying Arctic warming under increased greenhouse forcing. Other studies noted that variation of Arctic winter clouds in recent decades was strongly influenced by large-scale atmospheric circulation in addition to the radiative feedback effect. Liu et al. (Citation2007) showed that moisture convergence induced by large-scale atmospheric circulation changes over the Nansen Basin and the Barents and Kara Seas had significant impacts on Arctic clouds over the period 1982–2000. Eastman and Warren (Citation2010b) indicated that clouds in the Arctic are strongly associated with the variation of Arctic Oscillation (AO).
Since the late 1990s, the Arctic climate has been exposed to radical changes. The accelerated melting of sea ice and the associated ice–albedo feedback has led to considerable warming throughout the Arctic troposphere (Screen and Simmonds, Citation2010a) and has even caused hemisphere-scale atmospheric circulation changes (Francis et al., Citation2009; Overland and Wang, Citation2010; Kim et al., Citation2014; Kug et al., Citation2015). These changes are conspicuous especially during early winter (Screen and Simmonds, Citation2010b). Numerous studies have identified clouds as a possible cause of Arctic amplification in the winter owing to their positive radiative (i.e. longwave) feedback (Graversen et al., Citation2008; Graversen and Wang, Citation2009; Palm et al., Citation2010).
Although the role of Arctic sea ice loss and the corresponding changes in Arctic clouds in the melting season have been investigated intensively (e.g. Schweiger et al., Citation2008; Kay and Gettelman, Citation2009; Palm et al., Citation2010; Cuzzone and Vavrus, Citation2011), few studies have taken the freezing season into account. It has been suggested that the convective cloud feedback can be activated even during winter under sea ice loss associated with global warming conditions (Abbot and Tziperman, Citation2009; Leibowicz et al., Citation2012). However, the recent Arctic changes that occurred during winter in association with the effect of clouds remain poorly understood. For example, the role of downward longwave radiation on the relationship between clouds and sea ice during the freezing season has been recently examined (Park et al., Citation2015). Extremely cold, dry and windy conditions in Arctic winter lead to large detection errors in cloud observation and large uncertainties in the proper modelling of Arctic clouds. Therefore, large discrepancies occur in the interannual variation and even long-term trends of cloud cover observations among various satellites and surface measurement data, particularly during the freezing season (Eastman and Warren, Citation2010a).
Several previous studies have analysed the characteristics of cloud data in reanalysis products. Schweiger et al. (Citation2008) used cloud data from the European Centre for Medium-Range Weather Forecast (ECMWF) re-analysis (ERA-40; Uppala et al., Citation2005) to investigate the relationship between sea ice and cloud cover during boreal autumn. Walsh et al. (Citation2009) compared the fraction and radiative forcing of Arctic clouds estimated from four different reanalysis datasets with an observational dataset from the Atmospheric Radiation Measurement Program (Stokes and Schwartz, Citation1994). They demonstrated that the reanalysis models can effectively simulate CRF when the cloud amount is simulated appropriately. In the present study, reanalysis data are used to examine the long-term changes in satellite-retrieved Arctic clouds for the recent decades and coherent changes in major atmospheric variables such as temperature and moisture.
To supplement the results from reanalyses and satellites, we adopt an atmospheric general circulation model (AGCM). Numerical models have been widely used to examine Arctic clouds and their impacts on the climate system. For example, a radiative-turbulent model is used to study the annual cycles of low clouds over the Arctic Ocean (Beesley and Moritz, Citation1999), and a general circulation model is used to examine the feedback process related to Arctic clouds (Vavrus, Citation2004) in addition to the effect of convective cloud feedback on sea ice melting under conditions of high CO2 concentration (Abbot et al., Citation2009). Moreover, the Coupled Model Intercomparison Project (CMIP) contributes to a large part of our current understanding of Arctic clouds (e.g. Vavrus et al., Citation2009; Karlsson and Svensson, Citation2011; Koenigk et al., Citation2013; Pithan et al., Citation2014). Thus, modelling can compensate for uncertainty in reanalysis datasets.
Our focus in this study is to investigate recent Arctic cloud changes and their relationship with Arctic warming and sea ice reduction during boreal winter. In particular, this study examines the interannual variation of Arctic clouds for the winters of three recent decades by comparing two reanalysis datasets with satellite observations. In addition, AGCM experiments are performed to support the results from the reanalyses and satellites. Section 2 describes the reanalysis and satellite data in addition to the statistical and modelling methods used. The results follow in section 3, which examines long-term changes in clouds, sea ice, surface temperature and atmospheric conditions in addition to changes in the relationships among these variables during recent decades as well as a possible underlying mechanism. The AGCM modelling results for recent changes in Arctic clouds and atmospheric conditions are also presented in section 3. In section 4, a discussion and conclusion are provided.
2. Data and methods
The ERA-Interim reanalysis (Dee et al., Citation2011), the recent ECMWF reanalysis, covers the period from January 1979 to the present. The ERA-Interim reanalysis is produced by the ECMWF Integrated Forecasting System with a horizontal resolution of about 80 km (T255) and 60 vertical levels and provided with multiple resolution dataset for users. In this study, a dataset with medium horizontal resolution of 1.5°×1.5° and 37 vertical levels was used. In ERA-Interim, notable improvements have been made in the hydrological cycle by updating the data assimilation system to include rain-affected special sensor microwave image radiances with updated cloud and convection schemes. In addition, a new bias correction to satellite radiances has led to improvement in accurately representing the magnitude and vertical structure of temperature with respect to radiosonde observations over the Arctic (Dee and Uppala, Citation2009). These improvements enhance the performance of ERA-Interim in simulating accurate amounts and properties of clouds in the Arctic (Walsh et al., Citation2009; Dee et al., Citation2011).
The National Centers for Environmental Prediction (NCEP) Climate Forecast System Reanalysis (CFSR; Saha et al., Citation2010), a new reanalysis recently developed by NCEP, covers the period from the January 1979 to December 2009 with 37 vertical levels. NCEP CFSR is produced by a coupled forecast system model that has a horizontal resolution of about 38 km (T382) and hybrid vertical sigma coordinate with 64 levels. Compared with the previous version of NCEP reanalysis, NCEP CFSR offers improvements in data quality by introducing a new satellite bias correction method with direct assimilation of radiances and in prognostic cloud water from condensation based on diagnostic cloud cover (Saha et al., Citation2010). The improved performance of the cloud data in the reanalysis from the NCEP in the Arctic region has been evaluated in NCEP North American Regional Reanalysis (NARR; Mesinger et al., Citation2006), which has 32 km horizontal resolution but covers a limited area of the Arctic (Walsh et al., Citation2009). We used 2.5°×2.5° horizontal resolution in the present study.
For validation of the reanalysis data, we used cloud and surface temperature from two long-term satellite observations: APP-x (Wang and Key, Citation2005a) and the Television and Infrared Observation Satellite Operational Vertical Sounder (TOVS) Polar Pathfinder (TPP; Schweiger et al., Citation2002). These data were utilised in many previous studies on Arctic clouds due to their length (Wang and Key, Citation2003; Wang and Key, Citation2005a; Liu et al., Citation2006; Liu et al., Citation2007; Liu et al., Citation2008; Liu et al., Citation2009; Eastman and Warren, Citation2010a). The APP-x composites are a collection of products for both poles, consisting of calibrated satellite channel data and derived parameters at a 25 km spatial resolution. Skin temperature, cloud mask and clear sky surface albedo are provided from five AVHRR channels for 1982–2013. APP-x provides daily composites at 04:00 and 14:00 local solar time (LST). We used monthly cloud and surface skin temperature data averaged from only 14:00 LST in the daily dataset because they are very similar to those at 04:00 LST. The TPP dataset is another long-term satellite observation including atmospheric temperature, water vapour, skin surface temperature, total effective cloud fraction, cloud top pressure and temperature. Data are available for 1980–2005 with a resolution of 100 km. We used monthly cloud and surface skin temperature based on 14:00 LST daily values. Basic statistics such as mean, standard deviation and trends of the two reanalysis data were compared with those from satellite-based observations.
To examine whether abrupt changes occurred in the Arctic climate, the change point analysis proposed by Tomé and Miranda (Citation2004) was applied to major analysis variables such as total cloud cover, surface temperature and sea ice cover during boreal winter for the last three decades. The change point analysis uses a least-squares approach to find the best set of connected straight lines which have constraints minimising the number of breakpoints and the trend change at each break point. Thus, this analysis was necessary because any changes in cloud–sea ice relationships in an interannual time scale may significantly differ before and after the abrupt changes. To examine recent changes in clouds and their relationships with sea ice and environmental atmospheric conditions from satellite and reanalysis datasets, we performed partial correlation analysis and regression analysis.
In addition to statistical analysis, AGCM experiments were performed. For these experiments, we used the National Center for Atmospheric Research (NCAR) Community Atmospheric Model version 3 (CAM3; Collins et al., Citation2004), which is the atmospheric component of the Community Climate System Model version 3 (CCSM3; Collins et al., Citation2006). Present study utilised CAM3 with a finite volume dynamical core of 2°×2.5° horizontal resolution. For more realistic cloud amount simulation, we adopted the modified cloud amount parameterisation for Arctic clouds suggested by Vavrus and Waliser (Citation2008), which is currently used in recent versions of CAM (Neale et al., Citation2011; Neale et al., Citation2012). Further details of the experimental design are described with the experimental results in the following section.
3. Results
3.1. Interannual variations and trends
We examined overall changes in total cloud cover, surface temperature and sea ice cover during boreal winter over the Arctic Ocean (oceanic and sea ice covered regions in the north of 67°N), and the AO index for the last three decades (). For the total cloud cover, fractional cloud cover is provided by ERA-interim as an analysis field (Berrisford et al., Citation2009) and by NCEP CFSR as a forecast field (Saha et al., Citation2010). TOVS provides total cloud cover in the effective cloud fraction, which tends to have minimum residual or radiance differences between the observation and calculation (Schweiger et al., Citation2002). APP-x uses the cloud mask from 0 to 100 based on the frequency of cloud occurrence in a given month. The mean, standard deviation and trend in total cloud cover and surface temperature from all datasets used are summarised in Table and 2 , and the correlations among total cloud cover are summarised in .
Fig. 1 Time series of (a) cloud amount, (b) surface temperature, (c) sea ice cover over the Arctic Ocean (north of 67°N) and (d) Arctic Oscillation (AO) index in winter (December through February) from ERA-Interim, NCEP CFSR, APP-x and TPP datasets. Long-term trends are denoted with dashed lines. The time series of cloud amount, surface temperature and sea ice cover are re-scaled to adopt the mean and standard deviation of ERA-Interim for comparison.
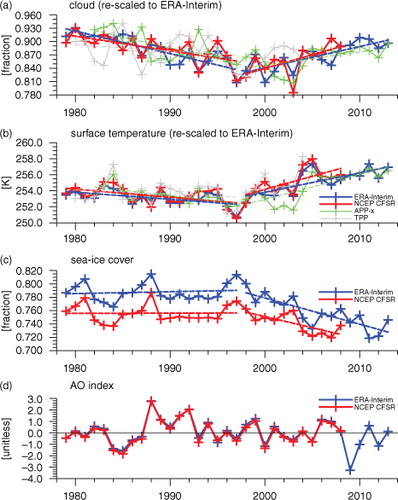
Table 1. Winter (December to February) mean, standard deviation and trends of total cloud fraction over the Arctic Ocean (north of 67°N) in each dataset
Table 2. Same as except for surface temperature
Table 3. Correlation coefficients among datasets used in this study
Interannual variations of the total cloud cover from the two reanalysis datasets agree fairly well with each other (correlation coefficient r=0.82 for 1982–2004), but those from satellite datasets seem to have almost no relationship (r=−0.03 for 1982−2004). By considering large differences in the mean and variability of cloud and surface temperature among the datasets (), each time series in was re-scaled to adopt the mean and standard deviation of ERA-Interim for 1979–2013. The most notable feature of the Arctic cloud amount variation is the change in long-term trend that occurred around the end of the 20th century, which shows a negative trend in the 1980s and 1990s but a positive trend thereafter. Although the interannual variation of the Arctic cloud amounts exhibits little consistency between reanalysis and satellite datasets, the negative trends before the late 1990s agree fairly well among the two reanalysis data and satellite observations. The reanalyses and satellite data show similar positive trends after the late 1990s or the early 2000s, including a similar upward trend until 2005 from TPP data. The variations in surface temperature and sea ice cover are negatively correlated, with r=−0.86 and −0.80 in ERA-Interim and NCEP CFSR, respectively. It should be noted that the surface temperature and sea ice cover in the Arctic began to exhibit a notable trend around the late 1990s. A weak decreasing (increasing) or nearly neutral trend in surface temperature (sea ice cover) was present in the 1980s through the late 1990s, although a rapidly increasing (decreasing) trend occurred in the late 1990s through 2013. These results were provided by both reanalysis datasets. The TPP dataset showed a similar long-term trend in surface temperature, which may be attributed to TOVS data assimilated into ERA-Interim (Dee et al., Citation2011). In contrast to surface temperature and cloud amount, the AO index did not show clear trend changes in the late 1990s.
We then used change point analysis to determine whether long-term trend changes actually existed in the variables. The cloud amount, surface temperature and sea ice cover showed breakpoints of the trend in the late 1990s. The trends in cloud amount changed in 1997 for NCEP CFSR and 2000 for ERA-Interim; those in surface temperature and sea ice cover occurred in 1997 and 1998, respectively. Considering these trend changes, we divided the entire period into two periods: the late 20th century, 1979–1997 (L20C), and the early 21st century, 1998–present (E21C).
The spatial distributions of linear trends in clouds over the Arctic changed distinctly between L20C and E21C (a vs. b, and e vs. f). ERA-Interim showed a significant decrease in cloud amount over the Kara Sea, Laptev Sea, East Siberian Sea, Canadian Arctic Archipelago and central Arctic for the L20C period. NCEP CFSR showed a decrease in cloud similarly, although the tendency was overall weaker than that in ERA-Interim. Both satellite datasets also indicated decreases over the most Arctic regions for L20C (not shown). In E21C, both reanalysis datasets showed increasing cloud amounts over the most of the Arctic Ocean, although the regions of large increase differed slightly between the two. ERA-Interim showed significantly increasing trends over the Kara Sea, Laptev Sea, East Siberian Sea, Canadian Arctic Archipelago and Baffin Bay; these trends were weaker in NCEP CSFR. The difference in significant areas between the two reanalysis datasets might be attributed partly to the difference in analysis period: 1998−2013 for ERA-Interim and 1998−2008 for NCEP CFSR.
Fig. 2 Trends in wintertime (a, b, e, f) total cloud amount and (c, d, g, h) surface air temperature during the late 20th century (1979–1997) and early 21st century (1998–present) from the ERA-Interim and NCEP CFSR. Stippled region indicates trends significant at the 95 % confidence level. Oblique and cross-checked regions in SAT plots indicate regions of increased (decreased) sea ice cover above (below) 0.2 % year−1 and 0.5 % year−1, respectively.
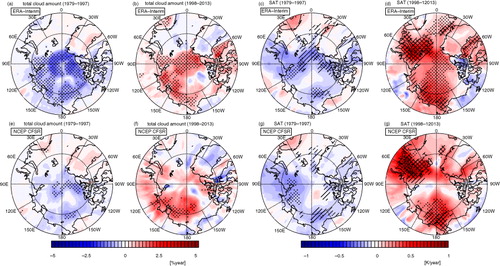
Surface air temperature (SAT, 2-m air temperature) over the Arctic Ocean showed a clear trend change between two periods. The change rates of cloud amount and SAT were comparable over the Arctic Ocean (c vs. d and g vs. h). During L20C, both reanalysis data showed a cooling trend over the Arctic Ocean, significantly over the central Arctic, Canadian Arctic Archipelago, East Siberian Sea and Chukchi Sea. In E21C, SAT showed a prominent warming signal over most of the Arctic Ocean. Significant warming trends were indicated over the Kara, Barents, East Siberian and Chukchi seas in both reanalysis data (d and h). It should be noted that most of these regions experienced large reductions in sea ice.
The vertical distributions of zonal-averaged temperature, specific humidity and cloud water content over the high latitudes showed gradual decreasing trends during L20C and large increasing trends during E21C (). Although the vertical distributions in temperature from the two reanalysis products slightly differ during L20C, a cooling trend was dominant in the lower troposphere over the Arctic. This weak cooling trend changed to a substantial warming trend, particularly near the surface at 75°N during E21C. A strong increasing tendency was also found for specific humidity. During E21C, vigorous moistening occurred in the lower to mid-troposphere (~700 hPa) over the high latitudes and Arctic regions. Changes in clouds were observed mainly in the lower troposphere, similar to the changes in humidity. Cloud water content during L20C decreased near the surface in 70°N–90°N. During E21C, an explosive increase in cloud water content occurred in the lower troposphere over most of the Arctic region, which may be a consequence of enhanced advection into the Arctic region in the E21C winter.
Fig. 3 Trends in zonal-averaged (a, b, e, f) wintertime temperature (shading) and specific humidity (contour), (c, d, g, h) cloud water content (shading) and (c, d) fractional cloud cover (contour) during the late 20th century (1979–1997) and early 21st century (1998–present) from the ERA-Interim and NCEP CFSR. Dashed contour lines indicate negative values.
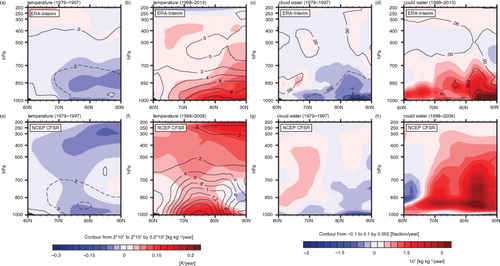
The trend in cloud water in E21C is completely different from that in L20C in terms of the sign and vertical extent. The spatial pattern in cloud water content change more closely resembled that of humidity than that of temperature. This result is consistent with previous studies that note the moisture inflow to the Arctic can be attributed primarily to cloud variation (Curry et al., Citation1996; Beesley and Moritz, Citation1999; Liu et al., Citation2007). We examined the contribution of northward moisture transport at 67°N to Arctic humidity, and we confirmed that the variation in total moisture inflow to the Arctic at 67°N with height resembles that in Arctic humidity (not shown). Obviously, the northward moisture transport largely intensified after the winter of 1997–1998.
The tendency of vertical extension in cloud water content implies that the formation of cloud types other than stratiform can be enhanced. The possibility of increasing non-stratiform clouds in relation to sea ice reduction has been suggested by previous studies. Eastman and Warren (Citation2010b) used long-term surface observations to determine that the increasing formation of cumulonimbus and stratus clouds over the Arctic Ocean is correlated with sea ice reduction even in winter. The increases in these cloud types are greater under low ice winters than those in high ice winters. Thus, considering the recent substantial reductions in sea ice, the increase in cloud water content during E21C might have increased the numbers of low-level stratus clouds at ~900 hPa and cumulonimbus clouds above ~900 hPa.
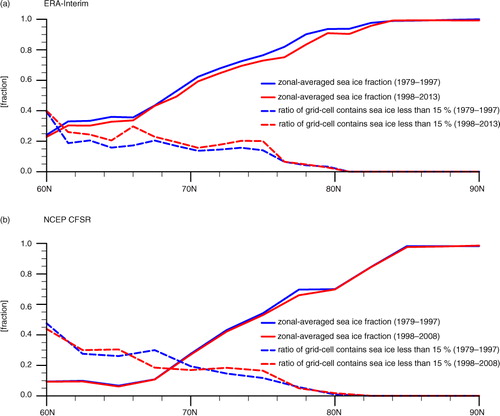
Zonal-averaged sea ice cover and ratio of grid-cell that contains sea ice fraction less than 0.15 to grid-cell that contains sea ice at the same latitude show that the recent changes in temperature, moisture and cloud might be closely related to sea ice reduction (). During E21C, zonal-averaged sea ice cover decreases over the region of south of 82°N (80°N in NCEP CFSR) compared to L20C. In particular, increase in regions where sea ice fraction is less than 0.15 appears near 70°N–75°N. More heat and moisture might be released from opened ocean over this region and contribute to recent change in temperature, moisture and cloud.
Fig. 4 Wintertime zonal-averaged sea ice cover and ratio of grid cell contains grid-cell that contains sea ice fraction less than 0.15 to grid-cell that contains sea ice in same latitude during the late 20th century (1979–1997) and early 21st century (1998–present) from (a) ERA-Interim and (b) NCEP CFSR.
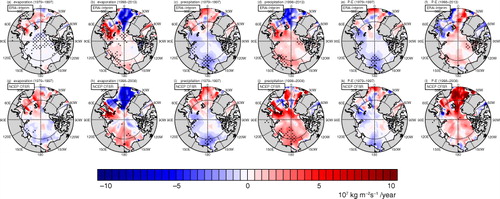
displays the linear trends in surface evaporation and precipitation over the Arctic Ocean during L20C and E21C. Both evaporation (a, b, g and h) and precipitation (c, d, i and j) showed decreasing tendencies during L20C and increasing tendencies during E21C over most of the Arctic Ocean. This result is similar to the temperature and cloud amount. In both periods, the trend in precipitation is greater than that of evaporation over Laptev and East Siberian Seas (e, f, k and l), which implies that the formation of precipitating clouds is contributed by the moisture transport from lower latitudes as well as local increases in evaporation over this region. During E21C, the spatial distributions of the trends in evaporation and precipitation were almost analogous. Significant increases in both variables were shown over the Laptev and East Siberian seas in ERA-Interim. The total cloud cover increased significantly in these regions (). This correspondence was weaker during L20C, suggesting that the local hydrological cycle was enhanced during E21C. In this process, the relationship between cloud and surface condition might have been closer, such as that between SAT and cloud in E21C (). The correlation coefficient between SAT and cloud amount averaged over the Arctic Ocean was greater in E21C than that in L20C, with r=0.81 and 0.68 in ERA-Interim and r=0.66 and 0.42 in CFSR, respectively. Furthermore, the linear trends in total cloud cover and surface skin temperature in E21C were also larger than those in L20C (Table and 2 ). The major underlying physics for the concurrent changes in SAT and cloud cover may be longwave CRF (Wang and Key, Citation2005a; Liu et al., Citation2008) and surface turbulent fluxes (Curry et al., Citation1996; Beesley and Moritz, Citation1999). Thus, these mechanisms might be responsible for enhanced local hydrological cycles, which may have contributed to strengthening the relationship among SAT, clouds, sea ice and large-scale circulation during E21C. In addition, improving data, which contribute to the reanalysis, can also contribute to the strengthening of the relationship.
Fig. 5 Trends in wintertime (a, b, g, h) evaporation, (c, d, i, j) precipitation and (e, f, k, l) their difference (precipitation minus evaporation) during the late 20th century (1979–1997) and early 21st century (1998–present) from the ERA-Interim and NCEP CFSR. Stippled region indicates trends significant at the 95 % confidence level.
3.2. Effects of sea ice reduction on Arctic clouds and their changes
As shown in , a strong decline in sea ice cover in contrast to weak changes in AO index occurred during E21C, which might imply that the recent change in Arctic clouds can be linked more to the changes in sea ice cover than AO. Because changes in sea ice can affect the formation of clouds by modulating moisture and heat flux at the surface, we first examined the changes in cloud water content and upward moisture transport in relation to sea ice cover during the two periods. To minimise the AO effect in examining the effect of sea ice reduction, we calculated the partial correlation between the sea ice cover averaged over the Arctic Ocean and the zonal averaged cloud water content/upward moisture transport independent of the AO index during L20C and E21C.
Cloud water content in the troposphere was associated with sea ice cover over the Arctic Ocean for both L20C and E21C (). In particular, cloud water content below 700 hPa was closely linked to surface conditions. As previously mentioned, the combination of surface evaporation, horizontal moisture flux and longwave CRF is responsible for this binding in the lower troposphere (Beesley and Moritz, Citation1999; Shupe and Intrieri, Citation2004). However, the relationship between sea ice over the Arctic Ocean and cloud water content (or upward moisture transport) over the central Arctic might be stronger for E21C. In the lower troposphere, the significantly correlated region over the Arctic margin during L20C moved to the central Arctic during E21C. Accordingly, a significant correlation between cloud water content and sea ice reduction at most of the troposphere over the Arctic margin (70°N–80°N) during L20C disappeared in E21C. Cloud water content above 700 hPa over the central Arctic (80°N–90°N) was positively (negatively) correlated to sea ice during L20C (E21C) (a and c), which is similar to the cloud water content at the Arctic margin (b and d). In particular, during E21C, the effect of sea ice on clouds in the lower troposphere over the central Arctic was reinforced, whereas the effect on the upper troposphere over the Arctic became weaker.
Fig. 6 Partial correlations of sea ice cover averaged over the Arctic Ocean (north of 67°N) with zonal averaged cloud water content (shading) and mean upward moisture transport (contour) independent of the Arctic Oscillation (AO) index during the late 20th century and the early 21st century from the ERA-Interim and NCEP CFSR. Stippled (cross-checked) regions indicate that values with shading (contour) are significant at the 95 % confidence level. Dashed contour lines indicate negative values.
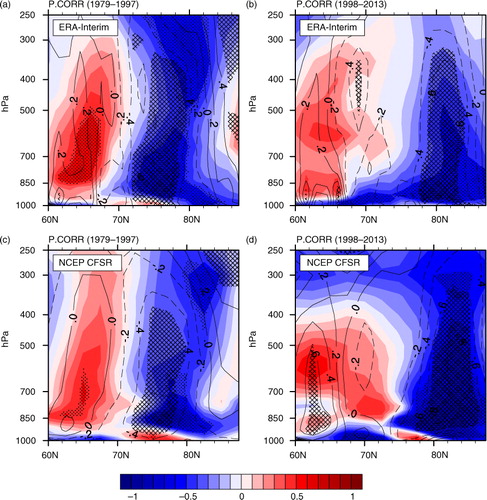
Vertical moisture transport appears to have played an important role in the relationship of sea ice cover and cloud water content (). During L20C, the upward moisture transport was positively correlated with sea ice reduction over the Arctic margin and negatively correlated over the central Arctic. It is thus plausible that the condition of less ice coverage on the surface is linked to the increase in cloud water content through upward moisture transport. In addition, the significant linkage among sea ice reduction, cloud water content and vertical moisture flux near the tropopause suggests the possibility that this linkage is bounded by a large-scale atmospheric circulation. During E21C, the influence of sea ice variation on vertical moisture transport was found to move toward higher latitudes (75°N–90°N). The northward expansion of the correlated region is also indicated in the cloud water content.
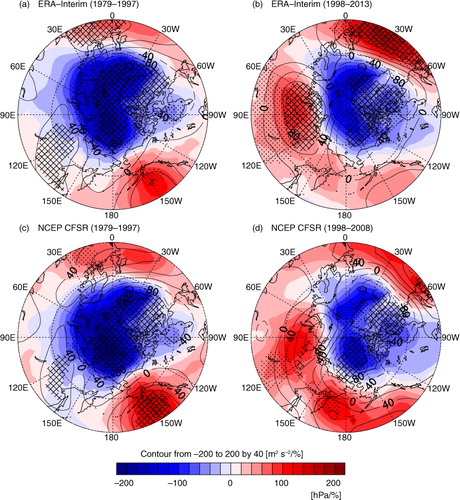
The enhanced upward moisture transport over this region might have contributed to an increase in cumulonimbus clouds over the Arctic. At the surface, a decrease in static stability and deepening of the planetary boundary layer (PBL) could have contributed to this change as suggested by Schweiger et al. (Citation2008) and Jaiser et al. (Citation2012). In particular, Jaiser et al. (Citation2012) noted that a decrease in static stability and a developing baroclinic system related to sea ice reduction can promote the occurrence of storms and cyclones over the central Arctic. The differences in surface and atmospheric conditions between E21C and L20C support these assertions (). The 850 hPa thickness and PBL height for E21C were found to be larger than those for L20C over most of the Arctic Ocean (a, b, e and f). In particular, both reanalysis datasets showed that the Barents Sea, where sea ice cover was reduced substantially during E21C, experienced significant changes in PBL height. These results indicate that sea ice reduction induces an increase in PBL height and a decrease in static stability even during winter and might also enhance the upward moisture transport.
Fig. 7 Differences in (a, e) 850 hPa thickness (shading) and surface air temperature (contour), (b, f) planetary boundary layer (PBL) height (shading) and sea ice fraction (contour), (c, g) longwave cloud radiative forcing (shading) and cloud amount (contour), and (d, h) sea level pressure (shading) and 500 hPa geopotential height (contour) between averages for the early 21st century and the late 20th century. Stippled region indicates differences in shading values significant at the 95 % confidence level. Dashed contour lines indicate negative values.
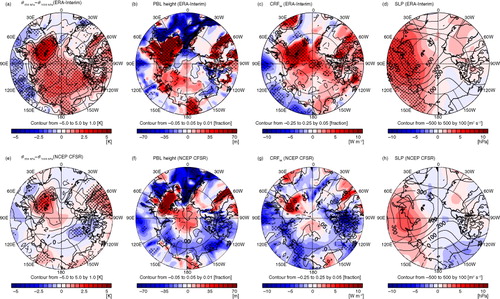
The two reanalysis datasets showed slightly different features over the Arctic Ocean except for the Barents Sea. ERA-Interim showed that atmospheric thickness expansion during E21C was significant over most of the Arctic Ocean and that the PBL height increased over the Eurasian margins of the Arctic Ocean (a and 7b). NCEP CFSR showed that such increases were limited near the Barents Sea (e and f). Although the sea ice retreat lasted 3 yr longer in ERA-Interim than that in NCEP CFSR, the latter had less sea ice cover over the Arctic during L20C (c). Consequently, the amount of reduced sea ice was smaller and the surface change was weaker during E21C in NCEP CFSR than that in ERA-Interim. Despite this discrepancy, the significant relationship between sea ice retreat and near-surface change was consistent in both datasets. The increases in PBL height and atmospheric thickness were mainly found in sea ice melt regions in each dataset (b and f). Therefore, this difference appears to be due mainly to sea ice.
The alterations in surface condition and cloud amount could have resulted in changes in the radiative effects of clouds on the surface. c and 7g presents the differences in CRF between L20C and E21C. Both datasets show that a significant increase in CRF during E21C occurred over the Barents Sea. This region has also experienced substantial surface warming and surface condition changes owing to sea ice reduction. The surface warming indicates that outgoing longwave radiation and CRF increased. In addition, the increased cloud amount may have increased CRF in the longwave radiation to warm the surface. On the contrary, a large discrepancy between the two datasets was also found in CRF over the Arctic Ocean except for the Barents Sea, which is similar to PBL height and atmospheric thickness. This result also appears to be linked to differences in the changes in sea ice cover between the two datasets.
The differences in sea level pressure and 500 hPa geopotential between the two periods reflect the enhanced development of a high-pressure system across the Eurasian side of the Arctic Ocean and the Eurasian continent (d and h). A significant change in sea level pressure appeared over the Eurasian continent around 90°E in only ERA-Interim, and the 500 hPa geopotential height near this region also showed large increases during E21C. The larger differences in ERA-Interim are likely relevant to the differences in sea ice cover between the datasets. It has been suggested that the development of winter high pressure over the Eurasian continent around 90°E is linked to sea ice melt (Jaiser et al., Citation2012). The recent dipole-like atmospheric structure over the Arctic could have contributed to modifications in large-scale circulation patterns (Overland and Wang, Citation2010). Thus, the recent change in vertical moisture transport may be associated with this pressure system change.
The overall changes in the Arctic climate between two periods could have induced the changes in cloud impact. shows the regression of detrended zonally averaged air temperature and specific humidity onto low-level cloud cover (below about 750 hPa; following the definition of low-level cloud by the NCEP CFSR) over the Arctic Ocean. Here, we selected low-level clouds because they strongly account for total cloud cover and have strong radiative effects at the surface (Intrieri et al., Citation2002; Shupe and Intrieri, Citation2004; Eastman and Warren, Citation2010b). Overall, the underlying positive relationship between clouds and SAT in the two periods was found to be similar. However, an important difference was noted between two periods. During L20C, low-level clouds in the Arctic were positively correlated with lower tropospheric (below 700 hPa) temperature mainly over the southern part of the Arctic (60°N–75°N) rather than the central Arctic. During E21C, the centre of temperature correlated with clouds moved to the higher latitudes north of 70°N and strengthened. The atmospheric moisture also exhibited positive correlation with the low-level clouds. Moreover, the positive correlation between low-level clouds and temperature vertically extended to the middle to upper troposphere above 500 hPa. That is, the local connection among clouds, temperature and moisture over the Arctic strengthened significantly in E21C.
Fig. 8 Regression of winter low-level cloud amount averaged over the Arctic Ocean (north of 67°N) onto zonally averaged temperature (shading) and specific humidity (contour) during the late 20th century (1979–1997) and early 21st century (1998–present) from the ERA-Interim and NCEP CFSR. Trends are removed from the raw data before calculating the regression coefficients. Stippled and cross-checked regions indicate regression significant at the 95 % confidence level. Dashed contour lines indicate negative values.
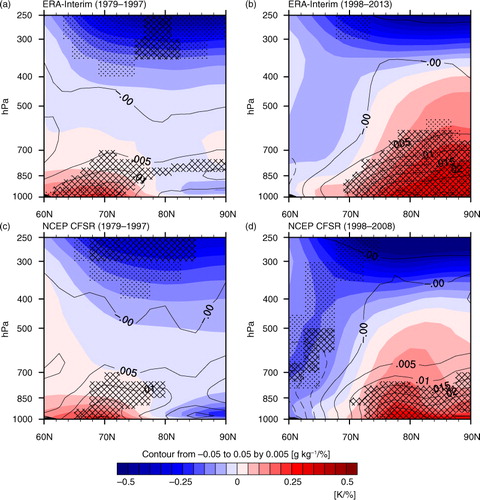
The relationship between low-level clouds and atmospheric conditions in L20C (a and c) might reflect the mechanism between Arctic clouds and moisture convergence over the marginal Arctic suggested by Liu et al. (Citation2007). Arctic low clouds showed the strongest correlation with subarctic moisture and temperature; this pattern appears to represent the influence of northward moisture fluxes to the Arctic. During E21C, however, changes in the pattern of strengthened local connection (b and d) imply that clouds might be more closely associated with profound changes in the Arctic climate system for this period such as explosive warming and moistening associated with accelerated melting of sea ice. The strong surface warming would have caused lower tropospheric warming, and sea ice reduction might have reinforced moistening by increased evaporation to a larger degree over the central Arctic region. The warming and moistening in the lower troposphere associated with melting sea ice might have significantly reduced the atmospheric stability. Consequently, the near-surface warming could have more easily propagated to the mid- to upper troposphere by enhanced turbulent mixing and upward motion. In addition, this might have increased the formation of precipitating clouds and precipitation; thus, the local connection between clouds and temperature/moisture, in turn, was strong over the Arctic. This suggests that the impact of clouds on warming and moistening at the lower troposphere over the local Arctic could have been strengthened the under reduced sea ice conditions.
3.3. AGCM experiments
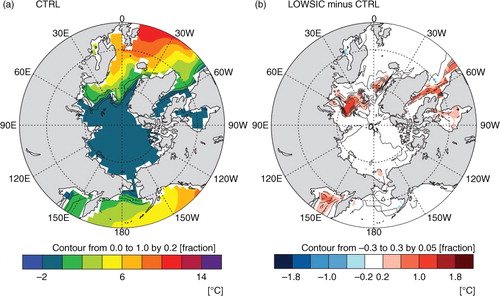
To examine whether sea ice reduction was a key factor in the changes in clouds and their relationships with environmental atmospheric conditions, we performed two 50-year AGCM simulations including baseline and sensitivity experiments. The baseline experiment (hereinafter CTRL) used monthly climatological sea surface temperature (SST) and sea ice concentration from the National Oceanic and Atmospheric Administration Optimum Interpolation version 2 (Reynolds et al., Citation2002) for 1982–2000 under a CO2 concentration of 369 ppmv. The sensitivity experiment (hereinafter LOWSIC) was performed for 50 years under the same CO2 concentration but with a reduced sea ice concentration. The LOWSIC experiment was performed with sea ice concentration in the Arctic averaged over 2006–2010. To focus on the impacts of sea ice loss, the same SSTs used in CTRL (i.e. climatological mean) were prescribed in LOWSIC. Considering the increase in SST over regions in which the sea ice was reduced, however, we prescribed slightly increased SSTs over those regions by using the statistical adjustment method suggested by Jun et al. (Citation2014). shows these boundary conditions of SST and sea ice cover during winter for CTRL and LOWSIC averaged for 1982–2000. In LOWSIC, sea ice cover was reduced over the Barents Sea, Kara Sea, Greenland Sea, Baffin Bay, Chukchi Sea and Sea of Okhotsk. The SSTs over these reduced sea ice regions were about ~1 °C warmer than those in CTRL (b).
Fig. 9 Winter mean sea surface temperature (shading) and sea ice concentration (contour) boundary conditions for (a) the baseline experiment (CTRL) experiment and (b) differences from the sensitivity experiment (LOWSIC) (LOWSIC minus CTRL). Dashed contour lines indicate negative values.
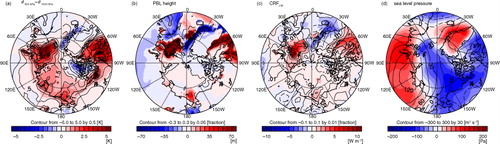
The atmospheric responses to the imposed sea ice reduction from modelling results showed that SAT, atmospheric thickness, PBL height, total cloud amount and longwave CRF increased mainly over the reduced sea ice regions including the Kara, Barents and Chukchi seas (). In LOWSIC, although increases in SAT and atmospheric thickness appeared over most of the Arctic Ocean (a), the PBL height increased mainly over the regions of reduced sea ice (b). The total cloud amount increased over most of the Arctic Ocean; this increase was substantial over the Kara, Barents and Chukchi seas, which also experienced increases in longwave CRF (c). These changes are consistent with the differences between E21C and L20C in the reanalysis datasets (). In addition, the atmospheric pressure system reflected the differences in the reanalysis datasets such that a high-pressure system developed across the Eurasian side of the Arctic Ocean and the Eurasian continent (d).
Fig. 10 Changes in (a) surface air temperature (contour) and 850 hPa atmospheric thickness (shading), (b) sea ice cover (contour) and planetary boundary layer height (shading), (c) total cloud amount (contour) and longwave cloud radiative forcing (shading), and (d) 500 hPa geopotential (contour) and sea level pressure (shading) from the sensitivity experiment (LOWSIC) compared with the baseline experiment (CTRL). Dashed contour lines indicate negative values.
The model experiments successfully capture the strong warming from the lower to mid-troposphere and moistening over the Arctic region associated with sea ice reduction (a). In both experiments, we examined the atmospheric effects of the changes in turbulent heat and moisture fluxes associated with sea ice reduction (b). The diffusive heating over the regions of reduced sea ice (65°N–80°N) warmed the near-surface air; particularly strong diffusive heating occurred around 80°N, where sea ice cover was reduced considerably. In contrast, heating by moistening processes cooled the near-surface air and warmed the air above. The warming by moistening was greatest around 80°N, which suggests that evaporation and convection can occur more frequently over the regions of sea ice reduction, leading to deeper convection over the open ocean. The increase in PBL height and decrease in static stability near the surface by diffusive heating supported the enhanced convective activities.
Fig. 11 Changes in (a) zonal-averaged temperature (contour) and specific humidity (shading), (b) heating by diffusion (contour) and moistening processes (shading), and (c) cloud amount (contour) and regressed temperature of low-level cloud amount over the Arctic (shading) from the sensitivity experiment (LOWSIC) experiment compared with the baseline experiment (CTRL). Dashed contour lines indicate negative values.
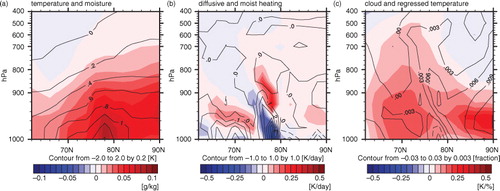
These enhanced moistening and convective activities led to an increase in cloud amount over the Arctic. In LOWSIC, the cloud amount increased over most of the Arctic region. The spatial distribution of cloud increases in LOWSIC closely resembled the heating distribution by moistening processes as shown by shading in b and contours in c. The regions with strong condensation, or heating by moistening, also showed substantial increases in cloud amount. This result supports recent increases in clouds shown above 900 hPa in the reanalysis. Meanwhile, over the central Arctic region, clouds increased largely although the moistening process occurred less. Over this region, the climatological temperature was extremely low, and the increase in moisture was relatively larger than that in temperature (a). These conditions would lead to increases in relative humidity, thus forming additional clouds.
In the regression of detrended zonally averaged air temperature onto low-level cloud cover over the Arctic Ocean, the relationship between clouds and air temperature in LOWSIC was stronger over most of the Arctic region north of 60°N than that in CTRL, as shown by shading in c. In the reanalysis datasets, enhancements in the relationship between clouds and temperature over the central Arctic were stronger during E21C (). Our modelling results effectively reproduced this relationship change over the Arctic during E21C. These results suggest that sea ice reduction could have induced an increase in cloud amount to affect the Arctic winter climate.
4. Discussion and conclusion
The present study has examined long-term variations in clouds and their relationships with atmospheric conditions over the Arctic during winter for the past three decades. Particular emphases are given to the changes occurring early in the 21st century, when sea ice reduction is obvious. Two state-of-the-art reanalysis datasets indicate that the total cloud cover decreased gradually during the late 20th century (L20C) and significantly increased during the early 21st century (E21C), and these cloud changes mainly occurred at lower troposphere. Along with the significant increase of low-level clouds in E21C, the coherence between cloud fraction and low-level temperature and humidity was also enhanced. The change in surface conditions in response to the recently reduced sea ice cover even in winter appears to be the primary cause. AGCM experiments support the observed higher correlation in E21C and indicate the importance of the reduced sea ice cover in explaining the relationship: The reduced sea ice cover increases the surface fluxes and decreases the lower tropospheric static stability. Additional low-level clouds are formed over the open ocean reinforcing the cloud radiative effect and precipitation over the Arctic.
These results, however, might be dependent on the particular choice of the change point, which divides the entire analysis period into the two periods. Indeed, the change point analysis indicated that either 1997 or 2000 could be chosen as the change point. Therefore, we checked the sensitivity of results by choosing the year 2000 as change point and confirmed that the choice of year does not affect our conclusions on the relationship between clouds and atmospheric conditions (not shown).
We compared total cloud fraction from the two reanalysis products with those from APP-x and TPP, which cover the period more than two decades. Because this study focuses on the changes in the interannual cloud variability over longer-term period than a decade, data consistency for the analysis period is important. Therefore, we used satellite datasets covering more than two decades rather than using recent satellite products. Previous studies suggested that these reanalysis and satellite datasets require careful handling due to their uncertainty. Zygmuntowska et al. (Citation2012) reported large discrepancies in winter cloud data between ERA-Interim and recent satellite retrievals such as CloudSat and CALIPSO in a 4-year comparison for 2006–2009 and argued that model-derived cloud data, weakly constrained by observation, should be handled with special care. Eastman and Warren (Citation2010a) also showed that year-to-year variations of wintertime cloud of the APP-x and TPP datasets were largely affected by geographic coherency and this spurious signal could cast the role of Arctic cloud on wintertime surface temperature into doubt.
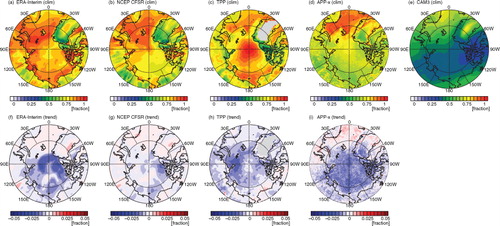
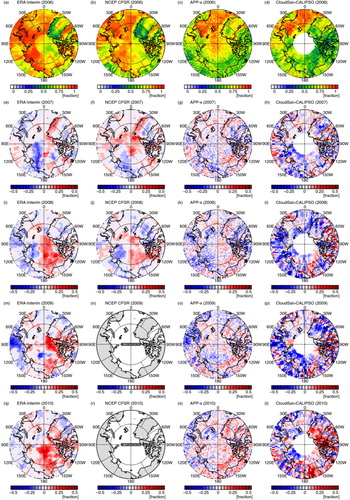
Our study is, therefore, inevitably exposed to these large sources of uncertainties intrinsic to both model and satellite datasets. We tested such uncertainties by examining consistencies and discrepancies among different datasets used in the present study. We first show spatial patterns of total cloud fractions from the two reanalyses and satellite datasets during 1982–1997. Also, total cloud fraction from CTRL run of AGCM model is shown (). As noted by previous studies, the total cloud fractions from multiple data sources show large differences from each other (a–12e). For example, cloud covers of ERA-Interim and TPP tend to cover much broader area of Arctic Ocean compared with other datasets. Detailed comparison between the two datasets also reveals that large discrepancies exist over central Arctic and Kara/Barents Seas. Especially, CAM3 model produces much less cloud amount over most region of Arctic Ocean (e).
Fig. 12 (a, b, c, d, e) Wintertime total cloud amount averaged over period of 1982–1997 from ERA-Interim, NCEP CFSR, TPP, APP-x and CAM3 baseline experiment, and (f, g, h, i) their trends during the same period except for CAM3 baseline experiment.
The conclusion of this study heavily relies on the interpretation of area-averaged quantities over Arctic. The area-averaged cloud fraction from satellite observations should be carefully handled because of spurious signal in winter Arctic clouds from APP-x and TPP as pointed out by Eastman and Warren (Citation2010a). The spurious signal was found over the ocean and land regions in the north of 60°N in Eastman and Warren (Citation2010a). However, according to the comparison between interannual variations over these two regions from surface observations (see of Eastman and Warren, Citation2010a), the spurious signal can be weaker over the Arctic Ocean than the Arctic land. Also, the long-term trend between the ocean and the land is the opposite (see and of Eastman and Warren, Citation2010a) and cannot simply be interpreted together. Therefore, this study focusing only on the ocean area in the north of 67°N may not be affected by the strong spurious signal.
We also compare cloud amount distribution of reanalyses and APP-x datasets with recent satellite observations from CloudSat and CALIPSO (Kay and Gettelman, Citation2009) during the overlapping period of 2006–2010 (). Spatial distributions of total clouds in 2006 from each dataset show large discrepancies (a–13d). Although large cloud amounts over the Barents and Greenland Seas are commonly observed for all datasets, ERA-Interim and CFSR produce larger cloud amounts over the Laptev and East Siberian Seas compared to satellite products. Overall, disagreements of spatial patterns among datasets are similar with the results already shown in the comparison of long-term climatology for 1982–1997 (a–12e). However, as seen from the difference against 2006 (e–13t), reanalysis datasets seem to show consistent interannual variations with satellite observations. Except for region of north of 80°N, where satellite data is missing, spatial distribution of interannual change of cloud from reanalysis datasets agree well with those from APP-x and CloudSat and CALIPSO. In particular, reanalyses and satellite products match well over Chukchi and Beaufort Seas. These consistencies in interannual variabilities between reanalyses and satellite products supplement the credibility of using reanalyses datasets for this study.
Fig. 13 (a, b, c, d) Total cloud amount averaged over winter (December through February) of 2006 from ERA-Interim, NCEP CFSR, APP-x, and CloudSat + CALIPSO, and differences for winter of (e, f, g, h) 2007, (i, j, k, l) 2008, (m, n, o, p) 2009 and (q, r, s, t) 2010 against 2006 from each dataset.
In the results section, we focused on showing that the stronger relationship between cloud and sea ice in E21C is a reliable feature and how the relation is strengthened through physical processes carried out by sea ice and atmosphere within the Arctic. In addition to these local feedback processes, large-scale advective processes are known to contribute to the variation in Arctic clouds (Wang and Key, Citation2005b; Liu et al., Citation2007; Eastman and Warren, Citation2010b) and cloud changes between L20C and E21C could also have been affected by large-scale atmospheric circulation changes. We discuss the interannual relationship between cloud water content and the AO index briefly. Using both reanalyses, we calculated the correlation between AO index and cloud water contents at troposphere. The AO index was positively correlated with cloud water content at the troposphere above 900 hPa and negatively correlated with that near the surface (not shown). Eastman and Warren (Citation2010b) already reported the positive correlation at upper troposphere and the negative correlation near the surface. This contrasting relationship between AO and low-level and upper-level tropospheric clouds hold regardless of selected periods, i.e. L20C or E21C, suggesting that the intrinsic relationship between clouds and AO might not be affected much by recent changes in surface conditions.
Recent studies suggested that sea ice decline leads to negative AO-like condition over the Arctic (Francis et al., Citation2009; Overland and Wang, Citation2010). Coherent relationship between AO and cloud during both L20C and E21C periods suggests that recent negative AO-like atmospheric circulation pattern can be linked to a decrease in cloud water content above 900 hPa over the Arctic. However, our result strongly suggests that the effect of reduced sea ice condition reaches cloud water content at lower troposphere above 900 hPa during E21C. There seems to be a contradiction between these relationships among sea ice, cloud and AO.
The contradiction seems to be attributed to the large changes in the Arctic surface condition between the two periods. In , we showed partial correlation between sea ice and cloud water contents for both periods excluding influence of AO. Shift of the strongest correlation between sea ice and cloud water contents toward the inside of Arctic Circle in E21C was a key difference between L20C and E21C. This major feature does not significantly change even if we consider the AO influence in the calculation. The AO influence does not change spatial patterns in AO-cloud relationship during both periods, but emerges as a smaller correlation coefficient only for L20C compared to partial correlation. This indicates that cloud amount change controlled by AO plays at least minor role in the E21C although we find stronger role of AO in the L20C. Therefore, we can conclude that the relationships among sea ice, cloud and AO are non-stationary.
The change in the AO–cloud relationship also can be examined in the interannual variation of sea level pressure and geopotential height at 500 hPa in association with low-level clouds (). During L20C, both analyses show that the variation in low-level clouds was mainly related to low pressure over most of the Arctic Ocean, which resembles a pressure system in positive phase of AO (a and c). During E21C, however, the variation in low-level clouds was related to high-pressure systems across the Eurasian coastal region and over the North Atlantic Ocean region, in addition to low pressure over the Central and North American side of the Arctic (b and d). This spatial pattern is analogous to the difference between the E21C and L20C shown in d and h and that from modelling results (d). It should be noted that this pattern is far from the typical pressure pattern of negative phase of AO.
Fig. 14 Regression of winter low-level cloud amount averaged over the Arctic Ocean (north of 67°N) showing mean sea level pressure (shading) and geopotential at 500 hPa (contour) during the late 20th century (1979–1997) and the early 21st century (1998–present) from the ERA-Interim and NCEP CFSR. Linear trends are removed before calculating regression coefficients. Stippled and cross-checked regions indicate regressions significant at the 95 % confidence level. Dashed contour lines indicate negative values.
5. Acknowledgments
The authors sincerely thank two anonymous reviewers for a number of fruitful comments and suggestions. This study was supported by ‘Development and Application of the Korea Polar Prediction System (KPOPS) for Climate Change and Weather Disaster (PE16100)’ project and the Polar Academic Program (PD15010) project of the Korea Polar Research Institute (KOPRI).
Related Research Data
References
- Abbot D. S. , Tziperman E . Controls on the activation and strength of a high-latitude convective cloud feedback. J. Atmos. Sci. 2009; 66: 519–529.
- Abbot D. S. , Walker C. C. , Tziperman E . Can a convective cloud feedback help to eliminate winter sea ice at high CO2 concentrations?. J. Clim. 2009; 22: 5719–5731.
- Beesley J. A. , Moritz R. E . Toward an explanation of the annual cycle of cloudiness over the Arctic ocean. J. Clim. 1999; 12: 395–415.
- Berrisford P. , Dee D. , Fielding K. , Fuentes M. , Kallberg P. , co-authors . The ERA-interim archive. ERA Report Series. 2009; 1–16. ECMWF, Reading, United Kingdom.
- Choi Y.-S. , Kim B.-M. , Hur S.-K. , Kim S.-J. , Kim J.-H. , co-authors . Connecting early summer cloud-controlled sunlight and late summer sea ice in the Arctic. J. Geophys. Res. Atmos. 2014; 119: 11087–11099.
- Collins W. D. , Bitz C. M. , Blackmon M. L. , Bonan G. B. , Bretherton C. S. , co-authors . The community climate system model version 3 (CCSM3). J. Clim. 2006; 19: 2122–2143.
- Collins W. D. , Rasch P. , Boville B. , Hack J. , McCaa J. , co-authors . Description of the NCAR Community Atmosphere Model (CAM 3.0). 2004. NCAR Tech. Note NCAR/TN-464+STR. National Center For Atmospheric Research, Boulder, CO, 226 pp.
- Curry J. A. , Rossow W. B. , Randall D. , Schramm J. L . Overview of Arctic cloud and radiation characteristics. J. Clim. 1996; 9: 1731–1764.
- Cuzzone J. , Vavrus S . The relationships between Arctic sea ice and cloud-related variables in the ERA-interim reanalysis and CCSM3. Environ. Res. Lett. 2011; 6: 014016.
- Dee D. P. , Uppala S . Variational bias correction of satellite radiance data in the ERA-interim reanalysis. Q. J. Roy. Meteor. Soc. 2009; 135: 1830–1841.
- Dee D. P. , Uppala S. M. , Simmons A. J. , Berrisford P. , Poli P. , co-authors . The ERA-interim reanalysis: configuration and performance of the data assimilation system. Q. J. Roy. Meteorol. Soc. 2011; 137: 553–597.
- Eastman R. , Warren S. G . Arctic cloud changes from surface and satellite observations. J. Clim. 2010a; 23: 4233–4242.
- Eastman R. , Warren S. G . Interannual variations of Arctic cloud types in relation to sea ice. J. Clim. 2010b; 23: 4216–4232.
- Francis J. A. , Chan W. H. , Leathers D. J. , Miller J. R. , Veron D. E . Winter Northern Hemisphere weather patterns remember summer Arctic sea-ice extent. Geophys. Res. Lett. 2009; 36: L07503.
- Francis J. A. , Hunter E . New insight into the disappearing Arctic sea ice. Eos. Trans. AGU. 2006; 87: 509.
- Graversen R. G. , Mauritsen T. , Tjernstrom M. , Kallen E. , Svensson G . Vertical structure of recent Arctic warming. Nature. 2008; 451: 53–56.
- Graversen R. G. , Wang M. H . Polar amplification in a coupled climate model with locked albedo. Clim. Dynam. 2009; 33: 629–643.
- Intrieri J. M. , Fairall C. W. , Shupe M. D. , Persson P. O. G. , Andreas E. L. , co-authors . An annual cycle of Arctic surface cloud forcing at SHEBA. J. Geophys. Res-Oceans. 2002; 107 SHE 13-11–SHE 13-14.
- Jaiser R., Dethloff K., Handorf D., Rinke A., Cohen J. Impact of sea ice cover changes on the Northern Hemisphere atmospheric winter circulation. Tellus A. 2012; 64: 11595. DOI: http://dx.doi.org/10.3402/tellusa.v64i0.11595.
- Jun S.-Y. , Ho C.-H. , Kim B.-M. , Jeong J.-H . Sensitivity of Arctic warming to sea surface temperature distribution over melted sea-ice region in atmospheric general circulation model experiments. Clim. Dynam. 2014; 42: 941–955.
- Karlsson J. , Svensson G . The simulation of Arctic clouds and their influence on the winter surface temperature in present-day climate in the CMIP3 multi-model dataset. Clim. Dynam. 2011; 36: 623–635.
- Kay J. E. , Gettelman A . Cloud influence on and response to seasonal Arctic sea ice loss. J. Geophys. Res. Atmos. 2009; 114: D18204.
- Kim B.-M. , Son S.-W. , Min S.-K. , Jeong J.-H. , Kim S.-J. , co-authors . Weakening of the stratospheric polar vortex by Arctic sea-ice loss. Nat. Commun. 2014; 5: 4646.
- Kug J.-S. , Jeong J.-H. , Jang Y.-S. , Kim B.-M. , Folland C. K. , co-authors . Two distinct influences of Arctic warming on cold winters over North America and East Asia. Nat. Geosci. 2015; 8: 759–762.
- Koenigk T. , Brodeau L. , Graversen R. , Karlsson J. , Svensson G. , co-authors . Arctic climate change in 21st century CMIP5 simulations with EC-Earth. Clim. Dynam. 2013; 40: 2719–2743.
- Leibowicz B. D. , Abbot D. S. , Emanuel K. , Tziperman E . Correlation between present-day model simulation of Arctic cloud radiative forcing and sea ice consistent with positive winter convective cloud feedback. J. Adv. Model. Earth Syst. 2012; 4: M07002.
- Liu Y. , Key J. R. , Francis J. A. , Wang X . Possible causes of decreasing cloud cover in the Arctic winter, 1982–2000. Geophys. Res. Lett. 2007; 34: L14705.
- Liu Y. H. , Key J. R. , Schweiger A. , Francis J . Characteristics of satellite-derived clear-sky atmospheric temperature inversion strength in the Arctic, 1980–96. J. Clim. 2006; 19: 4902–4913.
- Liu Y. , Key J. R. , Wang X . The influence of changes in cloud cover on recent surface temperature trends in the Arctic. J. Clim. 2008; 21: 705–715.
- Liu Y. H. , Key J. R. , Wang X. J . Influence of changes in sea ice concentration and cloud cover on recent Arctic surface temperature trends. Geophys. Res. Lett. 2009; 36: L20710.
- Mesinger F. , DiMego G. , Kalnay E. , Mitchell K. , Shafran P. C. , co-authors . North American regional reanalysis. B. Am. Meteorol. Soc. 2006; 87: 343–360.
- Neale R. B. , Chen C.-C. , Lauritzen P. H. , Gettelman A. , Park S. , co-authors . Description of the NCAR Community Atmosphere Model (CAM 5.0). 2012. NCAR Tech. Note NCAR/TN-486+STR, National Center for Atmospheric Research, Boulder, CO, 274 pp.
- Neale R. B. , Richter J. H. , Conley A. J. , Park S. , Lauritzen P. H. , co-authors . Description of the NCAR Community Atmosphere Model (CAM4). 2011. NCAR Tech. Note NCAR/TN-4851STR. National Center for Atmospheric Research, Boulder, CO, 212 pp.
- Overland J. E. , Wang M. Y . Large-scale atmospheric circulation changes are associated with the recent loss of Arctic sea ice. Tellus A. 2010; 62: 1–9.
- Palm S. P. , Strey S. T. , Spinhirne J. , Markus T . Influence of Arctic sea ice extent on polar cloud fraction and vertical structure and implications for regional climate. J. Geophys. Res-Atmos. 2010; 115: D21209.
- Park D.-S. R. , Lee S. , Feldstein S. B . Attribution of the recent winter sea ice decline over the Atlantic sector of the Arctic Ocean. J. Clim. 2015; 28: 4027–4033.
- Pithan F. , Medeiros B. , Mauritsen T . Mixed-phase clouds cause climate model biases in Arctic wintertime temperature inversions. Clim. Dynam. 2014; 43: 289–303.
- Reynolds R. W. , Rayner N. A. , Smith T. M. , Stokes D. C. , Wang W. Q . An improved in situ and satellite SST analysis for climate. J. Clim. 2002; 15: 1609–1625.
- Saha S. , Moorthi S. , Pan H. L. , Wu X. R. , Wang J. D. , co-authors . The NCEP climate forecast system reanalysis. B. Am. Meteorol. Soc. 2010; 91: 1015–1057.
- Schweiger A. J. , Lindsay R. W. , Francis J. A. , Key J. , Intrieri J. M. , co-authors . Validation of TOVS path-P data during SHEBA. J. Geophys. Res-Oceans. 2002; 107 SHE 17-11–SHE 17-20.
- Schweiger A. J. , Lindsay R. W. , Vavrus S. , Francis J. A . Relationships between Arctic sea ice and clouds during autumn. J. Clim. 2008; 21: 4799–4810.
- Screen J. A. , Simmonds I . The central role of diminishing sea ice in recent Arctic temperature amplification. Nature. 2010a; 464: 1334–1337.
- Screen J. A. , Simmonds I . Increasing fall-winter energy loss from the Arctic Ocean and its role in Arctic temperature amplification. Geophys. Res. Lett. 2010b; 37: L16707.
- Shupe M. D. , Intrieri J. M . Cloud radiative forcing of the Arctic surface: the influence of cloud properties, surface albedo, and solar zenith angle. J. Clim. 2004; 17: 616–628.
- Stokes G. M. , Schwartz S. E . The Atmospheric Radiation – Measurement (ARM) program – programmatic background and design of the cloud and radiation test-bed. B. Am. Meteorol. Soc. 1994; 75: 1201–1221.
- Tomé A. R. , Miranda P. M. A . Piecewise linear fitting and trend changing points of climate parameters. Geophys. Res. Lett. 2004; 31: L02207.
- Uppala S. M. , Kallberg P. W. , Simmons A. J. , Andrae U. , Bechtold V. D. , co-authors . The ERA-40 re-analysis. Q. J. Roy. Meteor. Soc. 2005; 131: 2961–3012.
- Vavrus S . The impact of cloud feedbacks on Arctic climate under greenhouse forcing. J. Clim. 2004; 17: 603–615.
- Vavrus S. , Waliser D . An improved parametrization for simulating Arctic cloud amount in the CCSM3 Climate Model. J. Clim. 2008; 21: 5673–5687.
- Vavrus S. , Waliser D. , Schweiger A. , Francis J . Simulations of 20th and 21st century Arctic cloud amount in the global climate models assessed in the IPCC AR4. Clim. Dynam. 2009; 33: 1099–1115.
- Walsh J. E. , Chapman W. L. , Portis D. H . Arctic cloud fraction and radiative fluxes in atmospheric reanalyses. J. Clim. 2009; 22: 2316–2334.
- Wang X. J. , Key J. R . Recent trends in arctic surface, cloud, and radiation properties from space. Science. 2003; 299: 1725–1728.
- Wang X. J. , Key J. R . Arctic surface, cloud, and radiation properties based on the AVHRR Polar Pathfinder dataset. Part I: spatial and temporal characteristics. J. Clim. 2005a; 18: 2558–2574.
- Wang X. J. , Key J. R . Arctic surface, cloud, and radiation properties based on the AVHRR Polar Pathfinder dataset. Part II: recent trends. J. Clim. 2005b; 18: 2575–2593.
- Zygmuntowska M. , Mauritsen T. , Quaas J. , Kaleschke L . Arctic clouds and surface radiation – A critical comparison of satellite retrievals and the ERA-Interim reanalysis. Atmos. Chem. Phys. 2012; 12: 6667–6677.