
Abstract
A method to assimilate all-sky radiances from the Advanced Microwave Scanning Radiometer 2 (AMSR2) was developed within the Weather Research and Forecasting (WRF) model's data assimilation (WRFDA) system. The four essential elements are: (1) extending the community radiative transform model's (CRTM) interface to include hydrometeor profiles; (2) using total water Qt as the moisture control variable; (3) using a warm-rain physics scheme for partitioning the Qt increment into individual increments of water vapour, cloud liquid water and rain; and (4) adopting a symmetric observation error model for all-sky radiance assimilation.
Compared to a benchmark experiment with no AMSR2 data, the impact of assimilating clear-sky or all-sky AMSR2 radiances on the analysis and forecast of Hurricane Sandy (2012) was assessed through analysis/forecast cycling experiments using WRF and WRFDA's three-dimensional variational (3DVAR) data assimilation scheme. With more cloud/precipitation-affected data being assimilated around tropical cyclone (TC) core areas in the all-sky AMSR2 assimilation experiment, better analyses were obtained in terms of the TC's central sea level pressure (CSLP), warm-core structure and cloud distribution. Substantial (>20 %) error reduction in track and CSLP forecasts was achieved from both clear-sky and all-sky AMSR2 assimilation experiments, and this improvement was consistent from the analysis time to 72-h forecasts. Moreover, the all-sky assimilation experiment consistently yielded better track and CSLP forecasts than the clear-sky did for all forecast lead times, due to a better analysis in the TC core areas. Positive forecast impact from assimilating AMSR2 radiances is also seen when verified against the European Center for Medium-Range Weather Forecasts (ECMWF) analysis and the Stage IV precipitation analysis, with an overall larger positive impact from the all-sky assimilation experiment.
1. Introduction
In most global numerical weather prediction (NWP) systems, satellite observations provide 90–95 % of the actively assimilated data (Bauer et al., Citation2010). However, over 75 % of satellite observations are removed or corrected as a source of noise due to the effects of clouds and precipitation. This is not because these satellite radiance observations are not important, but because they are difficult to use. Regarding satellite observations, the cloud- and precipitation-affected areas are less well represented because it is difficult to separate the information on the main observables, such as temperature and moisture, from cloud and precipitation effects (Bauer et al., Citation2011). In a numerical model, the limited accuracy of moist-physics parameterisations and the need to model radiative transfer through clouds and precipitation are two major problems for dealing with the cloud-affected data (Bauer et al., Citation2010). The challenges for assimilating cloud- and precipitation-affected satellite data also include the complex and non-Gaussian error statistics, and a mismatch in the spatial resolution of observations and models (Okamoto, Citation2013). Previous studies indicated that cloudy areas coincide with areas where uncertainties in the initial conditions can produce large forecast error growth (McNally, Citation2002). The presence of cloud and precipitation usually indicates that some dynamically important weather is occurring, and the subsequent forecasts are often sensitive to initial conditions in regions with cloud and precipitation (Kim et al., Citation2008). So ignoring cloud-affected regions may overlook some meteorologically very important areas.
With the development of models, physics schemes and data assimilation methods, several operational centres, such as the National Centres for Environmental Prediction (NCEP), European Center for Medium-Range Weather Forecasts (ECMWF), Met Office, Japan Meteorological Agency (JMA), Météo-France and Environment Canada have made progress in assimilating cloud- and precipitation-affected infrared radiances (Greenwald et al., Citation2002; Heilliette and Garand, Citation2007; Pavelin et al., Citation2008; McNally, Citation2009; Pangaud et al., Citation2009; Heilliette, Citation2010; Guidard et al., Citation2011; Lupu and McNally, Citation2012; Okamoto, Citation2013) and microwave radiances (Bauer et al., Citation2010; Geer et al., Citation2010; Geer and Bauer, Citation2010, Citation2011; Zhu et al., Citation2013) in global systems, based on variational approaches.
In their regional modelling systems, however, most operational centres actually assimilate ground-based rainfall observations and/or radar reflectivity, in addition to selected cloud products derived from satellite observations (Bauer et al., Citation2011). For example, regional models at the Met Office assimilate cloud fraction diagnosed from Meteosat Spinning Enhanced Visible and Infrared Imager (SEVIRI) imagery (Taylor et al., Citation2008; Renshaw and Francis, Citation2011) and rainfall data derived from radar observations by using latent heat nudging (Macpherson, Citation2001) through three-dimensional variational (3D-Var) or four-dimensional variational (4D-Var) data assimilation. At JMA, hourly precipitation data derived from ground-based radar observations is assimilated into a regional model using 4D-Var (Tsuyuki et al., Citation2002). For the same regional model, total column water vapour derived from microwave imager data is assimilated in clear-sky conditions, while derived precipitation is utilised in rainy conditions (Bauer et al., Citation2011; Kazumori, Citation2014). It was found that the assimilation of microwave imager retrievals produces realistic atmospheric moisture fields that lead to better rainfall forecasts (Tauchi et al., Citation2004). Nevertheless, Moreau et al. (Citation2004) and Bauer et al. (Citation2006) have suggested that for global models it is preferable to assimilate microwave radiances rather than derived rain rates. In this study, the effect of directly assimilating cloud- and precipitation-affected satellite radiance data in a limited area will be evaluated with microwave imager data from a newer generation instrument.
As an indispensable part of the global Earth Observing System (EOS), microwave radiometers, such as the Special Sensor Microwave Imager Sounder (SSMIS) onboard the Defense Meteorological Satellite Program (DMSP) satellites (Bell et al., Citation2008; Kunkee et al., Citation2008), the Tropical Rainfall Measuring Mission (TRMM) Microwave Imager (TMI) (Kummerow et al., Citation1998), and the Aqua Advanced Microwave Scanning Radiometer for EOS (AMSR-E) (Kawanishi et al., Citation2003), can provide observational data related to various phases of water, such as water vapour, cloud liquid water, ice and snow. The observations from the microwave radiometers have been applied for cloud, water vapour and precipitation retrievals (Weng and Grody, Citation2000; Sun and Weng, Citation2011), and also directly used in global data assimilation (Bauer et al., Citation2011). It has been demonstrated that the assimilation of microwave radiometer observations can improve humidity, cloud and precipitation analyses, as well as the forecasts for those fields (Tauchi et al., Citation2004; Kazumori et al., Citation2008; Geer and Bauer, Citation2010; Kazumori and Egawa, Citation2014; Kazumori et al., Citation2014).
The Japan Aerospace Exploration Agency (JAXA) has conducted the Global Change Observation Mission (GCOM) for continued global meteorological and environmental monitoring (Imaoka et al., Citation2010). GCOM-W is one series of satellites for observing the water cycles. The first satellite for this series (GCOM-W1) was launched on 18 May 2012. The Advanced Microwave Scanning Radiometer 2 (AMSR2) onboard GCOM-W1, which has 14 channels at seven frequencies with horizontal and vertical polarisations, is the successor of AMSR-E. ECMWF has used AMSR2 all-sky radiance observations in their global system (Kazumori et al., Citation2014), resulting in improved analyses and forecasts, especially in the humidity field. As described above, only clear-sky radiances were used in JMA's global NWP system and retrieved precipitation data were assimilated in JMA's regional system (Kazumori and Egawa, Citation2014). However, the data quality and benefits of AMSR2 radiance in regional data assimilation have not yet been investigated with an all-sky radiance assimilation scheme.
In this study, as the first attempt to assimilate AMSR2 radiances in the Weather Research and Forecasting (WRF) model's data assimilation (WRFDA) system (Barker et al., Citation2012), the impact of assimilating clear-sky and all-sky AMSR2 radiance will be evaluated for Hurricane Sandy's analyses and forecasts. The rest of this paper is organised as follows. In Section 2, we provide a brief introduction to the WRFDA system and AMSR2 radiance data. The methods of bias correction, quality control and observation error will be discussed in Section 3. Section 4 gives the experimental settings. Results are presented in Section 5 before concluding in Section 6.
2. WRFDA and AMSR2 data
2.1. WRFDA and radiance data assimilation
The WRFDA system was developed by the National Center for Atmospheric Research (NCAR). It includes three-dimensional variational (3DVAR), 4DVAR and Hybrid DA components for both research and operational applications (Barker et al., Citation2012). The 3DVAR scheme employed in this study can provide an improved estimate of the atmospheric state through the iterative minimisation of a prescribed cost function1
where x is the atmospheric state vector, x b the background state, H the nonlinear observation operator and y the observation vector. B and R are the background and observation error covariance matrices, respectively. The so-called ‘NMC method’ (Parrish and Derber, Citation1992) was used to obtain background error (BE) covariance statistics for five control variables: stream-function (Ψ), unbalanced velocity potential (χu), unbalanced temperature (Tu), unbalanced surface pressure (Ps,u), and pseudo relative humidity (RHs) (Dee and da Silva, Citation2010) for control and clear-sky radiance assimilation experiments. There is no cross-correlation taken into account between RHs and other variables. For all-sky radiance assimilation, the humidity control variable will be changed to total water control variable Qt, which will be discussed later in this section.
The WRFDA system can assimilate a variety of observations including satellite radiance data. A unique feature of WRFDA radiance assimilation is that it interfaces to the two most widely used fast Radiative Transfer Models (RTMs): Radiative Transfer for Television Infrared Observation Satellite Operational Vertical Sounder (RTTOV) developed and maintained by the European Organization for the Exploitation of Meteorological Satellites (EUMETSAT), and the Community Radiative Transfer Model (CRTM) (Weng, Citation2007) developed by the U.S. Joint Center for Satellite Data Assimilation (JCSDA) (Han et al., Citation2006). In this study, CRTM-2.1.3 was used as the radiance observation operator. Radiance data from a number of satellite sensors such as those listed in Barker et al. (Citation2012) can be assimilated in WRFDA. However, radiance DA was initially implemented in WRFDA only under clear-sky conditions (Liu and Barker, Citation2006).
Liu et al. (Citation2009) extended WRFDA from clear-sky radiance DA to all-sky radiance DA by (1) extending the CRTM interface to include hydrometeor profiles (cloud liquid water, cloud ice, rain, snow, graupel, hail) in the input; (2) using total water control variable Qt (sum of water vapour, cloud liquid water and rain) as the moisture control variable; (3) using tangent linear (TL) and adjoint (AD) models of a warm-rain physics scheme (Dudhia, Citation1989) for partitioning the Qt increment into individual increments of water vapour, cloud liquid water and rain. The warm-rain physical parameterisation constrains the relation among rainwater, cloud water, moisture and temperature (Xiao et al., Citation2007). A similar scheme (using the Qt control variable and the warm-rain physical constraint) has also been used for assimilating radar reflectivity using the fifth-generation Penn State/NCAR mesoscale model 3D-Var system (MM5-3DVAR, Xiao et al., Citation2007). While Liu et al. (Citation2009) demonstrated all-sky radiance DA with simulated SSMIS radiances, this study applied it to real AMSR2 radiances with improved observation error modelling as detailed in Section 3.3.
2.2. AMSR2 data
AMSR2 is a remote sensing instrument for observing microwave radiances emitted and scattered from the surface and the atmosphere of the earth. It incorporates most of the characteristics of AMSR-E, which stopped operation on 4 October 2011, but with several enhancements including a larger main reflector (2.0 m), the addition of 7.3 GHz channels, 12-bit quantisation for all channels and improvements in the calibration system (Imaoka et al., Citation2010). It is the only microwave imager in the A-Train orbit and no other microwave imager in the same orbit is planned. AMSR2 is a conical scan sensor with a scan angle of 47.5 degrees and each scan covers a width of about 1450 km on the earth's surface. This scanning geometry can cover more than 99 % of the earth's surface in 2 d.
AMSR2 has 14 channels at 7 frequencies with both vertical and horizontal polarisations (). Lower frequency channels 1–6 of AMSR2 are more sensitive to surface emissivity (thus related to ocean surface wind speed). Channels 7 and 8 at 18.7 GHz provide information for ocean rain and surface wind. Channels 9 and 10 at 23.8 GHz are mainly used to measure atmospheric water vapour. Channels 11 and 12 at 36.5 GHz are for cloud liquid water. Channels 13 and 14 at 89.0 GHz are sensitive to convective rain areas. In this study, only radiances from channels 5–12 with frequencies between 10.65 and 36.5 GHz are assimilated.
Table 1. Characterisation of AMSR2 channels
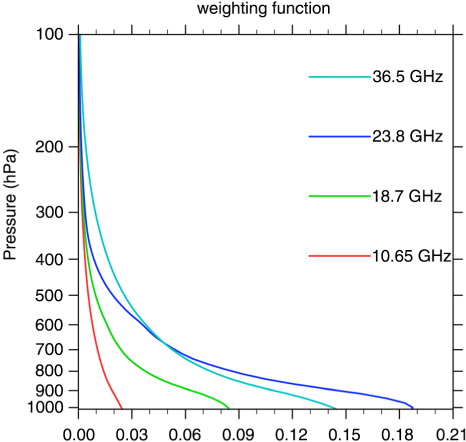
Calculated from the U.S. Standard Atmosphere, weighting functions of AMSR2 channel 5 to channel 12 with four frequencies are shown in , which is consistent with that shown by Zou (Citation2012) for the same frequencies from FY-3B MWRI sensor. It can be seen that these imager channels are more transparent to clear-sky atmosphere with contribution weight peaking at lowest level.
Fig. 1 Weighting functions of AMSR2 channel 5 to channel 12 at 10.65 GHz (red), 18.7 GHz (green), 23.8 GHz (blue) and 36.5 GHz (cyan), calculated using CRTM based on the U.S. standard atmosphere.
It should be noted that 89.0 GHz data have 486 pixels per scan line and other frequencies have 243 pixels (Maeda and Imaoka, Citation2014). In the level-1B raw radiance dataset, the field of view (‘footprint’) size and the location of each frequency's pixel differ from one another, and the higher the frequency, the smaller the footprint, as is noted in . In this study, the level-1R radiance dataset (Maeda and Imaoka, Citation2014) is assimilated instead of level-1B data. Pixels of all frequencies are adjusted to the 89 GHz's location and the footprint of the ‘source’ frequency is resampled to that of the ‘target’ frequency with the Backus-Gilbert method (Backus and Gilbert, Citation1970). As indicated in , there are multiple resampled level-1R datasets for each frequency. Those datasets with the location adjusted to 89 GHz but the footprint kept the original size (marked by * in ) are chosen for assimilation in this study. Note that there is no target footprint for 18.7 GHz and we use its resampled data at 23.8 GHz footprint. The corresponding level-2 cloud liquid water path (CLWP) product is also used in this study for quality control (QC) purpose.
Table 2. Resampled AMSR2 level-1R products
3. Methodology
3.1. Variational bias correction
Radiances have systematic error (bias) that should be properly corrected before they are assimilated because the DA scheme assumes no bias in either the observations or the forecast background (Liu et al., Citation2012; Zhu et al., Citation2013; Kazumori, Citation2014). Radiance bias is often expressed as a linear combination of a set of predictors p
i
, i= 0, 1, 2, …, N
p
, which leads to the modified forward operator ([Htilde]),2
where H(x) represents the RTM; x is the model state vector; β 0 is a constant component of total bias; and p i and β i are the ith of N p predictors and corresponding bias-correction coefficients, respectively. The bias-correction coefficients β are usually assumed to be channel-dependent and can be estimated offline (Harris and Kelly, Citation2001) or updated adaptively within a variational minimisation process by including them in the state vector (Derber and Wu, Citation1998). The latter method is referred to as variational bias correction (VarBC) (Dee, Citation2004; Auligné et al., Citation2007). WRFDA's VarBC implementation includes seven predictors: the scan position, the square and cube of scan position, 1000–300 and 200–50 hPa layer thicknesses, surface skin temperature and total column water vapour. For conical scanning AMSR2 with a fixed scan angle, the three scan-position-related predictors are turned off.
Similarly to Liu et al. (Citation2012), we ran WRFDA's VarBC in an ‘offline’ mode, in which the background term and all non-radiance observations are excluded, to obtain the background bias correction coefficients and predictors’ statistics for the first analysis of the cycling experiment.
In assimilation cycles, the cost function J to be minimised with respect to the bias parameters
β
and model state x becomes3
where β b and B β are the background bias correction coefficient vector and the bias parameter BE covariance, respectively (Auligné et al., Citation2007).
For every analysis, the bias correction coefficients are updated adaptively during the minimisation of the 3DVAR analysis using the bias coefficients from the previous cycle's analysis as the background. For this initial implementation of all-sky radiance assimilation, there is no different treatment from the clear-sky radiance bias correction. This may be suboptimal but it works well in practice, as also demonstrated by Geer and Bauer (Citation2010).
3.2. Quality control
The same general clear-sky radiance QC procedures as described in Liu et al. Citation2012 are applied to AMSR2 radiance data, including (1) gross check, which removes observations with brightness temperature (TB) lower than 50 K or higher than 550 K; (2) surface type check, which removes pixels with mixed surface types; (3) departure check, which removes the observations if the bias-corrected innovation (observation minus prior) exceeded 3σo, where σo is the observation error standard deviation.
In addition, AMSR2-specific QC procedures applied in this study are listed as follows: (1) data over land are discarded and only water pixels are assimilated; (2) for 10.6 GHz channels, data are rejected for ‘sun glint angle’ less than 25.0 degrees; (3) the observations are not used if the absolute value of bias-corrected innovation exceeds the prescribed thresholds (, only for clear-sky QC); (4) data are rejected if the retrieved level-2 CLWP values are larger than the thresholds listed in , which refers to the QC procedures for clear-sky AMSR-E radiance data assimilation (Kazumori et al., Citation2008). For all-sky radiance assimilation, the CLWP (step 4) and absolute innovation checks (step 3) are not applied.
Table 3. Quality control thresholds for absolute innovation and CLWP check
3.3. Observation error modelling
Over the chosen model domain, most AMSR2 data are observed at 0600 UTC and 1800 UTC AMSR2 data over an 11-d experimental period from 0600 UTC 21 October to 1800 UTC 31 October were used for the statistics of observation errors. The standard deviation of the difference between the observed and the CRTM-simulated TBs with the NCEP Global Forecast System (GFS) analysis as the input were obtained for each channel under clear-sky situations. These standard derivation statistics () served as the observation errors in the clear-sky radiance assimilation experiment.
Table 4. Observation errors for AMSR2 channels assimilated
For the observation errors in all-sky conditions, we followed the ‘symmetric error model’ proposed by Geer and Bauer (Citation2010)
Geer and Bauer (Citation2011) for microwave imagers. In this method, the normalised 37GHz polarisation difference P
37
(Petty and Katsaros, Citation1990; Petty, Citation1994) can be defined as the square of the slant path transmittance τ37 of cloud and precipitation at this frequency, namely4
where T
v
and T
h
are the vertically and horizontally polarised 37 GHz TBs from the observation or background, and and
are TBs calculated for the same background profiles but without hydrometeor input. Then one can define
5
as the ‘cloud’ amount and calculate and
from the background and observed TBs, respectively. The ‘symmetric’ or mean cloud amount is defined as
6
The larger values of indicate agreement between the observation and background, with heavy rain or cloud in both.
means both the observation and background are of clear sky. The symmetric observation error r is characterised as a linear function of
, as given by
7
where r clr and r cld correspond to the observation errors under full clear-sky (defined with C clr) or full cloudy (defined with C cld) conditions, respectively.
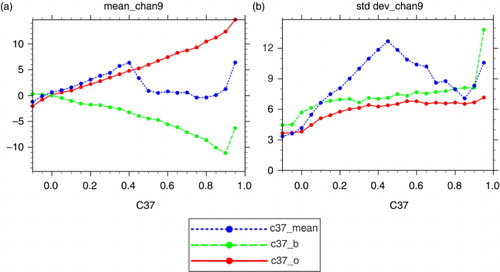
For the same 11-d period, the statistics of the mean and standard deviation of the observed minus the background TBs under all-sky situations are shown in for 23.8 GHz-V channel, with the background TBs computed from the 6-h WRF forecasts initialised from the GFS analyses. The error statistics are expressed as a function of , C
37° and C
37
b with a bin size of 0.05. This pattern of statistics is very similar to those obtained by Kazumori et al. (Citation2014) from a global data assimilation system, but with the standard deviation values 1.5–2 times larger at C
cld (0.45–0.5 bin). This larger error statistics value is likely due to less accurate radiative transform model for the heavy-precipitating situation during Hurricane Sandy period. The standard deviations of ‘cloudy’ errors at C
cld (i.e. r
cld) for channels used in this study are given in . In order to make a fair comparison with the clear-sky assimilation experiment, we adopted the clear-sky error statistics that applied more rigorous QC than all-sky error statistics as r
clr for C
clr situations (i.e. cloud amount bin 0–0.05), which are also given in .
Fig. 2 Mean (a) and standard deviation (b) of AMSR2 23.8 GHz-V OMB binned as a function of C37 for data from 0600 UTC 21 October to 1800 UTC 31 October 2012. The C37 is derived from the background (green), observation (red) or the average of the two (blue). Bin size is 0.05 in C37.
4. Experimental setup
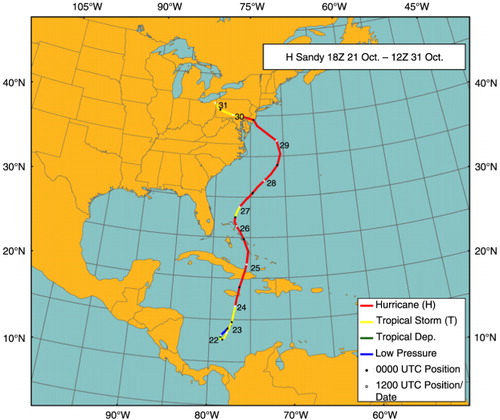
Hurricane Sandy (2012) (McNally et al., Citation2014; Wang et al., Citation2014, Citation2015) was selected to evaluate the impact of AMSR2 radiance assimilation under clear-sky and all-sky conditions. As shown in , Sandy appeared as a low-pressure system in the southwestern Caribbean Sea at 1800 UTC 21 October and moved slowly toward the west and southwest. It was defined as a tropical depression at 1200 UTC 22 October and moved northward. It was identified as a tropical storm 6 h later at 1800 UTC 22. Sandy grew and intensified to hurricane strength at 1200 UTC 24 October before its first landfall near Bull Bay, Jamaica and upgraded to a category-3 hurricane with a maximum surface wind speed (MSWS) of 100 knots and a minimum sea level pressure (MSLP) of 954 hPa at 0525 UTC 25 October prior to its second landfall at eastern Cuba. Sandy quickly weakened to tropical storm status after crossing Cuba by 0000 UTC 27 October, but regained hurricane strength by 1200 UTC 27 October. Initially, Sandy moved northeast until an unusual northwestward turn to the Mid-Atlantic states at 0000 UTC 29 October and finally made landfall at 0000 UTC 30 October near Brigantine, New Jersey. Sandy resulted in 72 deaths, and about $50 billion in damage (Blake et al., Citation2013).
Fig. 3 The best track of Sandy from the National Hurricane Center (NHC) from 1800 UTC 21 October to 1200 UTC 31 October.
To test the assimilation of AMSR2 radiances with WRFDA, we performed cycling forecast-analysis experiments for the period from 0000 UTC 21 October, 36 h before Sandy was declared as a tropical depression, to 0000 UTC 31 October, soon after Sandy's final landfall. All experiments employ version 3.5 of the Advanced Research WRF Model (WRF-ARW, hereafter WRF; Skamarock et al., Citation2008). In all experiments, the horizontal grid spacing is 15 km and there are 57 vertical levels with the model top at 10 hPa. The following physics parameterisations are used: WRF single-moment 6-class microphysics scheme (WSM6, Hong and Lim, Citation2006); the Rapid Radiative Transfer Model for GCMs (RRTMG; Mlawer et al., Citation1997; Iacono et al., Citation2008) shortwave and longwave radiation schemes; the Yonsei University (YSU) boundary layer scheme (Hong et al., Citation2006); the Monin-Obukhov surface layer scheme (Monin and Obukhov, Citation1954); the unified Noah land-surface model (Chen and Dudhia, Citation2001) and the Tiedtke cumulus parameterisation scheme (Tiedtke, Citation1989; Zhang et al., Citation2011).
In the cycling experiments, analyses are generated every 6-h (at 0000, 0600, 1200 and 1800 UTC). The lateral boundary conditions for 6-h forecasts are provided by the NCEP GFS forecasts. The background in the first analysis at 0000 UTC 21 October is the 6-h forecast initiated from the GFS analyses at 1800 UTC 20 October 2012. For the following cycles, the background is 6-h WRF forecast initialised from the previous cycle's analysis. Additionally, a 72-h WRF forecast is initialised from each 0000 and 1200 UTC analysis, with lateral boundary conditions also taken from the appropriate GFS forecasts. BE statistics are generated using the NMC method with the difference between 36 and 12-h WRF forecasts from 15 June to 15 July 2012, four times a day using GFS data as the initial and boundary conditions.
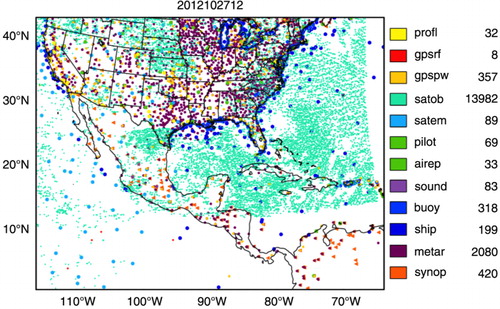
Three parallel experiments were configured to evaluate the impact of assimilating AMSR2 radiances with 3DVAR on the forecast of Hurricane Sandy. The first experiment (hereafter ‘CON’) assimilated conventional observations from radiosondes, aircraft, satellite-derived winds, land and oceanic surface stations and GPS refractivity observations. The second experiment (hereafter ‘CLRSKY’) assimilated all observations from CON plus clear-sky AMSR2 radiances. The raw radiance data were thinned on a 30-km grid to avoid potential correlations between adjacent observations (Liu and Rabier, Citation2002). This choice of thinning mesh is smaller than typical settings in operational global data assimilation systems in consideration of better resolving TC structure around TC core region with strong gradient (Liu and Rabier, Citation2003). The third experiment (hereafter ‘ALLSKY’) is the same as the second experiment, but using all-sky AMSR2 radiances. In all experiments, the observations within±3-h of the analysis times were assimilated and all observations were assumed to be valid at the analysis times. shows a snapshot of assimilated conventional observations over the experimental domain at 1200 UTC 27 October. Clearly, satellite-derived winds (marked as ‘satob’) are the major data source over the Atlantic Ocean.
Fig. 4 The distribution of observations used in the CON experiment at 1200 UTC 27 October 2012. The numbers of each observation are marked on the right.
5. Results
The environmental fields surrounding Sandy were assessed by comparing them to the ECMWF analysis at about 16 km horizontal resolution and AMSR2 retrieval products. The TC track and intensity forecast performance from the three experiments was evaluated against the National Hurricane Center's (NHC) best-track data. The precipitation forecast at landfall was verified with Stage IV analysis data.
5.1. Clear-sky and all-sky radiance simulations
After passing the Bahamas, Sandy turned from a tropical storm to a hurricane at 1200 UTC 27 October. The image from the Moderate-resolution Imaging Spectroradiometer (MODIS) shows that Sandy had a clear spiralling cloud band, which stretched from the US southeast coast to the Mid-Atlantic, and asymmetric convection concentrated on its northwest flank (a). also displays the AMSR2 channel 9 (23.8 GHz-V) observed (b) and simulated data for both the CLRSKY and ALLSKY experiments (c and d) at 1800 UTC 27 October, when the satellite observations cover most of Hurricane Sandy. The simulated background is from the 6-h forecast initiated from the previous cycle's analysis. Clearly, both observed and simulated radiances can depict the main pattern of Hurricane Sandy. For the clear-sky simulation, the input to CRTM does not include cloud variables and thus the CLRSKY experiment simulated TBs (c) over the cloudy and precipitating areas are much smaller than the observed TBs. With the cloudy CRTM scheme, the simulated TBs have a reasonable match with the observations (d), which is a good basis for all-sky radiance assimilation. displays the coverage of observations that are rejected in CLRSKY after QC, but assimilated in ALLSKY. From , we can see that 3113 more pixels are assimilated in ALLSKY than in CLRSKY for this particular analysis time. More importantly, additional data assimilated in ALLSKY cover the TC core area well, which allows a better analysis of the TC core structure. The numbers of extra pixels assimilated in ALLSKY for other AMSR2 channels are listed in .
Fig. 5 MODIS image of Sandy (a), AMSR2 23.8 GHz-V images at 1800 UTC 27 October within a ±3-h time window from the observed (b), CRTM-simulated background brightness temperatures (K) from the CLRSKY experiment with clear-sky CRTM (c) and the ALLSKY experiment with all-sky CRTM (d).
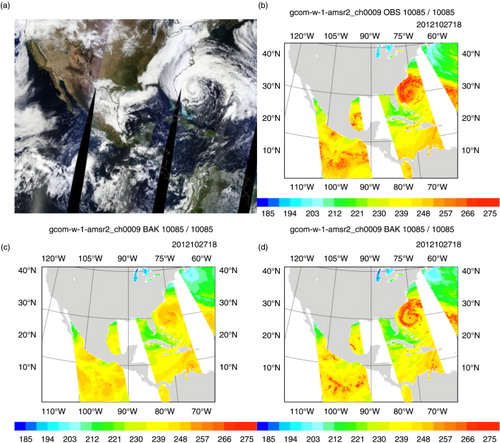
Fig. 6 The coverage of AMSR2 channel 9 brightness temperature (K) assimilated only in the ALLSKY experiment at 1800 UTC 27 October 2012.
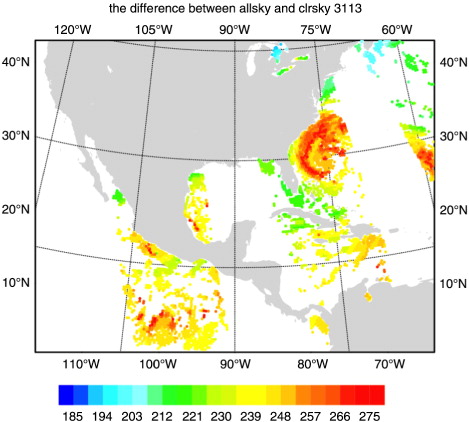
Table 5. The numbers of extra pixels assimilated in the ALLSKY experiment at 1800 UTC 27 October 2012
5.2. Impact on analysed hurricane structure against ECMWF analysis
ECMWF is considered one of the best centres for hurricane forecast (Fiorino, Citation2009). Here, the WRFDA analysis fields are verified against ECMWF analysis (www.rda.ucar.edu/datasets/ds113.0/), which has a similar resolution (16 km) to our experiments. Because Sandy had strengthened to a hurricane and the AMSR2 data covered most of the hurricane area, we chose the analysis at 1800 UTC 27 October as the example to estimate the impact of AMSR2 assimilation for analysis.
The fields of surface wind, sea level pressure (SLP), horizontal wind speed and temperature anomaly from the ECMWF analysis and from the WRFDA analyses of CON, CLRSKY and ALLSKY at 1800 UTC 27 October are shown in , at the surface level and in vertical cross-sections through the individual vortex centres of each experiment. The location of MSLP (973 hPa) of the CON experiment (b) is shifted southeastward when compared to the ECMWF analysis (a). With clear-sky radiance assimilation (c), the pattern of the TC is more like that of the ECMWF analysis, even though it has a 1 hPa weaker MSLP (i.e. 974 hPa) than that of CON. Clearly, the ALLSKY analysis (d) is in the closest agreement with the ECMWF analysis in terms of both the TC's shape and intensity. The ALLSKY analysis obtains a MSLP of 971 hPa, but is still weaker than the ECMWF's MSLP of 965 hPa. This weaker MSLP for the WRFDA analyses is likely due to the limitation of the 3DVAR scheme and many fewer satellite observations used than ECMWF's operation.
Fig. 7 (Top row) The surface wind vectors and sea level pressure (colour-shaded) at 1800 UTC 27 October from the analyses of ECMWF (a), CON (b), CLRSKY (c) and ALLSKY (d). Same as the top row, but for the west-east cross-sections of horizontal wind speed (second row, e–h) and temperature anomaly (third row, i–l) through the vortex centre. The x-axis of (e)–(l) is grid number along the black line in (a).
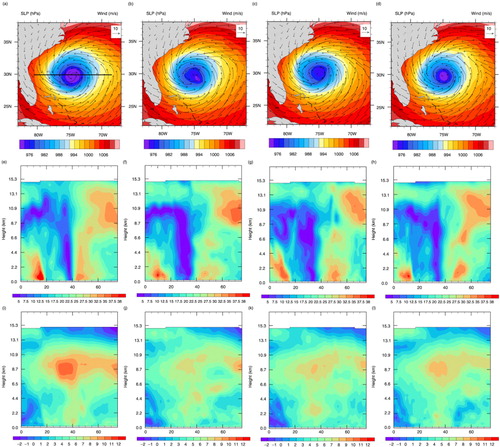
The west–east vertical cross section of horizontal wind speed is plotted in e–h. For all experiments, the analysed winds show the asymmetric structure, which can also be seen from MODIS and AMSR2 images (a and b). The maximum wind speed is on the west side of the low level vortex centre in all cases. All experiments have a smaller maximum wind speed when compared with the 44 m/s of the ECMWF analysis. The magnitudes of winds near the hurricane centre in CON and CLRSKY experiments are somewhat smaller than those in ALLSKY and ECMWF analyses, but all show the wind speed tilted westward with height at the upper levels. It is also noticeable that ALLSKY's east side wind agrees more closely with the ECMWF analysis.
i–l shows the temperature anomaly in vertical cross-sections. The maximum of the warm core structure is found near 8.7 km above mean sea level. With the all-sky radiance assimilation, a stronger warm core is established around 8.7 km (l) compared with the CON and CLRSKY experiments (j–k), although the warm core structure is still weaker than that of the ECMWF analysis (i). Weak warm anomalies are also found on the east side of the storm, where little rainfall occurred at this time (Zhu and Weng, Citation2013).
5.3. Impact on analysed hurricane structure against AMSR2 product
As mentioned earlier, in this study, the level-1R TBs are assimilated and the corresponding level-2 CLWP data are used for quality control. The verifications against AMSR2 level-1R and level-2 products over the hurricane area are plotted in . b–d is the simulated 23.8 GHz-V TBs (with cloudy CRTM) from three DA experiments’ analyses at 1800 UTC 27 October. Compared with the observed values (a), the analysed TBs from the CON and CLRSKY experiments show lower amplitude near the hurricane centre, and the northwest asymmetric spiralling cloud bands are narrower. In contrast, the ALLSKY experiment obtains analysed TBs closer to the observed values over the TC centre and the asymmetric spiralling cloud bands, which resulted from more data assimilated over these areas.
Fig. 8 The analysed brightness temperatures (K) of AMSR2 23.8 GHz-V (b–d), CLWP (kg/m2) (f–h), and TPW (kg/m2) (i-l) from the CON, CLRSKY and ALLSKY experiments at 1800 UTC 27 October, compared with the observed brightness temperatures (a), the level-2 CLWP product (e) and TPW product (i).
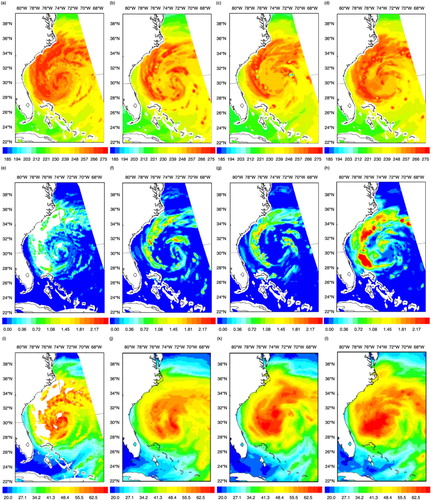
e–h shows CLWP (kg/m2) distribution from the retrieved level-2 AMSR2 product and three experiments’ analyses. At Sandy's west cloud band, there are many missing pixels in the level-2 product (e), likely due to limitations of the retrieval algorithm in these heavily precipitating regions. The analysed CLWP from ALLSKY (h) revealed a stronger and broader heavy precipitating band than those from the CON (f) and CLRSKY (g) experiments, which coincides with the missing area in the level-2 product. Moreover, around the TC centre both the CON and CLRSKY experiments produced a larger area with zero CLWP values, while ALLSKY obtained more realistic non-zero CLWPs and apparently agreed more closely with the level-2 CLWP product.
The total precipitable water (TPW, kg/m2) distribution from the level-2 AMSR2 retrieval product and three experiments’ analyses are displayed in i–l. TPW retrieval product has the same missing data as CLWP product. CON (j) produces a light southward maximum centre and smaller TPW in the north part of hurricane, while larger TPW than retrieval data in the south part. CLRSKY (k) has lager maximum area than CON, but south part is closer to retrieval. In the northeast part of hurricane, ALLSKY (l) shows much clearer spiral pattern than CON and CLRSKY and agrees more closely to TPW retrieval product.
5.4. Impact on track and intensity forecast
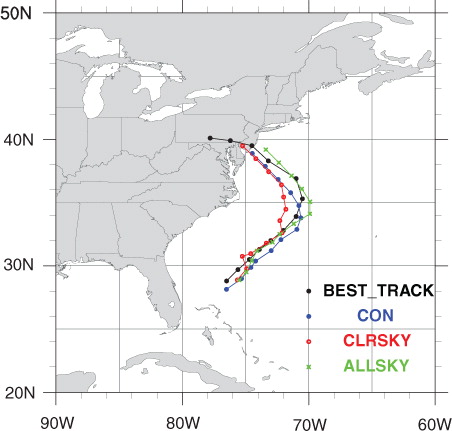
The impact of assimilating the AMSR2 radiance data is further evaluated by examining the 72-h forecasts launched from each 0000 and 1200 UTC analysis. As an example, during the 72-h forecast from 1200 UTC 27 October, Hurricane Sandy had an unusual northwestward turn toward the Mid-Atlantic states at 0000 UTC 29 October (). At the beginning, three experiments have obvious position biases against the best track data from NHC. After a 12 h forecast, CLRSKY and ALLSKY experiments are similar to the best track. All the experiments predict the unusual turn around 29 October, but CLRSKY turns earlier at 1800 UTC 28 October while CON turns at 0000 UTC 29 October but with a smaller angle. ALLSKY turns from 0600 UTC 29 October, but has a closer track after the northwestward turn. It is clear that all forecasts are slower than the best track after the turn and predict the landfalls 12 h later. It may be improved by using vortex relocation (Hsiao et al., Citation2010) and a dynamic constraint (Li et al., Citation2015), which is out of the scope of this study and will be evaluated in the future.
Fig. 9 The best track (black) and 72-h forecast tracks from the CON (blue), CLRSKY (red) and ALLSKY (green) experiments started from 1200 UTC 27 October.
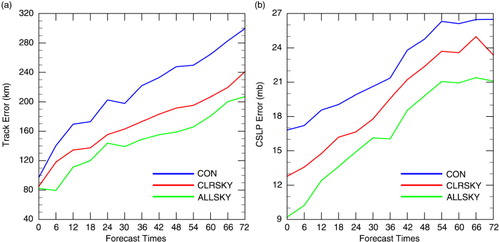
The mean aggregated errors of track and central sea level pressure (CSLP) of 13 72-h forecasts from the three experiments are shown in , as verified against the NHC best track data. As expected, the track and CSLP errors of all experiments increase with the forecast lead time. But with AMSR2 assimilation, a consistent improvement for all lead times is obtained in the CLRSKY and ALLSKY experiments. Compared with CON, the largest improvement of track is at the 72-h forecast time with a 20 % (30 %) track error reduction for CLRSKY (ALLSKY). For CSLP, 23 % improvement in CLRSKY and 47 % improvement in ALLSKY are maintained almost for all lead times. It is remarkable that the ALLSKY experiment substantially outperforms the CLRSKY one, resulting from a better analysis of TC core areas.
Fig. 10 Aggregated absolute track errors (a) and mean central sea level pressure errors (b) as a function of forecast range from three experiments. The error statistics are obtained from 13 72-h forecasts.
5.5. Impacts on temperature, moisture and wind forecasts against ECMWF data
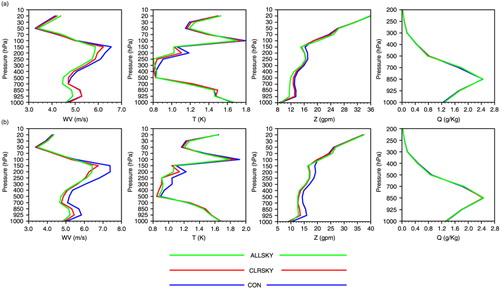
Verified against the ECMWF analysis over ocean, the aggregated root-mean-square-error (RMSE) profiles of wind vector, temperature, geopotential height and moisture forecasts at 48-h and 72-h for all 13 three-day forecasts are displayed in . For the 48-h forecasts, the most pronounced improvement from AMSR2 radiance assimilation is on the wind field at low-middle levels (925–500 hPa) for ALLSKY and around the 150 hPa jet level for both CLRSKY and ALLSKY. Larger forecast impact on wind field by radiance assimilation was also demonstrated by Liu et al. (Citation2012) for AMSU-A radiance assimilation for Atlantic hurricanes with an ensemble Kalman filter. The temperature improvement is mostly in the middle levels (400–200 hPa). ALLSKY has also a clear positive impact on low-level (925–500 hPa) geopotential height. The impact of assimilating AMSR2 radiances on specific humidity is neutral. Overall, the ALLSKY experiment outperforms the CLRSKY one. For 72-h forecasts, the improvement resulting from AMSR2 radiance assimilation becomes larger for all variables except for moisture. However, the discrepancies between ALLSKY and CLRSKY are reduced. The impact on moisture remains neutral. We suspect that little impact on moisture forecast is likely due to univariate feature of humidity analysis in clear-sky radiance assimilation and sub-optimal multivariate relation between humidity and other variables due to simplified warm-rain physical scheme used in all-sky radiance assimilation. More advanced data assimilation schemes such as 4DVAR or hybrid variational/ensemble approach may improve this and worth to investigate in future studies.
Fig. 11 The aggregated root-mean-square-error of 48-h (a) and 72-h (b) forecasts for vector wind, temperature, geopotential height and specific humidity against the ECMWF analyses. The error statistics are obtained from 13 72-h forecasts.
5.6. Impact on precipitation forecast
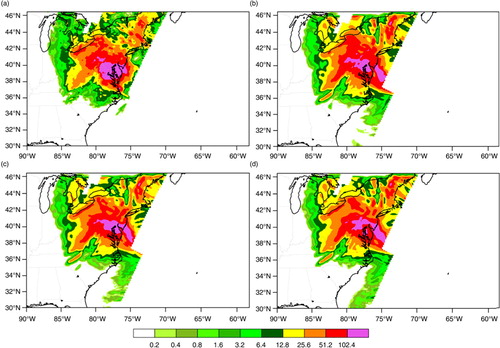
Hurricane Sandy made landfall at about 2330 UTC 29 October near Brigantine, New Jersey, and produced torrential rains. presents the 24-h accumulative rainfall between 1200 UTC 29 October and 1200 UTC 30 October from Stage IV analysis, CON, CLRSKY and ALLSKY forecasts initialised at 1200 UTC 29 October. The heaviest rainfall is more than 100 mm near Baltimore. All experiments’ forecasts show a similar pattern to the Stage IV data, but the maximum rainfall locations are slightly shifted northward, and the maximum rain band is extended in a southeast–northwest direction. ALLSKY's maximum rainfall is further northward when compared to the other two experiments. However, the heavy rainfall (>50 mm) coverage in CLRSKY and ALLSKY are smaller than that in CON and more consistent with Stage IV data.
Fig. 12 The 24-h accumulated rainfall (mm) from 1200 UTC 29 to 1200 UTC 30 October 2012 from the Stage IV analysis (a), and the forecast from CON (b), CLRSKY (c) and ALLSKY (d). All forecasts are initialised at 1200 UTC 29 October 2012.
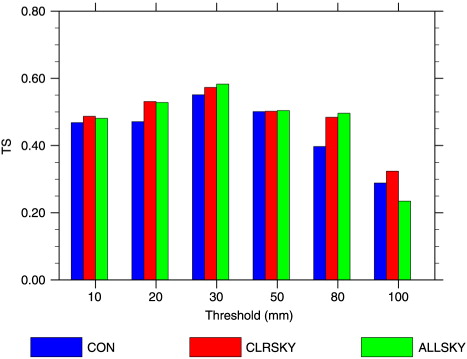
The impact of AMSR2 assimilation on precipitation forecast can be quantitatively assessed with the threat score (TS) (Junker et al., Citation1992), defined as
where F is the number of forecasts at observation points with precipitation equal to or exceeding a given threshold, O the number of occurrences in which the observations meet or exceed the threshold, and H the number of both forecasts and the observations meet or exceed the threshold. Thus, the TS indicates how accurately a precipitation threshold is predicted in the model forecasts. From , it is seen that CLRSKY outperforms CON at all precipitation thresholds. For the heavier rainfall threshold such as 80 mm, CLRSKY produces a 25 % TS improvement when compared to CON. Relative to CLRSKY, ALLSKY also shows comparable or slightly improved TS except for the largest threshold (100 mm), likely due to the northward rainfall centre.
Fig. 13 The threat scores of 24-h accumulated rainfall from 1200 UTC 29 to 1200 UTC 30 October for the three experiments at 10, 20, 30, 50, 80 and 100 mm precipitation thresholds.
5.7. Sensitivity to channel reduction
AMSR2 channels 5–8 at lower frequencies (10.65 GHz and 18.7 GHz) are more sensitive to surface emissivity. An additional experiment (denoted as ‘CHAN9-12’) was conducted to see the sensitivity of removing these channels in all-sky experiment. a–c displays SLP overlaid with surface wind, the west-east cross section of horizontal wind speed, and temperature anomaly from the new experiment's analysis at 1800 UTC 27 October 2012. The new experiment obtains a minimal SLP of 964 hPa, which is very close to 965 hPa from the ECMWF analysis and much stronger than 971 hPa from the original ALLSKY experiment (renamed as ‘CHAN5-12’). The warm-core signal in CHAN9-12 is also stronger than that in CHAN5-12 and closer to that in ECMWF analysis. The analysed brightness temperature, CLWP and TPW at the same time from CHAN9-12 are shown in d–f. Clearer hurricane spiral structures can be seen when compared with those from CHAN5-12 as shown in d, h and i and apparently agree more closely with AMSR2 observations and retrieval products.
Fig. 14 The analysis at 1800 UTC 27 October 2012 from the experiment ‘CHAN9-12’: (a) the SLP and surface wind, (b) the west-east cross section of horizontal wind speed and (c) temperature anomaly along the black line in a, (d) brightness temperature, (e) CLWP and (f) TPW. 72 h forecast track error (g), CSLP error (h) and TS (i) for 24 h accumulated precipitation from 1200 UTC 29 October to 1200 UTC 30 October are shown for both CHAN9-12 (red) and CHAN5-12 (blue) experiments.
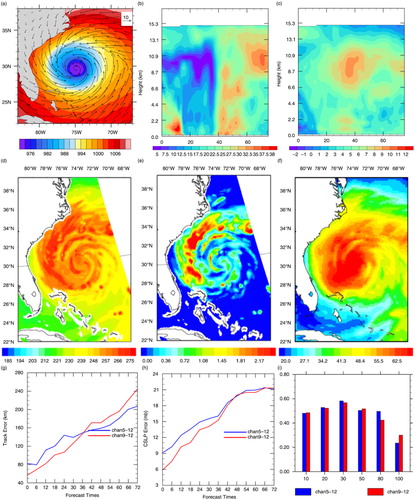
Seventy two hours forecast track error, CSLP error and TS of 24 h accumulated precipitation from 1200 UTC 29 October to 1200 UTC 30 October are given in g–i for both CHAN9-12 and CHAN5-12 experiments. Removing channels 5–8 leads to substantial improvement on track and CSLP forecasts up to 36-h. Because CHAN9-12 makes slight southward landfall (not shown), compared with CHAN5-12, the TS for heavy rain is also improved. These overall positive analysis and forecast impact of removing channels 5–8 (i.e. negative impact of adding them) may be due to inaccurate emissivity calculated from the background ocean surface wind, which are more crucial to assimilate these lower frequency channels. More efforts are needed to improve emissivity modelling or add surface wind speed as a control variable in order to better assimilate these channels in the future (e.g. Kazumori et al., Citation2008).
6. Conclusions
This study is the first attempt to assimilate AMSR2 radiance data using WRFDA with the 3DVAR scheme and to evaluate its impact on the analyses and forecasts of Hurricane Sandy (2012). In particular, procedures for assimilating AMSR2 radiances in all-sky conditions were developed following Liu et al. (Citation2009). A symmetric observation error model for AMSR2 all-sky radiance assimilation, in which the observation errors are characterised as a function of the cloud amount, was implemented following Geer and Bauer (Citation2011). Moreover, the observation error statistics were obtained using data during the lifetime of Hurricane Sandy. The forecast-analysis cycling experiments were conducted using WRF and WRFDA-3DVAR to evaluate the impact of assimilating clear-sky and all-sky AMSR2 radiances, comparing to a benchmark experiment without the assimilation of AMSR2 radiances. Another experiment was performed to study the sensitivity of removing AMSR2 lower frequency channels 5–8.
With all-sky AMSR2 assimilation, more cloud/precipitation-affected observations were assimilated around TC core areas. Better hurricane structure, CSLP and cloud distributions were produced. Significant and consistent error reductions on track and CSLP were obtained in both the CLRSKY and ALLSKY experiments from analysis time to 72-h forecasts. Moreover, the ALLSKY experiment brought better track and CSLP forecast than the CLRSKY did. Verifying against the ECMWF analysis and the Stage IV precipitation analysis, positive forecast impact from assimilating AMSR2 radiances was achieved, and ALLSKY gained an overall lager improvement. Furthermore, removing AMSR2 channels 5–8 in all-sky assimilation results in further overall improvement on analysis and forecast, likely due to inaccurate surface emissivity calculation based on the background surface wind speed.
Further improvements could be made for all-sky radiance assimilation in the future. For example, the all-sky experiment used the same VarBC predictors as in the clear-sky one in this study. It is desirable to consider cloud/precipitation-related predictors and/or take into account the systematic errors related to the RTM in all-sky assimilation. In addition, other advanced assimilation method, such as 4DVAR and ensemble-based scheme, could be more effective in extracting information in cloudy areas through the use of the flow-dependent BE covariance, and should be explored for all-sky radiance assimilation in future studies.
7. Acknowledgements
The first author was jointly supported by National Basic Research Program of China (2013CB430102), National Natural Science Foundation of China (41430427), Key University Science Research Project of Jiangsu Province (11KJA170001), and the Priority Academic Program Development of Jiangsu Higher Education Institutions (PAPD). The authors would like to express their sincere thanks to the anonymous reviewers for their valuable comments on the earlier versions of the manuscript, and Michael Kavulich, Hailing Zhang for editing the manuscript. We are also grateful to the United States Navy Research Laboratory and Panasonic Avionics Corporation for partially funding this work. NCAR is sponsored by the National Science Foundation.
Related Research Data
References
- Auligné T. , McNally A. P. , Dee D. P . Adaptive bias correction for satellite data in a numerical weather prediction system. Q. J. Roy. Meteorol. Soc. 2007; 133: 631–642.
- Backus G. , Gilbert F . Uniqueness in the inversion of inaccurate gross earth data. Philos. Trans. Roy. Soc. 1970; 266: 123–192.
- Barker D. M. , Huang X. , Liu Z. , Auligne T. , Zhang X. , co-authors . The weather research and forecasting (WRF) model's community variational/ensemble data assimilation system: WRFDA. Bull. Am. Meteorol. Soc. 2012; 93: 831–843.
- Bauer P. , Auligné T. , Bell W. , Geer A. J. , Guidard V. , co-authors . Satellite cloud and precipitation assimilation at operational NWP centres. Q. J. Roy. Meteorol. Soc. 2011; 137: 1934–1951.
- Bauer P. , Geer A. J. , Lopez P. , Salmond D . Direct 4D-Var assimilation of all-sky radiances. Part I: implementation. Q. J. Roy. Meteorol. Soc. 2010; 136: 1868–1885.
- Bauer P. , Lopez P. , Benedetti A. , Salmond D. , Moreau E . Implementation of 1D+4D-Var assimilation of precipitation affected microwave radiances at ECMWF. I: 1D-Var. Q. J. Roy. Meteorol. Soc. 2006; 132: 2277–2306.
- Bell W. , Candy B. , Atkinson N. , Hilton F. , Baker N , co-authors . The assimilation of SSMIS radiances in numerical weather prediction models. IEEE Trans. Geosci. Remote Sensing. 2008; 46: 884–900.
- Blake E. S. , Kimberlain T. B. , Berg R. J. , Cangialosi J. P. , Beven J. L. II . Tropical cyclone report: Hurricane Sandy (AL182012). Technical Report, Natl. Hurricane Cent. Miami, Florida, 157 pp. 2013
- Chen F. , Dudhia J . Coupling an advanced land-surface/hydrology model with the Penn State/NCAR MM5 modeling system Part I: model description and implementation. Mon. Weather Rev. 2001; 129: 569–585.
- Dee D. P . Variational bias correction of radiance data in the ECMWF system. Proceedings of the ECMWF Workshop on Assimilation of High Spectral Resolution Sounders in NWP. 2004. Reading, UK, 28 June–1 July.
- Dee D. P. , da Silva A. M . The choice of variable for atmospheric moisture analysis. Mon. Weather Rev. 2010; 131: 155–171.
- Derber J. C. , Wu W.-S . The use of TOVS cloud-cleared radiances in the NCEP SSI analysis system. Mon. Weather Rev. 1998; 126: 2287–2299.
- Dudhia J . Numerical study of convection observed during the winter monsoon experiment using a mesoscale two-dimensional model. J. Atmos. Sci. 1989; 46: 3077–3107.
- Fiorino M . Record-setting performance of the ECMWF IFS in medium-range tropical cyclone track prediction. ECMWF Newslett. 2009; 118: 20–27.
- Geer A. J. , Bauer P . Enhanced Use of All-Sky Microwave Observations Sensitive to Water Vapor, Cloud and Precipitation, Technical Memo. 2010. ECMWF, Reading, UK, 620, 41 pp.
- Geer A. J. , Bauer P . Observation errors in all-sky data assimilation. Q. J. Roy. Meteorol. Soc. 2011; 137: 2024–2037.
- Geer A. J. , Bauer P. , Lopez P . Direct 4D-Var assimilation of all-sky radiances. Part II: assessment. Q. J. Roy. Meteorol. Soc. 2010; 136: 1886–1905.
- Greenwald T. J. , Hertenstein R. , Vukicevic T . An all-weather observational operator for radiance data assimilation with mesoscale forecast models. Mon. Weather Rev. 2002; 130: 1882–1897.
- Guidard V. , Fourrié N. , Brousseau P. , Rabier F . Impact of IASI assimilation at global and convective scales and challenges for the assimilation of cloudy scenes. Q. J. Roy. Meteorol. Soc. 2011; 137: 1975–1987.
- Han Y. , van Delst P. , Liu Q. , Weng F. , Yan B , co-authors . JCSDA Community radiative Transfer Model (CRTM)-Version 1. NOAA Tech. Rep. NESDIS. 2006; 122 33 pp.
- Harris B. A. , Kelly G . Asatellite radiance-bias correction scheme for data assimilation. Q. J. Roy. Meteorol. Soc. 2001; 127: 1453–1468.
- Heilliette S . Assimilation of cloud-affected infrared radiances at environment Canada. ECMWF-JCSDA Workshop. 2010. 15–17 June 2010, Reading, UK.
- Heilliette S. , Garand L . A practical approach for the assimilation of cloudy infrared radiances and its evaluation using AIRS simulated observations. Atmos. Ocean. 2007; 45: 211–225.
- Hong S. , Lim J. J . The WRF Single-Moment 6-Class Microphysics Scheme (WSM6). J. Korean Meteorol. Soc. 2006; 42: 129–151.
- Hong S. , Noh Y. , Dudhia J . Anew vertical diffusion package with an explicit treatment of entrainment processes. Mon. Weather Rev. 2006; 134: 2318–2341.
- Hsiao L. , Liou C. , Yeh T. , Guo Y. , Chen D. , co-authors . A vortex relocation scheme for tropical cyclone initialization in advanced research WRF. Mon. Weather Rev. 2010; 138: 3298–3315.
- Iacono M. J. , Delamere J. S. , Mlawer E. J. , Shephared M. W. , Clough S. A. , co-authors . Radiative forcing by longlived greenhouse gases: calculations with the AER radiative transfer models. J. Geophys. Res. 2008; 113: 13103.
- Imaoka K. , Kachi M. , Fujii H. , Murakami H. , Hori M. , co-authors . Global change observation Mission (GCOM) for monitoring carbon, water cycles, and climate change. Proc. IEEE. 2010; 98M: 717–734.
- Junker N. W. , Hoke J. E. , Sullivan B. E. , Brill K. F. , Hughes F. J . Seasonal and geographic variations in quantitative precipitation prediction by NMC's nested-grid model and medium-range forecast model. Weather Forecast. 1992; 7: 410–429.
- Kawanishi T. , Sezai T. , Ito Y. , Imaoka K. , Takeshima T. , co-authors . The advanced microwave scanning radiometer for the earth observing system (AMSR-E), NASDA's contribution to the EOS for global energy and water cycle studies. IEEE Trans. Geosci. Remote Sensing. 2003; 41: 184–194.
- Kazumori M . Satellite radiance assimilation in the JMA operational mesoscale 4DVAR system. Mon. Weather Rev. 2014; 142: 1361–1381.
- Kazumori M. , Egawa T . Assimilation of GCOM-W/AMSR2 Radiance Data in the JMA NWP Systems. WGNE Blue Book: Research Activities in Atmospheric and Ocean Modeling. 2014. WMO/Working Group on Numerical Experimentation. 1. 07-08.
- Kazumori M. , Geer A. J. , English S. J . Effects of All-Sky Assimilation of GCOM-W1/AMSR2 Radiances in the ECMWF System. 2014. Technical Memo 732. ECMWF, Reading, UK, 34 pp.
- Kazumori M. , Liu Q. , Treadon R. , Derber J. C . Impact study of AMSR-E radiances in the NCEP global data assimilation system. Mon. Weather Rev. 2008; 136: 541–559.
- Kim M. , English S. , Bauer P. , Geer A. , Okamoto K . Comparison of Progress in Assimilating Cloud-Affected Microwave Radiances at NCEP, ECMWF, JMA and the Met Office. 2008. Document NWPSAF-MO-VS-037. EUMETSAT, Hessen, Germany.
- Kummerow C. , Barnes W. , Kozu T. , Shiue J. , Simpson J . The Tropical Rainfall Measuring Mission (TRMM) sensor package. J. Atmos. Ocean. Technol. 1998; 15: 809–817.
- Kunkee D. B. , Poe G. A. , Boucher D. J. , Swadley S. D. , Hong Y. , co-authors . Design and evaluation of the first special sensor microwave imager/sounder. IEEE Trans. Geosci. Remote Sensing. 2008; 46: 863–883.
- Li X. , Ming J. , Xue M. , Wang Y. , Zhao K . Implementation of a dynamic equation constraint based on the steady state momentum equations within the WRF hybrid ensemble 3DVar data assimilation system and test with radar T-TREC wind assimilation for tropical Cyclone Chanthu (2010). J. Geophys. Res. Atmos. 2015; 120: 4017–4039.
- Liu Z. , Barker D. M . Radiance assimilation in WRF-Var: implementation and initial results. 7th WRF Users Workshop. 2006. June 19–22, Boulder, CO.
- Liu Z. , Rabier F . The interaction between model resolution, observation resolution and observation density in data assimilation: a one-dimensional study. Q. J. Roy. Meteorol. Soc. 2002; 128: 1367–1386.
- Liu Z. , Rabier F . The potential of high-density observations for numerical weather prediction. Q. J. Roy. Meteorol. Soc. 2003; 129: 3013–3035.
- Liu Z. , Schwartz C. S. , Snyder C. , Ha S . Impact of assimilating AMSU-A radiances on forecasts of 2008 Atlantic tropical cyclones initialized with a limited-area Ensemble Kalman Filter. Mon. Weather Rev. 2012; 140: 4017–4034.
- Liu Z. , Zhang X. , Auligné T. , Lin H . Variational Analysis of Hydrometeors with Satellite Radiance Observations: a simulated study. 10th WRF Users’ Workshop. 2009. 23–26 June 2009, Boulder, CO.
- Lupu C. , McNally A. P . Assimilation of cloud-affected radiances from Meteosat-9 at ECMWF. EUMETSAT/ECMWF Fellowship Programme Research Reports. 2012. ECMWF, Reading, UK, 33 p.
- Macpherson B . Operational experience with assimilation of rainfall data in the Met Office mesoscale model. Meteorol. Atmos. Phys. 2001; 76: 3–8.
- Maeda T. , Imaoka K . GCOM-W1 AMSR2 level 1R product: dataset of brightness temperature resampled by antenna pattern matching. 35th Canadian Symposium on Remote Sensing. 2014. July 13–18, 2014, Quebec, Canada.
- McNally A. P . A note on the occurrence of cloud in meteorologically sensitive areas and the implications for advanced infrared sounders. Q. J. Roy. Meteorol. Soc. 2002; 128: 2551–2556.
- McNally A. P . The direct assimilation of cloud-affected satellite infrared radiances in the ECMWF 4D-Var. Q. J. Roy. Meteorol. Soc. 2009; 129: 2411–2323.
- McNally T. , Bonavita M. , Thépaut J . The Role of Satellite Data in the Forecasting of Hurricane Sandy. Mon. Weather Rev. 2014; 142: 634–646.
- Mlawer E. J. , Taubman S. J. , Brown P. D. , Iacono M. J. , Clough S. A . Radiative transfer for inhomogeneous atmosphere: rRTM, a validated correlated-k model for the long-wave. J. Geophys. Res. 1997; 102: 16663–16682.
- Monin A. S. , Obukhov A. M . Basic laws of turbulent mixing in the surface layer of the atmosphere. Contribut. Geophys. Inst. Slovak Acad. Sci. 1954; 24: 163–187.
- Moreau E. , Lopez P. , Bauer P. , Tompkins A. M. , Janiskova M. , co-authors . Variational retrieval of temperature and humidity profiles using rain rates versus microwave brightness temperatures. Q. J. Roy. Meteorol. Soc. 2004; 130: 617–628.
- Okamoto K . Assimilation of overcast cloudy infrared radiances of the geostationary MTSAT-1R imager. Q. J. Roy. Meteorol. Soc. 2013; 139: 715–730.
- Pangaud T. , Fourrié N. , Guidard V. , Dahoui M. , Rabier F . Assimilation of AIRS radiances affected by mid- to low-level clouds. Mon. Weather Rev. 2009; 137: 4276–4292.
- Parrish D. F. , Derber J. C . The National Meteorological Center's spectral statistical interpolation analysis system. Mon. Weather Rev. 1992; 120: 1747–1763.
- Pavelin E. G. , English S. J. , Eyre J. R . The assimilation of cloud-affected infrared satellite radiances for numerical weather prediction. Q. J. Roy. Meteorol. Soc. 2008; 134: 737–749.
- Petty G . Physical retrievals of over-ocean rain rate from multichannel microwave imagery. Part I: theoretical characteristics of the normalized polarization and sattering indices. Meteorol. Atmos. Phys. 1994; 54: 79–99.
- Petty G. , Katsaros K . Precipitation observed over the South China Sea by the Nimbus-7 scanning multichannel microwave radiometer during winter MONEX. J. Appl. Meteorol. 1990; 29: 273–287.
- Renshaw R. , Francis P. N . Variational assimilation of cloud fraction in the operational Met Office Unified Model. Q. J. Roy. Meteorol. Soc. 2011; 137: 1963–1974.
- Skamarock W. C. , Klemp J. B. , Dudhia J. , Gill D. O. , Barker D. M , co-authors . A Description of the Advanced Research WRF version 3. 2008. NCAR Tech. Note NCAR/TN-475+STR, 133 pp.
- Sun N. , Weng F . Retrieval of cloud ice water path from special sensor microwave imager/sounder (SSMIS). J. Appl. Meteorol. Climatol. 2011; 51: 366–379.
- Tauchi T. , Takeuchi Y. , Sato Y . Assimilation of the Aqua/AMSR-E data to numerical weather predictions. Proceedings of Geoscience and Remote Sensing Symposium, IGARSS ‘04. IEEE International. 2004. IEEE Operations Center, Piscataway, NJ, pp. 3199–3202.
- Taylor R. , Renshaw R. , Saunders R. , Francis P . Assimilation of SEVIRI cloud-top parameters in the Met Office regional forecast model. In: 2008 EUMETSAT Meteorological Satellite Conference, September 8–12. 2008. Darmstadt, Germany.
- Tiedtke M . A comprehensive mass flux scheme for cumulus parameterization in large-scale models. Mon. Weather Rev. 1989; 117: 1779–1800.
- Tsuyuki T. , Koizumi K. , Ishikawa Y . The JMA mesoscale 4DVAR system and assimilation of precipitation and moisture data. Proceeding Workshop on Humidity Analysis, Reading, United Kingdom. 2002. Reading, UK, ECMWF, pp. 59–67.
- Wang P. , Li J. , Goldberg M. D. , Schmit T. J. , Lim A. H. N. , co-authors . Assimilation of thermodynamic information from advanced infrared sounders under partially cloudy skies for regional NWP. J. Geophys. Res. Atmos. 2015; 120: 5469–5484.
- Wang P. , Li J. , Li J. , Li Z. , Schmit T. J. , Bai W . Advanced infrared sounder subpixel cloud detection with imagers and its impact on radiance assimilation in NWP. Geophys. Res. Lett. 2014; 41: 1773–1780.
- Weng F . Advances in radiative transfer modeling in support of satellite data assimilation. J. Atmos. Sci. 2007; 64: 3799–3807.
- Weng F. , Grody N. C . Retrieval of ice cloud parameters using a microwave imaging radiometer. J. Atmos. Sci. 2000; 57: 1069–1081.
- Xiao Q. , Kuo Y. H. , Sun J. , Lee W. C. , Barker D. M . An approach of radar reflectivity data assimilation and its assessment with the inland QPF of typhoon Rusa (2002) at landfall. J. Appl. Meteorol. Clim. 2007; 46: 14–22.
- Zhang C. , Wang Y. , Hamilton K . Improved representation of boundary layer clouds over the southeast Pacific in ARW-WRF using a modified Tiedtke cumulus parameterization scheme. Mon. Weather Rev. 2011; 139: 3489–3513.
- Zhu T. , Weng F . Hurricane Sandy warm-core structure observed from advanced Technology Microwave Sounder. Geophys. Res. Lett. 2013; 40: 3325–3330.
- Zhu Y., Derber J., Collard A., Dee D., Treadon R., co-authors. Enhanced radiance bias correction in the National Centers for Environmental Prediction's Gridpoint Statistical Interpolation data assimilation system. Q. J. Roy. Meteorol. Soc. 2013; 140: 1479–1492. DOI: http://dx.doi.org/10.1002/qj.2233.
- Zou X . Introduction to microwave imager radiance observations from polar-orbiting meteorological satellites. Adv. Meteorol. Sci. Technol. 2012; 2(3): 45–50 (in Chinese).