
Abstract
In order to access the effect of the lakes in the atmospheric electrical field, measurements have been carried out near a large man-made lake in southern Portugal, the Alqueva reservoir, during the ALqueva hydro-meteorological EXperiment 2014. The purpose of these conjoint experiments was to study the impact of the Alqueva reservoir on the atmosphere, in particular on the local atmospheric electric environment by comparing measurements taken in the proximity of the lake. Two stations 10 km apart were used, as they were located up- and down-wind of the lake (Amieira and Parque Solar, respectively), in reference to the dominant northwestern wind direction. The up-wind station shows lower atmospheric electric potential gradient (PG) values than the ones observed in the down-wind station between 12 and 20 UTC. The difference in the atmospheric electric PG between the up-wind and the down-wind station is ~30 V/m during the day. This differential occurs mainly during the development of a lake breeze, between 10 and 18 UTC, as a consequence of the surface temperature gradient between the surrounding land and the lake water. In the analysis presented, a correlation is found between the atmospheric electric PG differences and both wind speed and temperature gradients over the lake, thus supporting the influence of the lake breeze over the observed PG variation in the two stations. Two hypotheses are provided to explain this observation: (1) The air that flows from the lake into the land station is likely to increase the local electric conductivity through the removal of ground dust and the transport of cleaner air from higher altitudes with significant light ion concentrations. With such an increase in conductivity, it is expected to see a reduction of the atmospheric electric PG; (2) the resulting air flow over the land station carries negative ions formed by wave splashing in the lake's water surface, as a result of the so-called balloelectric effect. These negative ions will form a space-charge density (SCD) that can reduce the atmospheric electric PG. A formulation is derived here in order to estimate the local SCD.
1. Introduction
It is well recognised that the lakes influence the weather and the climate at various spatio-temporal scales. For this reason, the numerical weather prediction models have recently been integrating representations of the lake–atmosphere interactions, confirming its importance at a global (e.g. Balsamo et al., Citation2012 and references therein) and local scale (e.g. Salgado and Le Moigne, Citation2010). However, the lake effects on the atmospheric electric field are much less known and studied.
A wide range of electrical measurements have been carried out in close proximities to different water environments such as lakes (e.g. Gathman and Hoppel, Citation1970), sea (e.g. Blanchard, Citation1966; Muir, Citation1977a; Trevitt, Citation1984; Reiter, Citation1994) and waterfalls (e.g. Reiter, Citation1994; Laakso et al., Citation2007; Kolarz et al., Citation2012). Most measurements show that the presence of such bodies of water can affect the nearby electrical environment by producing a local space-charge density (SCD), where SCD denotes the net imbalance between positive and negative charge carriers. Unlike the seashore environments, relatively little exploration of lake impacts on the electrical environment has been made in the literature, with the main contribution coming from a study by Gathman and Hoppel (Citation1970). Their measurements over Lake Superior (USA) demonstrated the formation of negative SCD, thought to be linked to the breaking of fresh water waves, promoting multiple sources of negative charges dispersed over the lake region and its transportation by the wind to the measuring site (up-wind, in this case). Contrary to the negative SCD observed over Lake Superior, previous seashore experiments have found that predominantly positive SCD can be developed in the nearshore environment (e.g. Blanchard, Citation1954, Citation1955, Citation1958).
The reason for the different polarity of SCD produced over lakes and at the seashore was further investigated by Reiter (Citation1994), who measured SCD in the Mediterranean Sea and was able to separate the SCD produced by droplets of varying sizes. The author showed that smaller droplets down to 0.2 µm were negatively charged, whilst sea spray droplets >2.5 µm were positively charged; the predominantly positive SCD previously measured by Blanchard was likely due to the lack of information on the contribution of the small droplet fraction. Reiter (Citation1994) was able to confirm his observations by performing SCD measurements near waterfalls, which are known to form negative SCD by the so-called balloelectric effect, also known as the ‘Lenard effect’ (Lenard, Citation1892). The balloelectric effect consists in the generation of electric charge by splashing of water, and its present view explains the observation of negative SCD during rain generated by rain-induced ion bursts associated with the breaking of the water droplets into various small negative droplets and one large positive droplet (e.g. Smiddy and Chalmers, Citation1960; Hirsikko et al., Citation2007). In fact, recent studies made in waterfalls have confirmed that smaller droplets are mostly negatively charged whilst the larger ones are positively charged, for example, Laakso et al. (Citation2007) and Kolarz et al. (Citation2012). Additionally, laboratory experiments conducted by Tammet et al. (Citation2009) have shown the formation of negatively charged nanoparticles produced by splashing of water, thus supporting previous observations and allowing to explain the negative electrification observed over Lake Superior. Commonly, these negatively charged nanoparticles are known as negative ion clusters (Harrison and Aplin, Citation2007) and a similar designation is used for positively charged nanoparticles, positive ion clusters.
Another important mechanism for SCD formation is the well-documented ‘electrode effect’ (e.g. Chalmers, Citation1946; Adkins, Citation1959; Law, Citation1963; Bent and Hutchinson, Citation1966). This effect, which tends to form positive SCD near the Earth's surface, is a result of the movement of atmospheric ions under the fair weather (FW), which, according to the international standards (Voeikov, Citation1965), are days selected as those with cloudiness <0.2, wind speed <~5 m/s and with the absence of either fog or precipitation. Such movement characterises an atmospheric electric field in which positive ion clusters move downwards and negative go upwards. This results in the formation of a layer of positive SCD near to the Earth's surface (up to ~1 m in height). This mechanism is naturally balanced over land through the ionisation caused by the natural radioactive decay of radon (222Rn) and its decay products (but not so over the oceans where there is no contribution to the ionisation rate from radon). Moreover, the influence of radon emissions in the lower troposphere can also contribute to variations in the electrical environment since, in relatively large concentrations, they can ionise the local atmosphere (Lopes et al., Citation2015), leading to a reduction of the local atmospheric electric potential gradient (PG).
In atmospheric electricity, PG is the most commonly measured variable used to quantify the observed changes in the atmospheric electric environment. The adopted convection is that the PG is defined by F=dV/dz, where V is the potential with respect to the Earth's surface (where V=0) and z is the vertical coordinate (pointing upwards from the Earth's surface). Here, the PG is considered positive for FW days and is related to the vertical component of the atmospheric electric field E
z
by E
z
=−F. Also under FW conditions, the daily PG variation is directly related to the daily variation of the Global Electrical Circuit (GEC), following the so-called Carnegie curve, as a result from the terrestrial thunderstorm activity, which exhibits a minimum at ~04 UTC and a maximum at ~19 UTC (Harrison, Citation2013). However, local effects occurring within the planetary boundary layer (PBL) often disturb the behaviour imposed by the GEC. The PBL is considered to be the lowest portion of the atmosphere (from the surface up to typical heights of 1–2 km), being directly influenced by the Earth's surface through its forcing within a timescale less than 1 hour. As the result of turbulent transport processes, due to the surface heating cycle, the PBL has a characteristic diurnal variation over land (Stull, Citation1989). Transport processes are of particular importance during summer in lake regions. During sunlit hours, the land surface is warmer than the lake water's surface, resulting in updrafts of air over land and downdrafts of air over the lake, creating a local atmospheric circulation system (lake breeze). The air that flows inland is expected to increase the local electric conductivity by removing ground aerosols, mostly dust, and bringing cleaner air from higher altitudes with significant small ion concentrations. Such an increase in conductivity will result in a reduction of the atmospheric electric PG, according to the quasi-static Ohm's law:1
where J z is the air-Earth density current (usually with values of ~2 pA m−2) and σ t is the atmospheric electric conductivity. The mechanism relating the aerosol concentration and the conductivity is well known and is due to the scavenging of smaller ions by the larger aerosol particles (Silva et al., Citation2014, Citation2015).
This study relates to a field summer campaign carried out at the Alqueva reservoir (Portugal) known as the ALqueva hydro-meteorological EXperiment 2014 (ALEX2014, www.alex2014.cge.uevora.pt). During its course, PG measurements were performed in two stations: up- and down-wind of the lake (Amieira and Parque Solar, respectively) in reference to the dominant northern wind direction. This article seeks to investigate the possible effect of the Alqueva reservoir on the local atmospheric electric environment by comparing PG measurements taken in the proximity of the lake and their relation with local meteorological variables at a diurnal scale. This work is organised as follows: Section 2 gives an overview of the Alqueva reservoir; Section 3 depicts the methodology adopted for the data acquisition; in Section 4, results of the PG observations are shown, whilst in Section 5 a discussion over the obtained results is provided; conclusions are given in Section 6.
2. Alqueva reservoir
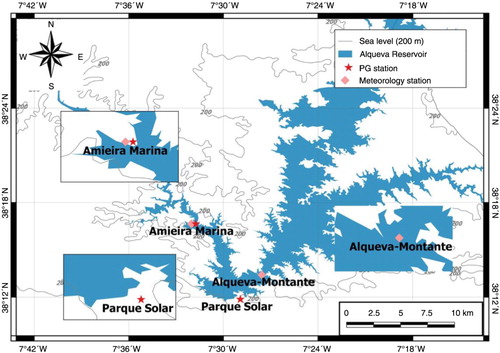
The Alqueva reservoir is currently the largest man-made lake in Western Europe and is a result of the Alqueva dam built in the Portuguese territory, in the Guadiana River (). The lake is situated in the interior of Portugal, in the Alentejo region, a scarcely populated vast region with a stable geological activity. The area is characterised by the climate of the Portuguese Guadiana Basin, which is mostly of the Mediterranean type (Csa, according to the Köppen classification), with a small area within the mid-latitude steppe (Bsk) category. In summer, the maximum air temperature ranges between 31 and 35 °C on average (July and August), often reaching values close to 40 °C, or higher. The incident solar radiation at the surface is of the highest in Europe, with mean daily values (integrating over 24 hours) of about 300 Wm−2 and the daily maximum is often >1000 Wm−2 in July. Rainfall is very rare during this time of the year.
Fig. 1 Geographic location of the two sites used for measurements of the atmospheric electric field: Amieira (AMI) and Parque Solar (PS). The lake meteorological station (Alqueva-Montante) is also depicted. Constant surface elevation lines (200 m) are added in the map.
The synoptic circulation in the region during the summer months is dominated by the frequent development of the shallow Iberian low-pressure system inside a larger scale high-pressure system, the Azores anticyclone. This thermal low reinforces and organises a sea breeze system at the Iberian scale, so that marine sea air mass penetrates inland, reaching up to ~100 km (Salgado et al., Citation2015). This phenomenon is known as the Iberian thermal low (Hoinka and Castro, Citation2003), starting near the coast around noon and reaching the inland region more in the afternoon. The Iberian thermal low is characterised by a westward change of the wind direction (prevailing wind directions are from the north–west quadrant). The arrival of the sea breeze is evident in the Alqueva region, but it is not expected to affect the local PG. The sea breeze regime has been shown to have an impact on PG measurements recorded in Lisbon (Silva et al., Citation2015), due to the city's proximity to the seashore. Nevertheless, the PG measurements at regions located ~100 km inland (as it is the case of the present data) are not expected to be influenced by the water particles advected by the sea breeze. Marine ions generated in the seashore (mostly salts) would have to travel for around 7 hours to reach these regions, such a timescale is much higher than the timescale for ion recombination, which is around 20 seconds (Retalis et al., Citation1991), and for that reason, they should not affect PG measurements in the Alqueva region.
Moreover, and in the context of air pollution, two AERONET stations (Holben et al., Citation1998), Évora (Portugal) and Badajoz (Spain), operate in the region to the north of Alqueva, spanning a triangle with sizes that represent distances smaller than 100 km. These instruments perform spectral aerosol optical depth (AOD) measurements, which represent a measure of the solar radiation extinction due to the aerosol load present in the atmospheric column. The optical depth measurements were found to be similar at both stations, which can be explained by the relatively small distances between the sites. Low AODs were observed, mean (median) AOD440 of 0.12 (0.09) and mean (median) AOD870 of 0.04 (0.03), which are in good agreement with criteria established by Elias et al. (Citation2006) for clean aerosol days (AOD440 below 0.12 and AOD870 below 0.04).
3. Methodology
PG and other atmospheric parameters were measured at different sites nearby and over the Alqueva reservoir (). The data, acquired during the inter-disciplinary meteorological summer campaign (ALEX2014), depict a period of 3 months from June to September 2014. The campaign's main focus was the study of a variety of possible impacts of the Alqueva reservoir on the local environment, in particular, the assessment of the lake's influence on the local PG. For that purpose, two different stations were chosen: Amieira (AMI) and Parque Solar (PS); AMI (38.27 N, 7.53 W) and PS (38.20 N, 7.49 W) are located on the shoreline of the southern part of the lake (), with the two being separated by ~10 km. AMI is on the up-wind lakeside (in reference to the dominant northwestern wind), set upon a hill ~30 m from the lakeshore with low vegetation in its surroundings (very few trees are present). The PS station is on the down-wind lakeside (in reference to the dominant northwestern wind), set in an area with vegetation and a set of solar panels around. Installed at a similar height of AMI, PS is located ~60 m from a low traffic road and is about a distance of ~340 m from the lakeshore.
The continuous monitoring of PG was conducted simultaneously using two identical electrostatic field mills, JCI 131F (Chubb, Citation2014, Citation2015) manufactured by Chilworth (UK). The sensors were set for measurements with sensitivities up to 2 kV/m, providing high precision with instrumental uncertainties <1.5% of the measurement, ~1 V/m low noise levels and a significant stable zero. These sensors had been recently calibrated (December 2013) and were installed at ~2 m height above ground in order to minimise any perturbations in the measurements due to insects, animals, water and dirt. Measurements were performed at 1 Hz, and mean PG values for 1-minute intervals were recorded (no information of sub-minute timescales was retained) in the two stations. Additionally, meteorological stations were installed near the PG sensors and also over the lake (at 2 m height) on a floating platform located in the middle of the principal branch of the reservoir (Alqueva-Montante station, ). These stations provided simultaneous measurements of air temperature, relative air humidity, wind vector and precipitation.
Seventeen days of FW were chosen based on local undisturbed daily solar radiation curves, cloud-free days and the availability of PG data in both AMI and PS. Solar radiation was recorded at Alqueva-Montante station in the period of June to August 2014, as described in Lopes et al. (Citation2015). For these days, the sunrise and sunset were calculated from the local maxima of the second derivative of each daily solar radiation curve (adjusted to a four terms Gaussian model to avoid the noise from the measurements) and the maximum solar radiation from the maximum of the solar radiation curve directly. The values found were then averaged and the respective standard deviations were used as an indication of its error. Thus, on average, the calculated sunrise time was 6.4±0.3 (UTC), solar maximum 12.6±0.2 (UTC) and sunset 18.9±0.1 (UTC). Finally, and for spectral analysis purposes, the Lomb–Scargle Periodogram (LSP) technique is used here, since it was specifically developed for time series with irregular sampling intervals (Lomb, Citation1976; Scargle, Citation1982) as is the case of PG restricted to FW days (details can be found in Silva et al., Citation2014). In our analysis, the R-package ‘lomb’ was used and more details can be found in Ruf (Citation1999).
4. Observations
Two distinct distributions of PG can be observed () in the raw data for AMI and PS, indicating that the PG at the two relatively close measuring locations is being affected differently by local factors. Both distributions show a larger frequency of occurrences for values between 50 and 100 V/m, within the expected for the FW criteria. Moreover, minima and maxima exist in the two time series beyond the expected range of values under FW, implying that local influences are in fact present. Such influences could be related to suspended dust particles, as the surface tends to be very dry during this time of the year, and the wind could, in some cases, favours dust dispersion. It is important to note that the negative values observed tend to occur during the period of 01–06 UTC, which can be an indication of the formation of a negative SCD in both stations. The corresponding descriptive statistical parameters are summarised in . The mean PG values observed in the proximity of the lake have similar values, 60.1 and 59.7 V/m for AMI and PS, respectively. The standard deviation in the up-wind lakeside station (AMI) is 27.2 V/m, whilst the down-wind lakeside station (PS) seems to depict a higher value, 56.3 V/m. This difference could be related to the fact that PS measurements are more affected by human presence than the ones made at AMI, causing a higher variation in the former station.
Fig. 2 Potential gradient distributions for the raw data in the two study locations: (a) Amieira (AMI) and (b) Parque Solar (PS). Measurements acquired during the 17 observed days of fair weather (11 June to 29 July 2014) in reference to the Alqueva-Montante floating platform.
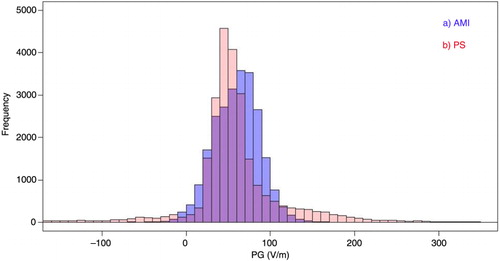
Table 1. Mean, median, standard deviation (Std.), skewness and kurtosis for the PG measurements acquired during the 17 fair-weather days from 11 June to 29 July 2014
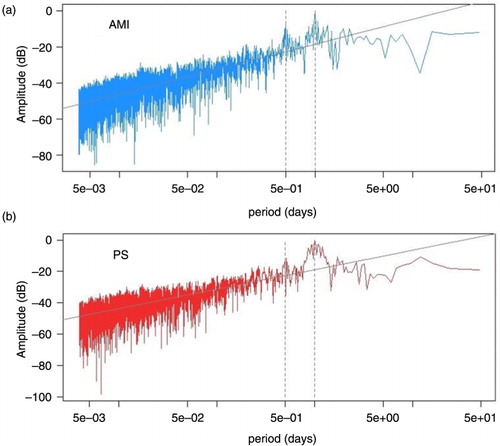
A closer look into the spectral characteristics of the PG data is presented through the use of LSPs for the two stations (). The slopes of the linear fits (for periods below the semi-diurnal cycle) were found to be similar in the two locations, 1.36 and 1.26 for AMI and PS, respectively. These slopes are an estimation of the n-exponent defined by the asymptotic dependence of the spectral amplitude, S, with the period, T, in the following way: S(T) α T n (Silva et al., Citation2014). The values found differ from the n-exponent, characterising turbulence, n=5/3, that is, ~1.67 (Lumley and Panofsky, Citation1964), by 18 and 25% for the AMI and PS cases, respectively. Diurnal and semi-diurnal peaks are observed, as in other studies (Xu et al., Citation2013; Silva et al., Citation2014). The diurnal peak results from the diurnal behaviour of the GEC influence (Harrison, Citation2013), whereas the semi-diurnal peak is usually attributed to the urban pollution cycle (Silva et al., Citation2014). With the latter, it should be taken into account that the present measurements were made in a very low polluted environment, and thus, it may be the result of a sub-harmonic of the main 1-d period (Xu et al., Citation2013) or it could also be a spectral indication of a lake breeze as this meteorological phenomena presents a sub-daily periodicity.
Fig. 3 Lomb–Scargle periodograms in logarithmic scale for PG at (a) AMI and (b) PS. Measurements acquired during the 17 observed days of fair weather (11 June to 29 July 2014) in reference to the Alqueva-Montante floating platform. The linear fits represent the asymptotic spectral behaviour for low periods retrieving the n-exponent (n=1.36 and 1.26 for AMI and PS, respectively). Dashed lines mark the diurnal and semi-diurnal peaks, as determined from solar radiation measurements.
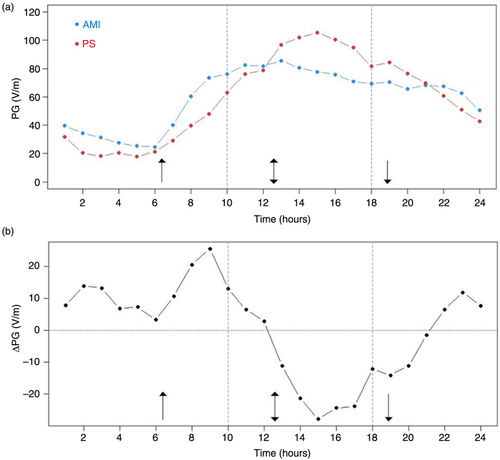
The diurnal variations (i.e. the mean between each daily hour of the 17 d) of the PG at AMI and PS are illustrated in a. Here, the up-ward and down-ward arrows represent the average sunrise and sunset, respectively; the two-headed arrow indicates the average solar maximum. Whilst PG in AMI is shown to be lower than in PS between 13 and 21 UTC, it is higher in the remainder of the day. The PG in both stations increases until it reaches the daily maximum value of 85.6 V/m at 13 UTC and 105.4 V/m at 15 UTC for AMI and PS, respectively. Generically, the PG increases during the day, until ~20 UTC, as a result of the GEC; however in AMI and PS, instead of increasing, it remains almost constant until late evening (22 UTC) in AMI. In the case for PS, the PG shows a decrease during the rest of the day after reaching its daily maximum (15 UTC). This deviation from the behaviour imposed by the GEC in AMI and PS suggests the existence of local perturbations due to the presence of the lake. If the obtained daily values of the PG in AMI are subtracted to PS, ΔPG=PG AMI –PG PS , it is possible to identify in b a signature of a maximum at 9 UTC, ~30 V/m, and a minimum at 15 UTC, ~−30 V/m. Three general tendencies are seen in the ΔPG: (1) it grows in the morning until the maximum at 9 UTC; (2) it decreases until reaching the minimum at 15 UTC; and (3) it increases again towards the end of the day. Such modulation correlates well with the development of the local lake breeze as explained in next section. It is expected that the lake will affect first the PG in PS, as it is down-wind, and so the air coming from the lake by the prevailing winds, reinforced by the local breeze, will reach first PS. When the lake breeze is fully set, then it will affect more considerably AMI, as it is near to the lakeshore. This explains the positive to negative modulation of ΔPG during the day.
Fig. 4 Hourly mean diurnal variation of (a) potential gradient (V/m) at the two measuring locations, AMI and PS; (b) potential gradient difference (ΔPG, V/m) between AMI and PS. Up-ward and down-ward arrows represent the sunrise and sunset, respectively, and the two pointed head arrow mark the solar maximum. The two vertical dashed lines correspond to start and end of the lake breeze.
5. Discussion
The fact that a local lake breeze can develop during the day (10–18 UTC), and that during this period there is a correspondence with negative ΔPG values, suggests lake related meteorological parameters play an important role in the local electric environment evolution throughout the day. Therefore, it is important to have a clear understanding of the lake circulation in order to provide further evidences of the observed effect that the lake breeze has in the local PG. In the summer months, the air temperature in the Alqueva region is higher than the lake's water surface temperature, leading to an inversion of the sensible heat flux signal, that is, negative (from the air above the lake to its surface) in the period 09–22 UTC and positive in the remaining period (not shown here). The resulting pressure difference between land and lake allows the transportation of air from the lake into land, forming the lake breeze, which contributes to an increase in the local wind speed, in particular during the afternoon, until both air (above the lake surface) and water temperatures equalise again (22 UTC).
In the Alqueva reservoir, the lake breeze is observable in the AMI station by a change in the prevailing northern wind directions (mainly NW) to southern directions (between SW and SE) coming from the lake, at midday. This meteorological phenomenon can be depicted in a histogram, with the representation of the number of occurrences per hour of wind directions in the southern sectors during the day (a). It is clear that a minimum in the occurrences of southern winds occurs around 8 UTC, and after which they start to increase until the maximum of southern winds occurrence takes place at 13 UTC (approximately at solar maximum time), decreasing thereafter for the remaining of the day. A substantial increase of the occurrences is evident from 9 to 10 UTC, as well as a clear decrease from 18 to 19 UTC, thus 10 and 18 UTC are set as the start and end hours for the local lake breeze development, respectively. Unfortunately, the wind data available in PS were compromised and to all intents and purposes the AMI measurements are enough to describe what is meant here. To test the lake breeze influence on the local PG, it is fundamental to analyse the wind direction dependence of the ΔPG. This was performed through a boxplot representation (b), where the ΔPG values were divided into four wind sectors in AMI (15-minute resolution): NW, 270 ° ≤θ ≤360 °; NE, 0 ° ≤θ ≤90 °; SE, 90 ° ≤θ ≤180 °; SW, 180 ° ≤θ ≤270 °. Results show a visible modulation of the ΔPG with the wind direction, with the mean values found to be 3.1, 18.7, 2.0, and −21.2 V/m, respectively for NW, NE, SE, and SW sectors. These values tend to show a more negative ΔPG towards the SW sector in comparison with the rest of the wind directions. This comes in agreement with the possible signature of the lake breeze in the PG measurements, particularly in AMI as it is closer to the lakeshore than PS. Other statistical indicators for analysis are presented in , confirming the previous observation.
Fig. 5 (a) Number of occurrences of wind in AMI corresponding to southern directions (SE and SE) revealing the effect of the lake breeze. (b) Boxplot representation of the wind direction dependence of the ΔPG (V/m) between AMI and PS: NW, NE, SE and SW.
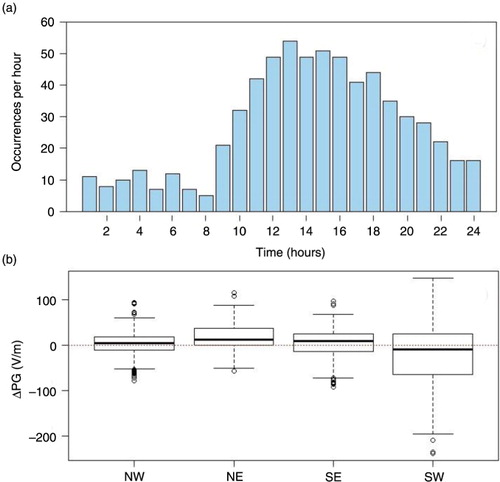
Table 2. Mean, median, standard deviation (Std.), skewness, kurtosis, and number of measurements (N. M.) of ΔPG for the 17 fair-weather days
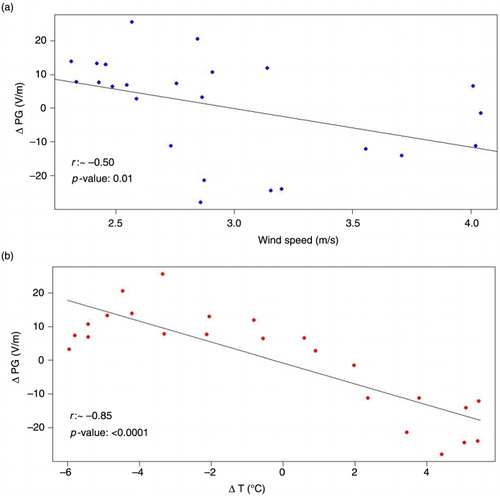
To further explore this relation between the observable ΔPG and the lake wind system, it is expected that an increase of the lake wind speed should imply also an increase in the amount of air that is being transported to inland, especially in AMI due to its closer proximity to the lakeshore in comparison with PS, and thus a reduction is to be expected for the ΔPG with the wind speed. The ΔPG dependence on the lake wind speed (a) measured in Alqueva-Montante shows some dispersion between the daily mean values of both variables with a fair negative correlation found, r~−0.50 (p=0.01), suggesting a direct influence of the lake breeze on the ΔPG. Another important parameter in characterising a lake breeze is the difference between the temperature above and below the surface of the lake, as they are directly related with the development of such breeze. The dependence of the observed ΔPG with the daily mean temperature difference between the surface (2 m height) and the interior (1 m deep) of the lake is depicted in b. A reasonable negative linear relation is observed with a larger correlation coefficient found r ~−0.85 (p<0.0001). Two hypothesis are now provided in order to explain the observed impact that the lake breeze has on the local PG:
(1) During sunlit hours, the land is warmer than the lake's water surface; this updrafts air over land and downdrafts it over the lake. The air then flowing over the land station is likely to increase the local electric conductivity by removing ground dust and bringing cleaner air from higher altitudes with significant light ion concentrations. Such an increase in conductivity will result in a reduction of the atmospheric electric PG. To give a rough estimation of the corresponding atmospheric electric conductivity change between the two extremes of ΔPG=±30 V/m, eq. (1) is used here denoting the positive PG near the surface as F and setting J
z
~2 pA m−2. Thus, by differentiating eq. (1) it is found:2
Fig. 6 Relation of the ΔPG (V/m) between AMI and PS: (a) the lake wind speed (m/s); (b) lake temperature difference between the surface (2 m height) and the interior (1 m deep). Both lake parameters were measured at Alqueva-Montante floating platform. Linear correlations between parameters are depicted through regression lines. The respective correlation coefficients (r) and the significant levels (p) are also depicted. Both lake parameters were measured at Alqueva-Montante floating platform.
If the value for F is considered to be approximately the mean PG value for AMI and PS, F ~60 V/m, and using ΔF=ΔPG, the conductivity change is found to be fS/m, in what seems to be a very reasonable value. In fact, according to Harrison and Carslaw (Citation2003), typical values for air conductivity are ~13.3 fS/m, which is a value very close to the variation found here.
(2) The air flowing over the land station from the lake will bring negative ions formed by the balloelectric effect through wave splashing, as a result of the wind action. The negative ions will form an SCD that will reduce the atmospheric electric PG. To estimate a quantity for the SCD, the Gauss’ law is used, relating the vertical variation of F with the presence of an SCD, ρ(z), through the relation: 3
Additionally, the SCD variation with height, z, can be described by a Gaussian dispersion model (Gathman and Hoppel, Citation1970):4
where ρ
0 is the SCD at the ground (z=0) and ξ is the dispersion of the distribution (assumed to be independent of the height). This model includes the dispersion of aerosols in a turbulent atmosphere and was estimated for Lake Superior to be ξ≈5.43 m, based on measurements of SCD using a ventilated Faraday cage. It is expected that ξ would be influenced by the location where the measurements are performed, but the ALEX2014 campaign presents similarities to the Gathman and Hoppel (Citation1970) campaign. Both took place in the summer months, in low pollution environments and near to fresh water lakes so it reasonable to consider that both locations have a similar dispersion parameter ξ. Equation (4) can be substituted into eq. (3) in order to determine F at a given height, h, from the ground, F
h
:5
where F
PBL
is the PG at the PBL top and L is its height, so that:6
Here the function ‘erf’ is the so-called error function. A description of this function is given in the Appendix where it is shown that it is possible to approximate . Moreover, using eq. (4) to substitute ρ
0=ρ
h
exp(h
2/2ξ
2), where ρ
h
is the SCD at a height h, and solving eq. (6) in order of F
h
, it can be found:
7
Equation (5) shows that below the PBL, the PG increases in relation to the value at the top of the PBL when a positive SCD is formed (Blanchard, Citation1966; Muir, Citation1977a; Trevitt, Citation1984; Israelsson and Lelwala, 1999; Matthews et al., Citation2010). In the case of a negative SCD, the PG decreases in relation to that of the PBL (Gathman and Hoppel, Citation1970; Reiter, Citation1994; Laakso et al., Citation2007; Kolarz et al., Citation2012). With eq. (7), it is possible to estimate the difference in the SCD between the up-wind and down-wind stations:8
where ΔFh
=Fh
uw
−Fh
dw
, Fh
uw
is the PG at height h in the up-wind station and is the PG at the same height in the down-wind station. If it is set that h=2 m, then ΔF=ΔPG and using
m (Gathman and Hoppel, Citation1970), eq. (8) allows the estimation of Δρ from the two extremes of ΔPG, thus using ΔF~±30 V/m it is found that Δρ~±50 pC m−3. This variation of the Δρ is an order smaller than the maximum measured by Gathman and Hoppel (Citation1970) in Lake Superior, which is expected due to the lower undulation on Alqueva. Lake Superior has an area of 127 700 km2, which is far greater than the Alqueva reservoir with an area of 250 km2; this justifies the differences in undulation between the two lakes.
Independently of the two hypothesis presented here to explain the daily behaviour of the ΔPG observed, it is expected that the lake affects the PG in PS first, since it is the first site to face the down-wind of the lake. Only when the lake breeze is fully set, it will affect AMI more considerably as it is closer to the lakeshore than PS. This explains the positive to negative modulation of ΔPG during the day and constitutes a clear signature of the lake breeze.
6. Conclusions
Atmospheric electric PG measurements were carried out in the region of the Alqueva reservoir (Portugal) during the ALEX2014 campaign, from June to August 2014. Two stations have been used: one up-wind (Amieira) and another down-wind (Parque Solar) of the lake, in reference to the prevailing winds. The comparison between the measurements in both stations indicates that the presence of the lake has a local signature on the atmospheric electric PG. Such an influence is modulated by the development of the observed lake breeze, constituting an influence on the local electrical environment near the lake. Atmospheric electric PG in the up-wind station is shown to be higher than the observed in the down-wind station during the beginning of the lake breeze (9 UTC) and lower when the lake breeze is fully developed (15 UTC). A simple model formulation has been developed and proposed to explain the lake breeze modulation of atmospheric electric PG by means of an SCD formation. The resulting values confirm the lake signature of atmospheric electric PG, depicting the lake as a source of modification of the local electric environment.
7. Acknowledgements
The authors acknowledge Devendraa Siingh and two other anonymous reviewers for their crucial contributions to this manuscript. Experiments were accomplished during the field campaign funded by FCT (Portuguese Science and Technology Foundation) and FEDER-COMPETE: ALEX 2014 (EXPL/GEO-MET/1422/2013) FCOMP-01-0124-FEDER-041840. This work is also co-funded by the European Union through the European Regional Development Fund, framed in COMPETE 2020 (Operational Programme Competitiveness and Internationalisation) through the ICT project (UID/GEO/04683/2013) with reference POCI-01-0145-FEDER-007690. The authors acknowledge the support from the FCT/FEDER-COMPETE projects: RADON (PTDC/CTEGIX/110325/2009); EAC (PTDC/GEO-FIQ/4178/2012) FCOMP-01-0124-FEDER-029197. HGS and MP are grateful for the support by FCT through the post doc grants: SFRH/BPD/63880/2009 and SFRH/BPD/81132/2011, respectively. KAN acknowledges the support of NERC through an Independent Research Fellowship (NE/L011514/1). The collaboration of Samuel Bárias, Sérgio Aranha and Paulo Canhoto is here acknowledged. A special recognition is made to John Chubb for his outstanding contribution to atmospheric electricity, for the discussions related to this manuscript and for his friendship. Many will miss him. A final acknowledgement is given to ‘Amieira Marina’ that supported the measurements made at Amieira (www.amieiramarina.com/en/).
References
- Abramowitz M. , Stegun I. A . Handbook of Mathematical Functions with Formulas, Graphs, and Mathematical Tables. 1965; New York: Dover.
- Adkins C. J . The small ion concentration and space-charge near the ground. Q. J. Roy. Meteorol. Soc. 1959; 89: 107.
- Balsamo G., Salgado R., Dutra E., Boussetta S., Stockdale T., co-authors. On the contribution of lakes in predicting near-surface temperature in a global weather forecasting model. Tellus A. 2012; 64: 15829. http://dx.doi.org/10.3402/tellusa.v64i0.15829.
- Bent R. B. , Hutchinson W. C. A . Electric space-charge measurements and the electrode effect within the height of a 21m mast. J. Atmos. Solar-Terr. Phys. 1966; 28: 53.
- Blanchard D. C . Bursting of bubbles at an air-water interface. Nature. 1954; 173: 1048.
- Blanchard D. C . Electrified droplets from the bursting of bubbles at an air-sea water interface. Nature. 1955; 175: 334–336.
- Blanchard D. C . Electrically charged drops from bubbles in sea water and their meteorological significance. J. Meteorol. 1958; 15: 383–396.
- Blanchard D. C . Positive space charge from the sea. J. Atmos. Sci. 1966; 23: 507–515.
- Chalmers J. A . The ionisation in the lower regions of the atmosphere. Q. J. Roy. Meteorol. Soc. 1946; 72: 199.
- Chubb J . The measurement of atmospheric electric fields using pole mounted electrostatic fieldmeters. J. Electrostat. 2014; 72: 295–300.
- Chubb J . Comparison of atmospheric electric field measurements by a pole mounted fieldmeter and by a horizontal wire antenna. J. Electrostat. 2015; 73: 1–5.
- Elias T. , Silva A. M. , Belo N. , Pereira S. , Formenti P. , co-authors . Aerosol extinction in a remote continental region of the Iberian Peninsula during summer. J. Geophys. Res. 2006; 111(D14204): 1–20.
- Gathman S. G. , Hoppel W. A . Electrification processes over Lake Superior. J. Geophys. Res. 1970; 75(6): 1041–1048.
- Harrison R. G . The Carnegie curve. Surv. Geophys. 2013; 34: 209–232.
- Harrison R. G. , Aplin K. L . Water vapor changes and atmospheric cluster ions. Atmos. Res. 2007; 85: 199–208.
- Harrison R. G. , Carslaw K. S . Ion-aerosol-cloud processes in the lower atmosphere. Rev. Geophys. 2003; 41(3): 1012.
- Hirsikko A. , Bergman T. , Laakso L. , Dal Maso M. , Riipinen I. , co-authors . Identification and classification of the formation of intermediate ions measured in boreal forest. Atmos. Chem. Phys. 2007; 7: 201–210.
- Hoinka K. P. , Castro M. D . The Iberian Peninsula thermal low. Q. J. Roy. Meteorol. Soc. 2003; 129(590): 1491–1511.
- Holben B. N. , Eck T. F. , Slutsker I. , Tanré J. P. , Bziis A., II. , co-authors . AERONET – a federated instrument network and data archive for aerosol characterization. Rem. Sens. Environ. 1998; 66(1): 1–16.
- Israelsson S. , Lelwala R . Space charge density measurements downwind from a traffic route. Atmospheric Research. 1999; 51: 301–307.
- Kolarz P. , Gaisberger M. , Madl P. , Hofmann W. , Ritter M. , co-authors . Characterization of ions at Alpine waterfalls. Atmos. Chem. Phys. 2012; 12: 3687–3697.
- Laakso L. , Hirsikko A. , Grönholm T. , Kulmala M. , Luts A. , co-authors . Waterfalls as sources of small charged aerosol particles. Atmos. Chem. Phys. 2007; 7: 2271–2275.
- Law J . The ionisation of the atmosphere near the ground in fair weather. Q. J. Roy. Meteorol. Soc. 1963; 89: 107.
- Lenard P . Über die Elektrizität der Wasserfälle. Ann. Phys. 1892; 46: 584–636.
- Lomb N. R . Least-squares frequency analysis of unequally spaced data. Astrophys. Space Sci. 1976; 39: 447–62.
- Lopes F. , Silva H. G. , Bárias S. , Barbosa S. M . Preliminary results on soil-emitted gamma radiation and its relation with the local atmospheric electric field at Amieira (Portugal). J. Phys. 2015; 646: 012015.
- Lumley J. L. , Panofsky H. A . The Structure of Atmospheric Turbulence. 1964; New York: Wiley.
- Matthews J. C. , Ward J. P. , Keitch P. A. , Henshaw D. L . Corona ion induced atmospheric potential gradient perturbations near high voltage power lines. Atmos. Environ. 2010; 44: 5093–5100.
- Muir M. S . Atmospheric electric space charge generated by the surf. J. Atmos. Terr. Phys. 1977a; 39: 1341–1346.
- Reiter R . Charges on particles of different size from bubbles of Mediterranean Sea surf and from waterfalls. J. Geophys. Res. 1994; 99(D5): 10807–10812.
- Retalis D. , Pitta A. , Psallidas P . The conductivity of the air and other electrical parameters in relation to meteorological elements and air pollution in Athens. Meteorol. Atmos. Phys. 1991; 46(3–4): 197–204.
- Ruf T . The Lomb-Scargle periodogram in biological rhythm research: analysis of incomplete and unequally spaced time-series. Biol. Rhythm Res. 1999; 30: 178–201.
- Salgado R. , Le Moigne P . Coupling of the FLake model to the Surfex externalized surface model. Boreal Env. Res. 2010; 15: 231–244.
- Salgado R., Miranda P. M. A., Lacarrère P., Noilhan J. Boundary layer development and summer circulation in Southern Portugal. Tethys. 2015; 12: 33–44. http://dx.doi.org/10.3369/tethys.2015.12.03.
- Scargle J. D . Studies in astronomical time series analysis: II – statistical aspects of spectral analysis of unevenly spaced data. Astrophys. J. 1982; 263: 835.
- Silva H. G. , Conceição R. , Melgão M. , Nicoll K. , Mendes P. B. , co-authors . Atmospheric electric field measurements in urban environment and the pollutant aerosol weekly dependence. Environ. Res. Lett. 2014; 9: 114025.
- Silva H. G. , Conceição R. , Wright M. D. , Matthews J. C. , Pereira S. N. , co-authors . Aerosol hygroscopic growth and the dependence of atmospheric electric field measurements with relative humidity. J. Aerosol. Sci. 2015; 85: 42–51.
- Smiddy M. , Chalmers J. A . Measurements of space charge in the lower atmosphere using double field mills. Q. J. Roy. Meteorol. Soc. 1960; 86: 79.
- Stull R. B . An Introduction to Boundary Layer Meteorology. 1989; , The Netherlands: Kluwer Academic Publishers.
- Tammet H. , H[otilde]rrak U. , Kulmala M . Negatively charged nanoparticles produced by splashing of water, Atmospheric. Chem. Phys. 2009; 9: 357–367.
- Trevitt A. C . Atmospheric modulation during a sea breeze. J. Geophys. Res. 1984; 89(D6): 9663–9667.
- Voeikov A. I . Instruction on Preparation of the Material and Publication of the Results of Atmospheric Electric Observations. 1965; Leningrad: Main Geophysical Observatory.
- Xu B. , Zou D. , Chen B. Y. , Zhang J. Y. , Xu G. W . Periodic variations of atmospheric electric field on fair weather conditions at YBJ, Tibet. J. Atmos. Solar Terr. Phys. 2013; 97: 85.
8. Appendix
The error function is also designated by Gauss error function, and it is a behavioural non-elementary function that is defined by:A1
More details about this function can be found in Abramowitz and Stegun (Citation1965). The error function is often used in physical sciences as a result of the integration of Gaussian distributions, for example, Abramowitz and Stegun (Citation1965). It asymptotically tends to 1 when x→+∞ and to −1 when x→−∞, for x=0, it is erf(x=0)=0. For values above x
2, the error function reaches its asymptotic positive value. Thus assuming the typical values for the PBL height, L ~1000 m, and the ξ≈5.43 m estimated by Gathman and Hoppel (Citation1970) the argument in eq. (4) is , thus the error function in this equation can be approximated to 1. Even in the extreme case that ξ100 m the argument will be x
7 and again the error function could be approximated to 1.