Abstract
The European carbon monoxide (CO) budget is studied in relation to the synoptic circulation throughout 2001, using the nested-grid configuration of the GEOS-CHEM global model and CO measurements from 31 rural background stations. To meet the aims of this study, a seasonal circulation type (CT) classification is developed for the Northern Hemisphere based on mean sea-level pressure (SLP) fields, as well as two upper atmospheric levels, over a 60-yr period. The highest contribution to the European surface CO concentrations is attributed to regional anthropogenic sources (up to ~80%), which become more important under the prevalence of anticyclonic circulation conditions. The corresponding contribution of the long-range transport (LRT) from North America (up to 18%) and Asia (up to 20%) is found highest (lowest) in winter and spring (summer and autumn). The transport of the CO towards Europe in winter is more intense under cyclonic circulation, while both cyclonic and anticyclonic patterns favour LRT during other seasons. Occasionally (mainly in winter and spring), LRT contribution is higher than the regional one (up to 45%). In the free troposphere, the LRT contribution increases, with the largest impact originating from Asia. This flow is favoured by the intense easterly circulation in summer, contributing up to 30% in the Eastern Mediterranean during this season. On the other hand, the regional contribution in the upper levels decreases to 22%. The contribution of CO chemical production is significant for the European CO budget at all levels and seasons, exceeding 50% in the free troposphere during summer.
To access the supplementary material to this article, please see Supplementary files under Article Tools online.
1. Introduction
The estimation of carbon monoxide (CO) concentrations is a complex problem, depending strongly on fossil fuel, biofuel and biomass burning emissions, the oxidation of methane (CH4) and non-methane volatile compounds (NMVOCs) and the hydroxyl radical (OH) (Allen et al., Citation1996; Kanakidou et al., Citation1999; Holloway et al., Citation2000; Duncan and Logan, Citation2008). The atmospheric circulation also has a dominant role on the pollutant levels since several CO pollution events and large-scale horizontal gradients have been associated with the prevailing atmospheric conditions (Chung et al., Citation1999; Wang et al., Citation2004a; Liu et al., Citation2006; Drori et al., Citation2012).
Due to the CO lifetime in the troposphere (30–90 d), the pollutant can be transported in continental scales through several pathways (Holloway et al., Citation2000; Li et al., Citation2002; Liu et al., Citation2003; Duncan and Bey, Citation2004; Huntrieser and Schlager, Citation2004; Liang et al., Citation2004; Weiss-Penzias et al., Citation2004; Auvray and Bey, Citation2005; Drori et al., Citation2012). The transatlantic long-range transport (LRT) is particularly favoured due to the relatively short distance between North America and Europe. The transport of air from North America towards Europe takes place in the troposphere throughout the year, following the general circulation over the North Atlantic (Wild and Akimoto, Citation2001; Stohl et al., Citation2003a, Citation2003b). In the lower troposphere (LT), these transport paths are determined by the strength and the position of the Azores High, in combination with the Icelandic Low (Li et al., Citation2002; Auvray and Bey, Citation2005; Christoudias et al., Citation2012). In the free troposphere, the transatlantic LRT takes place when air masses from the North American surface are lifted to the upper levels through mid-latitude cyclones and convection; then, the pollutants are transported towards Europe, governed primarily by the westerly circulation and the jet streams (Stohl, Citation2001; Cooper et al., Citation2002; Li et al., Citation2002, Citation2005; Trickl et al., Citation2003; Huntrieser and Schlager, Citation2004). Similarly, the LRT from Asia towards Europe occurs throughout the year when mid-latitude cyclones and deep convection lift the pollutants into the free troposphere (Liu et al., Citation2003; Auvray and Bey, Citation2005). Another export pathway from Asia that directly affects Europe is observed from the end of May until the end of August and is related with an upper easterly current extending to the west across South Arabia and North Africa (Barry and Chorley, Citation2003; Auvray and Bey, Citation2005). As a result, the Asian pollution has frequently been detected not only in the upper troposphere (UT) but also in the LT over the Eastern Mediterranean (Lelieveld et al., Citation2002; Lawrence et al., Citation2003; Roelofs et al., Citation2003; Scheeren et al., Citation2003; Traub et al., Citation2003; Drori et al., Citation2012). On the other hand, the transport from the rest of the world towards Europe is not favoured due to the presence of the Inter-tropical Convergence Zone (ITCZ). Some pollution of African origin has been detected mostly in the Mediterranean region, while transport from Australia and South America to Europe has rarely been reported (Stohl et al., Citation2002; Roelofs et al., Citation2003; Kallos et al., Citation2006, Citation2007).
The combustion of the fossil fuels and the biofuels in Asia, North America and Europe dominates the surface CO distribution in the Northern Hemisphere (NH) (, ). The majority of the anthropogenic sources are located in a mid-latitude belt between 30°N and 65°N, where the population density and the anthropogenic activity are high (Schultz and Bey, Citation2004). Africa and South America represent the world regions with the highest biomass burning emissions globally. However, it should be noted that the biomass burning activity is high also in the Mediterranean and Eastern Europe during the summer. Moreover, the CO chemical production by the oxidation of CH4 and NMVOCs is also significant for the pollutant's concentration levels within the troposphere.
Table 1. Longitude and latitude of source regions shown in and corresponding CO fossil fuel-biofuel/biomass burning emissions (Tg(CO)/yr) on seasonal basis in GEOS-CHEM as considered in this study
The global chemical transport models (CTMs) have proved to be suitable tools to reproduce the observed CO in long scales (Kanakidou and Crutzen, Citation1999; Holloway et al., Citation2000; Tanimoto et al., Citation2009). Regarding the European domain, simulations of the global CTMs MOZART-2 (Pfister et al., Citation2004) and MATCH-MPIC (Fischer et al., Citation2006) revealed that the predominant contribution to the surface CO levels over Europe is attributed to the regional emissions. On the contrary, it was found that most of the CO in the European middle troposphere (MT) and UT is transported from Asia and North America. These results are consistent with those of other studies that emphasised on the Eastern Mediterranean (Lelieveld et al., Citation2002; Lawrence et al., Citation2003; Drori et al., Citation2012).
In order to track the CO origin, its molecules can be tagged according to the type and the location of its primary emission sources and the chemical production. This tagging technique has been implemented in the global CTM GEOS-CHEM (Bey et al., Citation2001a, Citation2001b) and its nested-grid application as well (Wang et al., Citation2004a, Citation2004b). Previous studies have employed the nested-grid configuration of this model in several world regions such as Asia (Wang et al., Citation2004a, Citationb, Citation2009b; Chen et al., Citation2009), North America (Fiore et al., Citation2005; Li et al., Citation2005; Park et al., Citation2006; Wang et al., Citation2009a; Zhang et al., Citation2011) and Europe (Protonotariou et al., Citation2010). The nesting results indicated that the representation of the pollutants improves in comparison to the global model, particularly for certain regions (e.g. high emission intensity, complex terrain) and time periods (e.g. pollution events).
Global simulations of the GEOS-CHEM model have previously been employed to study transport of O3 and CO towards Europe (Li et al., Citation2002; Auvray and Bey, Citation2005; Guerova et al., Citation2006), but the European CO concentrations have not systematically been studied in relation to the synoptic circulation. In the present study, an analysis of the CO budget within the European troposphere in relation to the atmospheric circulation is carried out for the 1-yr period of 2001, based on the nested-grid application of the GEOS-CHEM. To this aim, a recently developed circulation-pattern classification scheme over the NH is presented and the contribution of direct surface emissions from all continents and the chemical production are estimated in the LT, the MT and the UT during winter and summer of 2001 based on tagged CO simulations. Furthermore, based on Principal Component Analysis (PCA), the LRT contribution towards Europe is examined in relation to the atmospheric circulation at three station sites, where the surface CO measurements are available for the examined period (Air Quality Database of the European Environmental Agency; http://www.eea.europa.eu/data-and-maps/data/airbase-the-european-air-quality-database-1).
2. Methodology
2.1. The GEOS-CHEM model description
GEOS-CHEM is a three-dimensional global atmospheric CTM (Bey et al., Citation2001b) developed by the Atmospheric Chemistry Modelling Group of Harvard University (http://acmg.seas.harvard.edu/). In this study, the nested-grid configuration of the model's version 07-01-02 is applied over Europe (Protonotariou et al., Citation2010). Assimilated meteorological data from the Goddard Earth Observing System (GEOS) of the NASA Global Modelling and Assimilation Office (http://gmao.gsfc.nasa.gov) are employed in the model, based on a terrain-following sigma coordinate system with 30 vertical levels up to 0.01 hPa. Moreover, natural and anthropogenic emissions with no seasonal variation are included (Bey et al., Citation2001b), introducing about 14% higher (lower) concentrations than the annual mean in winter (summer) (Duncan and Bey, Citation2004).
In this work, the tagging technique is applied in the model, considering 16 CO tracers (). In order to apply the nested-grid configuration, first a 2-yr (2000, 2001) global simulation (4°×5° grid-resolution) is performed. As 1-yr spin up is suggested, hourly boundary conditions (BCs) are saved around the nesting domain of Europe (20°W–45°E, 22°N–74°N) during the second run-year. The BCs are then implemented around the European domain for the nested-grid simulation (1°×1° grid-resolution).
Table 2. CO tagged tracers considered in GEOS-CHEM according to emission sources, geographical regions and chemical production
2.2. Classification of circulation types
In the present study, an automated map pattern classification is developed following the methodology by Kostopoulou and Jones (Citation2007). The obtained circulation catalogue describes the main seasonal circulation types (CTs) over the NH at sea level pressure (SLP) and at selected levels (500 hPa, 200 hPa). Distinct synoptic patterns are produced over an extended European area, and the atmospheric circulation is studied on a daily basis at the three atmospheric levels. The ‘environment-to-circulation’ approach (Yarnal, Citation1993) is used to study the influence of atmospheric circulation on the CO concentrations over Europe for 1 yr. The classification scheme serves as a tool to provide the prevailing atmospheric circulation for each day of the study year in order to assess the CO levels and the LRT contribution over Europe. Towards this purpose, each representative day of year 2001 is assigned to one of the derived synoptic circulation patterns, and the simulated daily CO concentrations are grouped based on the prevailing CTs. Similarly, the regional and the LRT contributions to the European CO budget are calculated for each day of the year and the results are interpreted based on the prevailing CTs.
Table 3. The main characteristics of the seasonal circulation patterns at SLP
More specifically, gridded geopotential height reanalysis daily data at the three levels from the National Centers for Environmental Prediction/National Center for Atmospheric Research (NCEP/NCAR; Kalnay et al., Citation1996; Kistler et al., Citation2001) are used as inputs to the synoptic map pattern classifications. The spatial coverage is 2.5° in latitude by 2.5° in longitude, providing a global grid of 144×73 points (90°N–90°S, 0°E–357.5°E). As this study emphasises on the prevailing NH circulation patterns with a special interest over the European territory, 60-yr daily data from 1947 to 2007 are utilised for a region covering most of the NH (0°N–70°N, 90°W–90°E).
The first step towards the circulation classification is accomplished employing an eigenvector-based approach. A rotated PCA (Wilks, Citation1995) is carried out (S-mode, using the correlation matrix), which reduces the number of the original data to a smaller number of principal components (PCs). Each PC includes a positive and a negative phase both representing atmospheric classification modes. Correspondingly, half of the circulation patterns are associated with a prominent anticyclonic centre (denoted by ‘+’) and the remaining half with a cyclonic centre (denoted by ‘−’), which govern the atmospheric conditions over the study region. Finally, each day of the original data is assigned to one mode according to the absolute maximum component scores. The methodology adopted to determine the map-pattern classification is described in greater depth in Kostopoulou and Jones (Citation2007).
Table 4. Contribution (%) of the CO sources to the European CO concentrations at surface, 500 hPa and 200 hPa in winter and summer of 2001
2.3. Observations for the model evaluation
In this study, measurements of CO concentrations during 2001 from 31 rural background stations, located in Austria, France, Germany, Italy, Poland, Switzerland and the Netherlands (a), are employed. Moreover, a PCA is applied with daily mean averages of the CO-modelled concentrations from the 31 stations for the study year, in order to classify the stations into groups with common characteristics. As a result, the original data dimension is reduced into a smaller number of PCs (Protonotariou et al., Citation2010). The PCA yielded three PCs (PC1, PC2, PC3), accounting for 80% of the total variance as suggested by the literature (Jolliffe, Citation1993). It is found that each PC component defines a sub-region (b and Appendix S1) with common characteristics in relation to emission intensity, topographical features and geographical position. More specifically, the first sub-region (PC1, capturing 33.7% of the total variance in the original dataset) includes the stations located in the north-western part of the examined area. This station area, characterised by flat terrain and low altitudes, is close to strong anthropogenic sources. As a result, the mean emission rate is significantly high (up to ~50% higher than the other two sub-regions). In the second sub-region (PC2, which explains 24.8% of the total variance), the stations are located in the southern part of the study region. This station area, located at a long distance from the major anthropogenic sources, is characterised by complex topography and a mean altitude of ~400 m. The third sub-region (PC3, accounting for 22.6% of the total variance) includes stations located in the eastern part of the examined area, with lower background emissions in comparison to the other two groups and at similar mean altitude with PC2. For each PC region, the LRT contribution is calculated on an annual and a seasonal basis and the circulation patterns that favour the transport paths are investigated.
Fig. 1 Global CO anthropogenic surface emissions (in molec/cm2/s). Black boxes depict the geographical regions considered in GEOS-CHEM tagged CO analysis; 1: Europe, 2: North America, 3: Asia, 4: Africa, 5: South America, 6: Oceania.
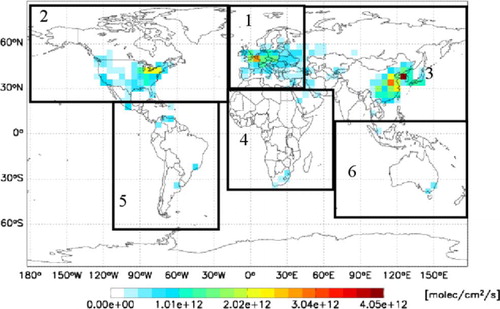
Fig. 2 a) European domain (http://www.ngdc.noaa.gov/mgg/topo/globegal.html#continents) where the 31 rural background stations are located. b) PC1, PC2 and PC3 station regions in Europe.
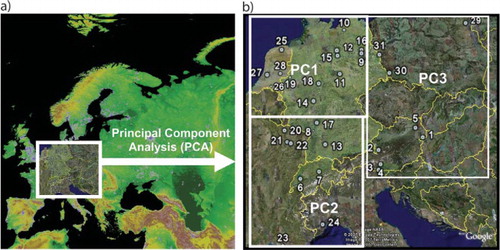
Table 5. Annual contribution (%) of COFFEU, COFFNA, COFFAS, COFFRW and LRT (sum of COFFNA, COFFAS and COFFRW) to CO budget at the three station regions (PCs) in 2001
3. Results and discussion
3.1. Circulation patterns’ analysis
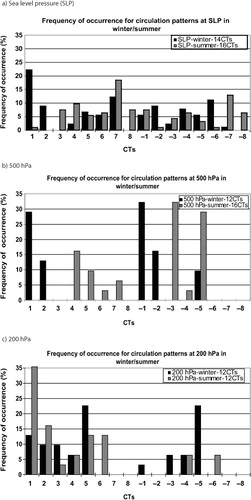
In order to minimise the potential influences of seasonality and to provide a detailed analysis of the atmospheric circulation schemes in each season, the PCA of the circulation patterns is undertaken on a seasonal basis (). Fourteen CTs represent the atmospheric circulation at SLP over the NH in winter (December, January, February), declared by the acronym W_CTi (Winter Circulation Type, where i=±1,7 denotes the corresponding PC number). Sixteen CTs (i=±1,8) are associated with the main modes of atmospheric circulation in each of the next three seasons, that is, in spring (March, April, May, SP_CTi), summer (June, July, August, SU_CTi) and autumn (September, October, November, A_CTi). Correspondingly, 12 CTs are obtained that represent the atmospheric circulation at 500 hPa in winter (W500_CTi, i=±1,6) and autumn (A500_CTi, i=±1,6) and 16 in spring (SP500_CTi, i=±1,8) and summer (SU500_CTi, i=±1,8). Regarding the 200 hPa field, 12 CTs are recognised as the dominant circulation patterns for winter and summer (W200_CTi and SU200_CTi; i=±1,6), and 10 CTs for spring and autumn (SP200_CTi and A200_CTi; i=±1,5). A schematic representation of the main CTs at the three levels is given in Appendix S2. The reliability of the classification is assessed by comparing the derived CT classes with daily synoptic charts of atmospheric circulation (at SLP and the two upper levels), using statistical analysis and visual comparison with NCAR/NCEP daily mean composites (http://www.esrl.noaa.gov/psd/data/composites/day/).
Table 6. Percentage contribution (%) of COFFNA, COFFAS and their sum (COFFLRT) in winter at each PC sub-region in relation to the frequency of occurrence (FO) of the circulation patterns in percentage (%)
3.2. The CO budget at surface
The CO surface concentrations over Europe are mainly driven by the regional anthropogenic emissions, which contribute up to 79 and 68% to the European CO levels at mid-latitudes in North Europe during winter and summer, respectively ( and Appendix S3, Fig. S3-1a, b, Appendix S4, Fig. S4-1). Furthermore, the CO accumulation close to the surface is related to the prevalence of frequent anticyclonic circulation patterns over Europe during both seasons (e.g. W_CT1+, SU_CT7+, a). On the contrary, the COFFEU contribution at the southern latitudes in winter does not exceed 35% (Fig. S4-1a), as the regional emissions in South Europe are lower than those in Northern Europe. Moreover, the prevailing anticyclonic circulation patterns during the cold period (e.g. W_CT1+, W_CT2+, W_CT7+) do not favour transport from the highly polluted North European regions towards the south. However, the European contribution to Southern Europe increases during summer locally, mainly over sea, exceeding 40% (Fig. S4-1b). These high CO levels are related with the transport of the pollutant from North to South Europe under the prevalence of common summer CTs (e.g. SU_CT7±). The CO concentrations are lower over the land owing to the deep mixing height during this season.
Fig. 3 Frequency of occurrence of CTs in winter and summer of 2001 at a) SLP, b) 500 hPa, c) 200 hPa.
The CO production from the regional biomass burning is evident only during the warm period (not shown), contributing up to 34 and 20% to the pollutant's local concentrations in Eastern and Southern Europe, respectively. Particularly in Greece, the prevailing northerly/northeasterly Etesian winds during summer favour the CO transport from the Northern and Eastern Europe under the prevalence of representative summer flow patterns (e.g. SU_CT7+). Through this transport path enhanced CO concentrations from the burning of agricultural residences in Eastern Europe were transported towards Greece in August 2001 (Lelieveld et al., Citation2002; Balis et al., Citation2003; Salisbury et al., Citation2003; Tombrou et al., Citation2009).
The impact of the North American anthropogenic emissions to the European surface CO concentrations is more profound in winter (Fig. S4-2a). The COFFNA contribution is higher at the western part of the European continent between 35°N and 45°N (up to 18%), where air masses are channelled under the prevalence of most anticyclonic and cyclonic patterns during this season (W_CT1−, W_CT2−, W_CT3+, W_CT4+, W_CT5±, W_CT6±, W_CT7±). Some of these patterns (W_CT4+, W_CT5−, W_CT6±) also favour COFFNA to be transported towards the Mediterranean region. In summer (Fig. S4-2b), the COFFNA contribution is weaker (up to ~12%), attributed to the lower anthropogenic emissions in North America during this season. Moreover, the less organised atmospheric circulation in summer does not favour this transport path. In particular, the LRT takes place mainly towards the northern/northwestern parts of Europe, as the westerly winds over the North Atlantic turn to southwesterly for most of the summer CTs (e.g. SU_CT7+). On the other hand, the largest contribution of the Asian anthropogenic tracer is apparent on the eastern borders of the European domain in winter (34%, Fig. S4-3a) as the prevailing circulation patterns (e.g. W_CT1+) do not favour the intrusion further into the European continent. The COFFAS contribution is also pronounced at the western/south-western parts of Europe in winter (up to ~20%) and in the Eastern Mediterranean in summer (up to ~15%), attributed to the westerly circulation and the extension of the Asian thermal Low over the Aegean Sea, respectively. The North American and the Asian biomass burning contributions are found up to 5% (not shown), due to low fire activity in 2001 (EC, Citation2002; Kasischke et al., Citation2005; Yurganov et al., Citation2005; Huang et al., Citation2009). The contribution of the anthropogenic sources from the rest of the world to the European CO surface concentrations is negligible (not shown), mainly because the northeastly Trade winds and the ITCZ prevent the air intrusion from the Southern Hemisphere (SH) into the NH. Similarly, although the fire intensity in the SH contributes significantly to the global CO budget (), such signals are not transmitted towards Europe. Very small contributions of the North African anthropogenic and biomass burning emissions (up to 5%) are observed in winter (not shown), when the atmospheric conditions favour this transport path (e.g. W_CT6+).
The methane oxidation is the largest chemical production process of CO. The highest contribution is found at the southern regions where the solar radiation is intense, reaching 22 and 32% in winter and summer, respectively (not shown). Moreover, COCH4 is enhanced at the high northern latitudes in summer, attributed to the increased CH4 production in the permanent ice-covered regions during this season. Among the NMVOCs, the isoprene oxidation contributes the highest CO concentrations (up to 18% at the densely vegetated eastern parts of Europe in summer), as it consists more than 40% of their total emissions (Miyoshi et al., Citation1994; Paulot et al., Citation2009). Similarly, the CO production by other NMVOCs (monoterpenes, methanol, acetone) is highest in summer (up to 11, 6 and 2%, respectively), attributed to the high temperatures and the increased solar radiation that enhance the photochemical activity during this season.
Table 7. Percentage contribution (%) of COFFNA, COFFAS and their sum (COFFLRT) in spring at each PC sub-region in relation to the frequency of occurrence (FO) of the circulation patterns in percentage (%)
The contribution of the CO anthropogenic emissions (CO chemical production) calculated by the GEOS-CHEM model is up to ~30% (~15%) higher (lower) than those estimated by MOZART-2 (Pfister et al., Citation2004). These discrepancies are mainly attributed to the different emission inventories included in GEOS-CHEM (Wang et al., Citation1998; Duncan et al., Citation2003) and MOZART (Horowitz et al., Citation2003; Pétron Citation2003), as well as to the different horizontal grid resolution (1°×1° versus 2.8°×2.8°) and vertical layers (30 sigma levels up to 0.01 hPa versus 28 sigma levels up to 2 hPa) considered in the two global models.
Table 8. Percentage contribution (%) of COFFNA, COFFAS and their sum (COFFLRT) in summer at each PC sub-region in relation to the frequency of occurrence (FO) of the circulation patterns in percentage (%)
3.3. The CO budget at rural background stations in Europe
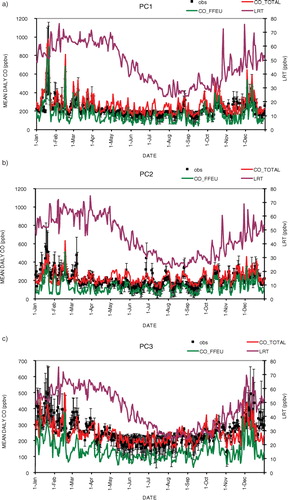
In order to further investigate the LRT contribution to the European CO concentrations at SLP, a more detailed examination is performed based on the PC analysis. To this aim, the annual LRT contribution from each continent's anthropogenic emissions (COFFNA, COFFAS and COFFRW) as well as their total sum is presented for the three PC station regions, together with the regional (COFFEU) contribution (, ). On an annual basis, the LRT contributions to the three PC regions are found comparable. A slightly higher contribution is evident in PC2 and PC3, partly attributed to the fact that these sub-regions, which are characterised by relatively lower regional emissions, locate at high altitudes, where the LRT contribution increases. Moreover, a statistical analysis is also presented for the three PC regions. It is found that the model adequately simulates the observations at all regions. The best performance is achieved in PC1 (Mean Observation, MO=217.8 ppbv; Mean Bias, MB=−4.1 ppbv; Mean Error, ME=32.9 ppbv; correlation coefficient, R2=0.83), attributed to the fact that this region is characterised by flat terrain, which is well depicted by the model. The largest bias and error are found in PC2 (MO=208.4 ppbv, MB=−28.0 ppbv, ME=49.1 ppbv, R2=0.57 ppbv), as the representation of the complex topography in the model's coarse grid is probably not sufficient.
Fig. 4 Time series of the mean daily concentrations of CO measurements (black squares) and modelled concentrations of COtotal (red line) and COFFEU (green line) in the left axis and LRT (sum of COFFNA, COFFAS and COFFRW, purple line) concentrations in the right axis in 2001 at a) PC1, b) PC2, c) PC3.
In order to define the atmospheric conditions that favour the LRT towards the study regions, the analysis is extended on a seasonal basis. To this aim, the contribution of the anthropogenic emissions of the major continental sources (North America and Asia) to the total CO concentration, as well as their sum (COFFLRT), is calculated in percentage ([COx/COtotal] *100, where x=COFFNA or COFFAS) at each PC region. This analysis is performed in relation to the prevailing circulation patterns on a seasonal basis, together with their frequency of occurrence during the study year (Table –9 ). Moreover, in order to assess how well the source contributions are linked to the CTs, the standard deviation of the North American and Asian contributions has been calculated for all CTs (not shown). It should be noted that the circulation patterns depict the general characteristics of the atmospheric circulation and they do not represent the real wind direction and velocity (or pressure values), which in turn determine the source contribution to the study area. Therefore, it is expected that there will be some variability in the results. In most cases nevertheless, it was found that the LRT contribution is satisfactorily linked with most of the circulation patterns, with the standard deviation in the source contributions estimated between 4 and 11.8% of the contribution itself.
Table 9. Percentage contribution (%) of COFFNA, COFFAS and their sum (COFFLRT) in autumn at each PC sub-region in relation to the frequency of occurrence (FO) of the circulation patterns in percentage (%)
3.3.1. Winter.
The LRT contribution on the surface CO concentrations at the three PC regions during winter reaches ~30%, with the Asian contribution (18.1%) being higher than the North American contribution (12.8%) under all CTs (). The highest COFFLRT contribution is found in PC3 (29.6%) under the prevalence of the cyclonic pattern W_CT5−. This CT with relatively low frequency of occurrence in 2001 (FO: 5.6%, ) is associated with the extension of the Azores High over the Western Mediterranean and the formation of a deep low eastwards to PC3. Under these conditions, the southwesterly winds over the North Atlantic turn southeastwards before arriving to the study area. Similarly, the LRT contribution in PC1 is highest (28.6%) under the prevalence of the same cyclonic pattern, exceeding up to ~10% the regional contribution on some days (a). As shows, the LRT towards PC1 and PC3 is most intensive mainly when cyclonic circulation prevails over Europe during winter. However, it should be mentioned that enhanced LRT contribution (28.1%) can also occur under the prevalence of the less frequent anticyclonic type W_CT4+ (FO: 2.2%), formed when the well-organised Azores High extends northeastwards, reaching the study regions.
The highest LRT contribution in PC2 (27.7%) is observed under the prevalence of the cyclonic circulation type W_CT2−. This relatively frequent pattern (FO: 8.9%) is associated with westerly winds over the North Atlantic that channel the air masses towards the study area. This flow is established when the well-organised deep Icelandic Low and the Azores High are formed northwestwards and southwestwards of PC2, respectively. Under the prevalence of this circulation pattern, the LRT contribution in PC2 can exceed by up to 21.8% the regional one (b). Moreover, the LRT contribution exceeds the regional one by up to 45.9% under the cyclonic pattern W_CT4−, when a deep low develops westwards of PC2. Under these conditions, winds over the North Atlantic shift from northwesterly to southwesterly before arriving to the study area.
3.3.2. Spring.
The COFFLRT contribution in spring (31.1%) is at the same level as in winter. Similarly to winter, the Asian contribution (19.2%) is higher in comparison to the North American (13.5%) for all CTs (). In particular, the highest LRT contribution is accumulated in PC2 under the prevalence of the anticyclonic pattern SP_CT6+. This less frequent CT in 2001 (FO: 2.2%) is associated with the formation of the deep Azores High southwestwards of PC2. Under these conditions, the prevailing southwesterly winds over the North Atlantic turn to northwesterlies before arriving at the PC2 region. In this case, the COFFLRT contribution can exceed the COFFEU contribution by up to 36% (b). Moreover, the LRT contribution can be up to ~45% higher than the regional one under the prevalence of the more frequent cyclonic patterns SP_CT1−, SP_CT3− and SP_CT4− (FO: 6.5, 15.2 and 6.5%, respectively). Under these conditions, the deep Icelandic Low and the Azores High are formed north/northwestwards and southwestwards of PC2 respectively, inducing westerly winds towards the study area.
The largest LRT accumulation in PC1 (27.8%) and PC3 (25.4%) takes place under the prevalence of the cyclonic patterns SP_CT2− (FO: 7.6%) and SP_CT7− (FO: 1.1%). These CTs are related with the formation of a low pressure centre over the Mediterranean, which combined with the high pressures westwards of PC1 and PC3, induces northerly and southwesterly winds, respectively, towards these areas. Moreover, it is noticed that the COFFLRT contribution in PC3 exceeds by up to 14.6% the COFFEU levels (c) under the prevalence of SP_CT4+ (FO: 15.2%) and SP_CT6− (FO: 12%).
3.3.3. Summer.
The LRT contribution in summer (up to 22.1%) is lower than in winter and spring. In this case, the Asian contribution (12.9%) is higher in comparison to the North American contribution (10.4%) for most CTs (). The largest contribution is observed in PC1 under the prevalence of the anticyclonic pattern SU_CT3+. This relatively frequent type (FO: 7.6%) is associated with the extension of the deep Azores High over Western Europe, steering the southwesterly winds over the North Atlantic southeastwards before arriving to the area. Under these atmospheric conditions, the LRT contribution in PC1 and PC2 can exceed the regional one (up to 8 and 16.8%, respectively, a, b). Similarly, the highest contribution in PC3 (19.2%) is observed under the same anticyclonic pattern. Enhanced LRT contributions in PC3 (18.3%) and PC1 (21%) are also observed under the cyclonic patterns SU_CT1− and SU_CT8− respectively. Moreover, the highest LRT contribution in PC2 (20.6%) is found under the latter CT. Under these conditions, the formation of a low pressure centre to the north and a high pressure system in the North Atlantic induces northwesterly winds towards the study area. A contribution of ~20% is also observed in PC2 under the anticyclonic patterns SU_CT3+ and SU_CT4+.
3.3.4. Autumn.
The LRT contribution in autumn is evidently lower than in winter and spring (and slightly lower than in summer). Moreover, contrary to the other seasons, the North American contribution is higher in comparison to the Asian for most CTs (). The highest LRT (19.9%) and COFFNA contributions (10.9%) are found in PC1 under A_CT1− (FO: 8.8%). This cyclonic pattern is associated with the formation of a deep cyclonic centre over Scandinavia, extending northwards over the study area. The combination of this system with the high pressure southwards establishes westerly winds towards PC1. Enhanced LRT contribution (19.6%) is also observed in PC1 under the highly frequent anticyclonic pattern A_CT3+ (FO: 19.8%). Similarly, the highest LRT contribution in PC3 (18.6%) occurs under the same anticyclonic and cyclonic patterns.
The highest LRT contribution in PC2 (18.8%) is found under the A_CT5+ (FO: 7.7%). This anticyclonic circulation pattern is associated with an extended well-organised high pressure system over Europe. In addition, the LRT contribution in PC2 becomes important (up to 17.8%) under the more frequent A_CT7+ and A_CT8− patterns (FO: 11%). Only few LRT exceedances are observed in autumn 2001, with COFFLRT being higher by up to 5.4% than COFFEU (b) mainly under the prevalence of A_CT1− and A_CT8−.
3.4. The CO budget in the free troposphere (MT and UT)
The CO concentrations at the upper levels over Europe are significantly lower than those over the surface, decreasing by up to ~70% over highly polluted regions (Fig. S3-1c to f). The CO levels in the MT during winter (Fig. S1-1c) increase from south (up to ~110 ppbv) to north (up to ~130 ppbv). This latitudinal distribution is attributed to the longer CO photochemical lifetime (due to the lower solar radiation) and to a more intense LRT under the prevalence of frequent winter CTs (e.g. W500_CT1±, b). The computed summer levels are in general lower than ~100 ppbv (Fig. S3-1d). However, higher concentrations are calculated in Eastern Europe due to strong convection. This well-known upward flow over this region (Duncan and Bey, Citation2004) is also evident from the most frequent summer CTs at SLP (a). The CO concentrations at 200 hPa are in general lower than 100 ppbv, except over Eastern Europe where they can be supported by the convective mixing (Fig. S3-1e, f).
The chemical production is the major source of CO in the free troposphere (not shown), exceeding 50% in the UT during summer (). Moreover, the LRT in the MT/UT is more profound than in the LT. The largest contribution originates from Asia, reaching 25% in Western Europe and at higher latitudes in winter (Fig. S6-3a, c). This distribution reflects the transport paths followed by the pollutant under the influence of the prevailing winter CTs in the MT (e.g. W500_CT1±, b) and UT (W200_CT5±, c). In summer, COFFAS in the MT/UT (Fig. S6-3b, d) is in general lower than in winter. However, higher contributions are observed in the UT over the Eastern Mediterranean (~30%), when a ridge extends over the greater area (e.g. SU200_CT1+). These conditions develop easterly winds that transfer COFFAS towards the Eastern Mediterranean and North Africa. The North American contribution is higher at high latitudes in the MT during winter (up to 18%, Fig. S6-2a). Moreover, the COFFNA contribution in the UT reaches 14% over the Iberian Peninsula and the Western Mediterranean during summer (Fig. S6-2d). This distribution is favoured by the westerly/southwesterly circulation that is established under the influence of the prevailing CTs at these heights (e.g. SU500_CT3−, SU500_CT5−, SU200_CT1+, SU200_CT2+). The anthropogenic and biomass burning emissions signals from Africa are detected only at the southern parts (up to 6%, not shown) when a ridge over the Mediterranean Sea and North Africa transfers the air masses towards Southern Europe (W200_CT3+, W200_CT5+). On the contrary, the impact of the regional anthropogenic sources decreases significantly, contributing up to 18 and 10% in the MT and the UT during winter, respectively (Fig. S6-1). However, as already mentioned, there are some regions over Eastern Europe, where COFFEU reaches 22% in the UT due to strong convection in summer.
Similarly to the surface, some differences are found between GEOS-CHEM and MOZART-2 results at 500 hPa and 200 hPa. Moreover, the contribution of the anthropogenic emissions (and the chemistry production) in GEOS-CHEM is up to ~20% higher (lower) than MATCH-MPIC results over Western Europe in MT (Fischer et al., Citation2006). These discrepancies are attributed to the global models’ configurations (i.e. grid resolution, emission inventories, OH concentrations).
4. Conclusions
In the present study, the European CO budget was examined in relation to the prevailing atmospheric conditions in 2001, based on the nested-grid simulations of the GEOS-CHEM global model. To this aim, a seasonal CT classification was developed for the NH at the SLP and two atmospheric levels in the MT and the UT, over a 60-yr period. It was found that the regional anthropogenic emissions have significant impacts on the European CO levels in the LT, contributing to the surface CO budget up to ~80%, depending on the season and the atmospheric conditions. Particularly in winter, the anticyclonic circulation patterns over Europe favoured the pollutant's accumulation close to the sources. In summer, the prevailing northerly winds favoured the pollutant's transport of anthropogenic or biomass burning origins from Northern and Eastern Europe southwards, increasing the CO levels in Southern Europe.
The transport of the anthropogenic pollution from North America and Asia towards the European LT was favoured by the westerly circulation, contributing up to 18–20% each to the CO surface concentrations over Europe in winter. On the contrary, the less organised atmospheric circulation in summer, in conjunction with the lower anthropogenic emissions, limited these contributions to 12–15% during this season. The Asian and the North American contributions at three regions in Europe, where CO measurements were available at 31 rural background stations for the study year, were found highest (lowest) in winter and spring (summer and autumn). In winter, the LRT at SLP was intense mainly under the prevalence of cyclonic circulation patterns. During the other seasons, the pollutant's transport towards Europe was enhanced for several cyclonic and anticyclonic patterns. The Asian tracer contribution was found higher than the North American in winter, spring and summer under most CTs (but lower in autumn). Events where the LRT contribution is higher than the regional one by up to ~45% were detected at all station sites mainly in winter and spring. The LRT contribution increased in the free troposphere, with the Asian anthropogenic sources’ contribution being higher than the North American in most cases. In particular, the Asian tracer reached~30% over the Eastern Mediterranean in the UT during summer, favoured by the prevailing easterlies. In the MT, this contribution was 25% during winter in Western Europe and at higher latitudes, reflecting the transport pathways followed by the pollutant under the influence of the prevailing winds. Similarly, the North American contribution was highest during winter (summer) in the MT (UT) at the western parts of the continent, reaching 18% (14%). On the other hand, no significant amount of CO originated from the remaining parts of the world. Low biomass burning signals from Africa were detected over Southern Europe in the UT (6%). The regional anthropogenic emissions’ contribution in the free troposphere was lower than the surface, contributing 18% (10%) in the MT (UT). However, higher regional contribution was found over Eastern Europe in summer (22%) due to strong convection. The contribution of the CO chemical production was high at all levels and seasons, exceeding 50% in the UT during summer. Quantitative differences between GEOS-CHEM and other global models’ results were attributed mainly to different models’ configurations.
Supplementary Material
Download PDF (1.3 MB)Acknowledgments
Datasets were provided by the NOAA/ESRL Physical Sciences Division, Boulder, Colorado, from their Web site http://www.esrl.noaa.gov/psd/data/composites/day/. We also acknowledge European Environmental Agency (© E.E.A, Copenhagen, 2001) for providing Airbase data.
Notes
To access the supplementary material to this article, please see Supplementary files under Article Tools online.
Related Research Data
References
- Allen D. J , Kasibhatla P , Thompson A. M , Rood R. B , Doddridge B. G , co-authors . Transport-induced interannual variability of carbon monoxide determined using a chemistry and transport model. J. Geophys. Res. 1996; 101(D22): 28655–28669.
- Auvray M , Bey I . Long-range transport to Europe: seasonal variations and implications for the European ozone budget. J. Geophys. Res. 2005; 110: 11303.
- Balis D , Amiridis V , Zerefos C , Gerasopoulos E , Andreae M. O , co-authors . Raman lidar and sunphotometric measurements of aerosol optical properties over Thessaloniki, Greece, during a biomass burning episode. Atmos. Environ. 2003; 37(32): 4529–4538.
- Barry R. G , Chorley R. J . Atmosphere, Weather and Climate. 2003; Boca Raton, FL: Routledge. 8th ed.
- Bey I , Jacob D. J , Logan J. A , Yantosca R. M . Asian chemical outflow to the Pacific in spring: origins, pathways, and budgets. J. Geophys. Res. 2001a; 106(D19): 23097–23113.
- Bey I , Jacob D. J , Yantosca R. M , Logan J. A , Field B , co-authors . Global modeling of tropospheric chemistry with assimilated meteorology: model description and evaluation. J. Geophys. Res. 2001b; 106: 23073–23096.
- Chen D , Wang Y , McElroy M. B , He K , Yantosca R. M , co-authors . Regional CO pollution and export in China simulated by the high-resolution nested-grid GEOS-Chem model. Atmos. Chem. Phys. 2009; 9: 3825–3839.
- Christoudias T , Pozzer A , Lelieveld J . Influence of the North Atlantic oscillation on air pollution transport. Atmos. Chem. Phys. 12: 869–877.
- Chung K. K , Chan J. C. L , Ng C. N , Lam K. S , Wang T . Synoptic conditions associated with high carbon monoxide episodes at coastal station in Hong Kang. Atmos. Environ. 1999; 33: 3099–3095.
- Cooper O. R , Moody J. L , Parrish D. D , Trainer M , Holloway J. S , co-authors . Trace gas composition of midlatitude cyclones over the western North Atlantic Ocean: a seasonal comparison of O3 and CO. J. Geophys. Res. 2002; 107(D7): 4057.
- Drori R , Dayan U , Edwards D. P , Emmons L. K , Erlick C . Attributing and quantifying carbon monoxide sources affecting the Eastern Mediterranean: a combined satellite, modelling, and synoptic analysis study. Atmos. Chem. Phys. 2012; 12: 1067–1082.
- Duncan B. N , Bey I . A modelling study of the export pathways of pollution from Europe: seasonal and interannual variations (1987–1997). J. Geophys. Res. 2004; 109: 08301.
- Duncan B. N , Logan J. A . Model analysis of the factors regulating the trends and variability of carbon monoxide between 1988 and 1997. Atmos. Chem. Phys. 2008; 8: 7389–7403.
- Duncan B. N , Martin R. V , Staudt A. C , Yevich R. M , Logan J. A . Interannual and seasonal variability of biomass burning emissions constrained by remote-sensed observations. J. Geophys. Res. 2003; 108(D2): 4040.
- European Commission (EC). San-Miguel-Ayanz J , Barbosa P , Libert G , Schmuck G , Schulte E . Forest fires in Europe – 2001 fire campaign. Official Publication of the European Communities. 2002. SPI.02.72.EN, Italy.
- Fiore A. M , Horowitz L. W , Purves D. W , Levy H II , Evans M. J , co-authors . Evaluating the contribution of changes in isoprene emissions to surface ozone trends over the eastern United States. J. Geophys. Res. 2005; 110: 12303.
- Fischer H , Lawrence M , Gurk Ch , Hoor P , Lelieveld J , co-authors . Model simulations and aircraft measurements of vertical, seasonal and latitudinal O3 and CO distributions over Europe. Atmos. Chem. Phys. 2006; 6: 339–348.
- Guerova G , Bey I , Attie J.-L , Martin R. V , Cui J , co-authors . Impact of transatlantic transport episodes on summertime ozone in Europe. Atmos. Chem. Phys. 2006; 6: 2057–2072.
- Holloway T , Levy H , Kasibhatla P . Global distribution of carbon monoxide. J. Geophys. Res. 2000; 105(D10): 12123–12147.
- Horowitz L. W , Walters S , Mauzerall D. L , Emmons L. K , Rasch P. J , co-authors . A global simulation of tropospheric ozone and related tracers: description and evaluation of MOZART, version 2. J. Geophys. Res. 2003; 108(D24): 4784.
- Huang S , Siegert F , Goldammer J. G , Sukhinin A. I . Satellite-derived 2003 wildfires in southern Siberia and their potential influence on carbon sequestration. Int. J. Remote. Sens. 2009; 30(6): 1479–1492.
- Huntrieser H , Schlager H , Stohl A . Air pollution export from and import to Europe: experimental evidence. Air Pollution, The Handbook of Environmental Chemistry. 2004; Berlin: Springer. 69–98.
- Jolliffe I. T . Principal component analysis: a beginner's guide-II. Pitfalls, myths and extensions. Weather. 1993; 48: 246–253.
- Kallos G , Astitha M , Katsafados P , Spyrou C . Long-range transport of anthropogenically and naturally produced particulate matter in the Mediterranean and North Atlantic: current state of knowledge. J. Appl. Met. Clim. 2007; 46(8): 1230–1251.
- Kallos G , Papadopoulos A , Katsafados P , Nickovic S . Transatlantic Saharan dust transport: model simulation and results. J. Geophys. Res. 2006; 111: 09204.
- Kalnay E , Kanamitsu M , Kistler R , Collins W , Deaven D , co-authors . The NCEP/NCAR 40-year reanalysis project. Bull. Am. Meteorol. Soc. 1996; 77: 437–471.
- Kanakidou M , Crutzen P. J . The photochemical source of carbon monoxide: importance, uncertainties and feedbacks. Chemosphere. Global. Change. Sci. 1999; 1: 91–109.
- Kanakidou M , Dentener F. J , Brasseur G. P , Berntsen T. K , Collins W. J , co-authors . 3D global simulations of tropospheric CO distributions: results of the GIM/IGAC intercomparison 1997 exercise. Chemosphere. Global. Change. Sci. 1999; 1: 263– 282.
- Kasischke E. S , Hyer E. J , Novelli P. C , Bruhwiler L. P , French N. H. F , co-authors . Influences of boreal fire emissions on Northern Hemisphere atmospheric carbon and carbon monoxide. Global. Biogeochem. Cycles. 2005; 19: 1012.
- Kistler R , Kalnay E , Collins W , Saha S , White G , co-authors . The NCEP–NCAR 50-year reanalysis: monthly means CD-ROM and documentation. Bull. Am. Meteorol. Soc. 2001; 82: 247–267.
- Kostopoulou E , Jones P. D . Comprehensive analysis of the climate variability in the eastern Mediterranean part I: map-pattern classification. Int. J. Climatol. 2007; 27: 1189–1214.
- Lawrence M. G , Rasch P. J , von Kuhlmann R , Williams J , Fischer H , co-authors . Global chemical weather forecasts for field campaign planning: predictions and observations of large-scale features during MINOS, CONTRACE and INDOEX. Atmos. Chem. Phys. 2003; 3: 267–289.
- Lelieveld J , Berresheim H , Bormann S , Crutzen P. J , Dentener F. J , co-authors . Global air pollution crossroads over the Mediterranean. Science. 2002; 298: 794–799.
- Liang Q , Jaegle L , Jaffe D. A , Weiss P , McClintick A , co-authors . Long-range transport to the Northeast Pacific: seasonal variations and transport pathways of carbon monoxide. J. Geophys. Res. 2004; 109(D23): 23S07.
- Li Q , Jacob D. J , Bey I , Palmer P. I , Duncan B. N , co-authors . Transatlantic transport of pollution and its effects on surface ozone in Europe and North America. J. Geophys. Res. 2002; 107: 4166.
- Li Q , Jacob D , Park R , Wang Y , Heald C , co-authors . North American pollution outflow and the trapping of convectively lifted pollution by upper-level anticyclone. J. Geophys. Res. 2005; 110: 10301.
- Liu H , Jacob D. J , Bey I , Yantosca R. M , Duncan B. N , co-authors . Transport pathways for Asian pollution outflow over the Pacific: interannual and seasonal variations. J. Geophys. Res. 2003; 108: 8786.
- Liu J , Drummond J. R , Jones D. B. A , Cao Z , Bremer H , co-authors . Large horizontal gradients in atmospheric CO at the synoptic scale as seen by spaceborne measurements of pollution in the troposphere. J. Geophys. Res. 2006; 111: 02306.
- Miyoshi A , Hatakeyama S , Washida N . OH radical-initiated photooxidation of isoprene: an estimate of global CO production. J. Geophys. Res. 1994; 99(D9): 18779–18787.
- Park R , Jacob D , Kumar N , Yantosca R . Regional visibility statistics in the United States: natural and transboundary pollution influences, and implications for the regional haze rule. Atmos. Environ. 2006; 40(28): 5405–5423.
- Paulot F , Crounse J. D , Kjaergaard H. G , Krten A , Clair J. M , co-authors . Unexpected epoxide formation in the gas-phase photooxidation of isoprene. Science. 2009; 325: 730.
- Pétron G . Mode'lisation inverse des e'missions du monoxyde de carbone. 2003; Paris: Université Pierre et Marie Curie Paris 6. PhD Thesis.
- Pfister G , Pétron G , Emmons L. K , Gille J. C , Edwards D. P , co-authors . Evaluation of CO simulations and the analysis of the CO budget for Europe. J. Geophys. Res. 2004; 109: 19304.
- Protonotariou A. P , Tombrou M , Giannakopoulos C , Kostopoulou E , Le Sager P . Study of CO surface pollution in Europe based on observations and nested-grid applications of GEOS-CHEM global chemical transport model. Tellus. B. 2010; 62: 209–227.
- Roelofs G.-J , Scheeren B , Heland J , Ziereis H , Lelieveld J . A model study of ozone in the eastern Mediterranean free troposphere during MINOS (August 2001). Atmos. Chem. Phys. 2003; 3: 1199–1210.
- Salisbury G , Williams J , Holzinger R , Lange L , Xu X , co-authors . Ground-based PTR-MS measurements of reactive organic compounds during the MINOS campaign in Crete, July–August 2001. Atmos. Chem. Phys. 2003; 925–940.
- Scheeren H. A , Lelieveld J , Roelofs G. J , Williams J , Fischer H , co-authors . The impact of monsoon outflow from India and South-East Asia in the upper troposphere over the eastern Mediterranean. Atmos. Chem. Phys. 2003; 3: 1589–1608.
- Schultz M , Bey I , Stohl A . Numerical modelling of long-range pollution transport in intercontinental transport of air pollution. Air Pollution, The Handbook of Environmental Chemistry. 2004; Berlin: Springer. 197–223. Vol. 4G.
- Stohl A . A 1-year Lagrangian “climatology” of airstreams in the Northern Hemisphere troposphere and lowermost stratosphere. J. Geophys. Res. 2001; 106: 7263–7279.
- Stohl A , Eckhardt S , Forster C , James P , Spichtinger N . On the pathways and timescales of intercontinental air pollution transport. J. Geophys. Res. 2002; 107(D23): 4684.
- Stohl A , Forster C , Eckhardt S , Spichtinger N , Huntrieser H , co-authors . A backward modeling study of intercontinental pollution transport using aircraft measurements. J. Geophys. Res. 2003a; 108: 4370.
- Stohl A , Huntrieser H , Richter A , Beirle S , Cooper O , co-authors . Rapid intercontinental air pollution transport associated with a meteorological bomb. Atmos. Chem. Phys. 2003b; 3: 969–985.
- Tanimoto H , Sato K , Butler T , Lawrence M. G , Fisher J. A , co-authors . Exploring CO pollution episodes observed at Rishiri Island by chemical weather simulations and AIRS satellite measurements: long-range transport of burning plumes and implications for emissions inventories. Tellus. B. 2009; 61: 394–407.
- Tombrou M , Bossioli E , Protonotariou A. P , Flocas H , Giannakopoulos C , co-authors . Coupling GEOS-CHEM with A regional air pollution model for Greece. Atmos. Environ. 2009; 43(31): 4793–4804. ISSN 1352-2310.
- Traub M , Fischer H , De Reus M , Kormann R , Heland J , co-authors . Chemical characteristics assigned to trajectory clusters during the MINOS campaign. Atmos. Chem. Phys. 2003; 3: 459–468.
- Trickl T , Cooper O. R , Eisele H , James P , Mücke R , co-authors . Intercontinental transport and its influence on the ozone concentrations over central Europe: three case studies. J. Geophys. Res. 2003; 108(D12): 8530.
- Wang H , Jacob D. J , Le Sager P , Streets D. G , Park R. J , co-authors . Surface ozone background in the United States: Canadian and Mexican pollution influences. Atmos. Environ. 2009a; 43(6): 1310–1319. ISSN 1352-2310.
- Wang Y , Hao J , McElroy M. B , Munger J. W , Ma H , co-authors . Ozone air quality during the 2008 Beijing Olympics: effectiveness of emission restrictions. Atmos. Chem. Phys. 2009b; 9: 5237–5251.
- Wang Y , Jacob D. J , Logan J. A . Global simulation of tropospheric O3-NOx-hydrocarbon chemistry 1. Model formulation. J. Geophys. Res. 1998; 103(D9): 10713–10726.
- Wang Y. X , McElroy M. B , Jacob D. J , Yantosca R. M . A nested-grid formulation for chemical transport over Asia: applications to CO. J. Geophys. Res. 2004a; 109: D22307.
- Wang Y. X , McElroy M. B , Wang T , Palmer P. I . Asian emissions of CO and NOx: constraints from aircraft and Chinese station data. J. Geophys. Res. 2004b; 109(D24304):
- Weiss-Penzias P , Jaffe D , McClintick A , Jaeglé L , Liang Q . The influence of long-range transported pollution on the annual and diurnal cycles of carbon monoxide and ozone at Cheeka Peak observatory. J. Geophys. Res. 2004; 109(D23): D23S14.
- Wild O , Akimoto H . Intercontinental transport of ozone and its precursors in a three dimensional global CTM. J. Geophys. Res. 2001; 106: 27729–27744.
- Wilks D. S . Statistical Methods in the Atmospheric Sciences: An Introduction.
- Yarnal B . Synoptic Climatology in Environmental Analysis. 1993; London: Belhaven. 195. 1st ed.
- Yurganov L. N , Duchatelet P , Dzhola A. V , Edwards D. P , Hase F , co-authors . Increased Northern Hemispheric carbon monoxide burden in the troposphere in 2002 and 2003 detected from the ground and from space. Atmos. Chem. Phys. 2005; 5: 563–573.
- Zhang L , Jacob D. J , Downey N. V , Wood D. A , Blewitt D , co-authors . Improved estimate of the policy-relevant background ozone in the United States using the GEOS-Chem global model with 1/2°×2/3° horizontal resolution over North America. Atmos. Environ. 2011; 45(37): 6769–6776.