Abstract
Because of the difficulties in setting up arrangements in the intertidal zone for free-air carbon dioxide enrichment experimentation, the responses to increasing atmospheric carbon dioxide in mangrove forests are poorly studied. This study applied box model to overcome this limitation, and the relative changes in present level of reservoirs organic carbon contents in response to the future increase of atmospheric carbon dioxide were examined in the Avicennia-dominated mangrove forest at the land–ocean boundary of the northeast coast of the Bay of Bengal. The above- and below-ground biomass (AGB+BGB) and sediment held different carbon stock (53.20±2.87Mg C ha−1 (mega gram carbon per hectare) versus 18.52±2.77Mg C ha−1). Carbon uptake (0.348mg C m−2s−1) is more than offset by losses from plant emission (0.257mg C m−2s−1), and litter fall (13.52µg C m−2s−1) was more than soil CO2 and CH4 emission (8.36 and 1.39µg C m−2s−1, respectively). Across inventory plots, Sundarban mangrove forest carbon storage in above- and below-ground live trees and soil increased by 18.89 and 5.94Mg C ha−1 between June 2009 and December 2011. Box model well predicted the dynamics of above- and below-ground biomass and soil organic carbon, and increasing atmospheric carbon dioxide concentrations could be the cause of 1.1- and 1.57-fold increases in carbon storage in live biomass and soil, respectively, across Sundarban mangrove forest rather than recovery from past disturbances.
1. Introduction
In the past decade, anthropogenic emissions of CO2, primarily as a result of fossil fuel burning, increased at a rate of 3.4% per year. The level of CO2 concentration in the atmosphere at the advent of the industrial revolution in the 19th century rose from 280ppmv to the present level of 388ppmv and is estimated to hit 525ppmv by 2100 (IGBP, Citation2009). Experiments have unequivocally shown that plants can grow faster in a CO2-enriched atmosphere (Wullschleger et al., Citation1995; Curtis and Wang, Citation1998; Norby et al., Citation1999). Increasing uptake by the biosphere in response to the fossil-fuel driven increase in atmospheric CO2 (CO2 fertilisation) could slow down the rate of increase in atmospheric CO2 (Cramer et al., Citation2001; Thompson et al., Citation2004). The contribution of CO2 fertilisation to the future global C cycle has been uncertain, especially in forest ecosystems that dominate global carbon sequestration. For correct prediction of the magnitude of CO2 fertilisation effect on net C exchange with the atmosphere, it is necessary to define a model on the basis of experimental data (Norby et al., Citation2005). Box model approach has been used for budgeting various biogeochemical processes in the ocean (Frost and Franzen, Citation1992; Berner, Citation1994) and estuaries (Mukhopadhyay et al., Citation2006).
The implications of such a model could be used to guide management decisions with respect to a global carbon sequestration program in the tropical forest ecosystem.
Tropical forests process about six times as much carbon as the global anthropogenic emission. Changes in carbon dynamics in tropical forests with 50% contribution to global terrestrial gross primary production (GPP) (Grace et al., Citation2001) could alter the pace of climate change (Adams and Piovesan, Citation2005). Regional studies of carbon exchange vary in showing the disequilibrium state of a tropical forest and in increasing stocks of tree carbon (Phillips et al., Citation1998; Lewis et al., Citation2009). Although mangroves account for only 0.7% of the tropical forest area (Giri et al., Citation2011), their influence on the global C cycle is disproportionate to spatial extent with large C pools and strong C sinks (Chmura et al., Citation2003). Global mangroves have C stocks of 3×10¹⁴ mol C and net ecosystem production of 1.5–4.6×10¹³ mol C yr−1 (Twilley et al. Citation1992; Gattuso et al., Citation1998). Although mangroves account for about 15% of the total C accumulated in modern marine sediments, indicating its importance in global C budget (Bouillon et al., 2008a). Mangrove forest across Indo-Pacific region-spanning 30° of latitude and 73° of longitude is dominated by Bruguiera (Borneo, Indonesia) and Rhizophora (Sulawesi, Indonesia). It is one of the most carbon-rich forests in the tropics and contains about 2.5-fold greater carbon storage (on average 1023Mg carbon per hectare) relative to Boreal, Temperate and Tropical upland forests (Donato et al., Citation2011). The CO2 FIX V.2 is a version 2 of CO2 FIX model and is a multicohort ecosystem-level model based on carbon accounting of forest stands, including forest biomass, soils and products. Up to date, CO2 FIX V.2 among the several models (Dewar, Citation1991; Mery and Kanninen, Citation1999; White et al., Citation2000) developed for estimating the carbon sequestration potential has been found applicable to selected temperate and tropical forests (Masera et al., Citation2003) and the approach for modeling carbon sequestration in the mangrove forests among the most carbon-rich forests in the tropics could be different from Boreal, Temperate and Tropical upland forests (Donato et al., Citation2011). The existing simulation models for mangroves are not useful for wider application in the context of global climate change (Berger et al., Citation2008) and are limited to Bruguiera dominated mangrove forest (Luo et al., Citation2001).
The Indian Sundarbans mangrove forest at the land–ocean boundary of the Gangetic delta and the Bay of Bengal covers an area of 9630km2 out of which 4264km2 is law-protected forest. It is the largest delta on the globe (world heritage site: http://www.unesco.org/en/list/452) and covers about 2.84% of the global mangrove area (15×104km2). Sundarban mangrove forest is a sink for CO2 (Ganguly et al., Citation2008), and it could be more sensitive to increasing CO2 during the course of climate change. Because of the difficulty for easy access in this tiger- and snake-inhabited Sundarban mangrove forest as well as technical problem for field experiment under water logged condition of the swamp during high tide, studies that address the interactive effects of increasing CO2 concentration on the carbon sequestration of this mangrove forest are lacking. To take into account the responses in the ecological and physiological processes to various environmental constrains, fluxes between biosphere-atmosphere-sediment under in situ conditions were incorporated into the box model, and it was used as a tool to overcome the difficulties for conducting the free-air carbon dioxide enrichment experimentation at the land ocean boundary in the Sundarban mangrove forest. In this study, we synthesised data from the field surveys to parameterise the box model to simulate the dynamics of this mangrove forest in terms of forest biomass and sediment organic carbon in response to elevated atmospheric CO2 concentrations. Our objectives were to: (1) quantify the partitioning of atmospheric CO2 in the above- and below-ground biomass (AGB+BGB) and sediment of the Sundarban mangrove forest, and (2) predict the dynamics of above- and below-ground biomass and soil organic carbon in response to the future increase of atmospheric carbon dioxide with the help of box model approach.
2. Study area, geology and soil
The study sites located in the Sundarbans (21°32′ and 22°40′ N; 88°05′ and 89°E), India, is the focus of this study. The area is covered with thick mangroves, and in 1985, it was included in UNESCO's list of world heritage sites. It is the last frontier of Bengal flood plains, sprawling archipelago of 102 islands out of which 54 are reclaimed for human settlement. For a detailed description of the station locations refer to Ray et al., Citation2011.
The tidal Islands at the central positions show elevations of the order of 3–8m from mean sea level. Tide in the study area is semidiurnal with tidal amplitude, i.e. 2.5–7m. Mean current velocities range between 117 and 108cm s−1 during low tide and high tide, respectively (Mukhopadhyay et al., Citation2006). Geologically the area is the result of extensive fluvio-marine deposits of the river Ganges and Bay of Bengal and the character of the sediment of the study site is silty clay (sand 9.23%, silt 79.6%, clay 11.2%). The sediment is composed of quartzo-feldspathic minerals (quartz, albite, microcline) contributed from the eroded rocks of acidic composition of the drainage basin. Flaky mica and chlorite are also found to occur in the sediment, though inconsistent. The large tidal range and extremely gentle shelves (1.2–4.0°) with muddy substrate make water current and tidal action quite appropriate for extensive mangrove occurrence. Avicennia marina, Avicennia alba and Avicennia officinalis are the dominant mangrove followed by other mangrove species like Excoecaria agallocha, Ceriops decandra, Aegialitis rotundifolia, etc.
3. Material and methods
Between June 2009 and December 2011, all measurements were made monthly and quadrates (10×10m) were selected randomly in west Sundarbans: Lothian Island North (Stn.1, four quadrates), Lothian Island South, Ecocamp (Stn.2, four quadrates), Prentice Island (Stn.3, two quadrates), and in east Sundarbans: Bonnie camp (Stn. 4, two quadrates) and Halliday Island (Stn.5, four quadrates) for breast height diameter measurements of mangrove trees. About 25m observatory towers constructed by the Ministry of Forestry, Govt. of WB, over the mangrove forest stands at Stns 1, 2 and 4 were used for micrometeorological observation. The facility of observatory tower at Stn. 3 was not available. Considering the number of mangrove species in a quadrate and their density, height and diameter, above- and below-ground biomass (AGB+BGB, M F) was obtained from allometric equations separately. Diameter (dbh, diameter at breast height) measurements were converted to carbon stocks using allometric equations (Ray et al., Citation2011). Litters (F FS) were collected from several traps (3×3m) made of nylon screen in different site locations and suspended below the canopy from branches of the trees at height sufficiently above the ground to avoid tidal inundation. Core samples were collected by using a corer made of stainless steel (5.5cm inner diameter) at different depths up to 30cm from surface and soil organic carbon (M S) was calculated from bulk density (ρ=2.5g cm−3) and the percentage of organic carbon at each depth in the sediment profile of depth 0–30cm (Ray et al., Citation2011). Carbon was estimated in different components of dried plant material and soil using CHN Analyzer (2400 series-11, Parkin-Elmer). The enclosed static chamber technique (Bartlett et al., Citation1987; Van der Nat and Middelburg, Citation2000) was used to measure soil CO2 and methane (CH4) emission (F SA). Estimation of soil CO2 emission by chamber technique does not differentiate between autotrophic and heterotrophic soil respiration. Mangrove ecosystems are generally considered net autotrophic, and have high productivity with a low ratio of sediment respiration to net primary production (Yong et al., Citation2011). The diameter at breast height (dbh) and density were considered to estimate the above- and below-ground biomass (AGB, BGB) using allometric equations (Ray et al., Citation2011) and the biomass is converted to an equivalent amount of carbon stock. The mean carbon stock in terms of AGB and BGB obtained from different quadrate values was expressed in mega gram carbon per hectare (Mg C ha−1).
Micrometeorological parameters were obtained from a local meteorological office (Alipore, Kolkata), and incoming radiation (418.5–435.2W m−2) and height of mixed layer depth (775–1039 m) were obtained from NOAA, ARL database (http://www.arl.noaa.gov/ready.html). The atmospheric CO2 concentration was determined by gas chromatography at Stns 1, 2 and 4. The rate of CO2 exchange between the atmospheric and biosphere (F
AF and F
FA) was calculated from the concentration difference (χ) between 10 and 20 m: Δχ=χ10 – χ20, aerodynamic (r
a) and surface layer (r
s) resistance. With exchange velocity, V
C, defined as 1/(r
a+r
s), net flux, F, was calculated using the relation (Barrett, Citation1998):1
Negative F indicates net transfer from the atmosphere to the biosphere and positive F, for emission. The aerodynamic resistance, r
a, describes the resistance to transport between the reference height (Z) at which the concentration is measured and the quasi-laminar layer next to the receiving surface and can be evaluated as (Wesely and Hicks, Citation1977):2 Here, Z
0 is roughness height and was determined from the intercept (lnZ
0) of the straight line obtained by plotting ln Z versus u. k is the dimensionless Von Karman constant (0.4), and ψc is a correction function for atmospheric stability, which serves to increase r
a for stable condition and to decrease it for unstable condition. The equations for the correction functions are (Wesely and Hicks, Citation1977):
3
The correction functions are expressed in terms of a stability parameter Z/L, in which Z is the height and L is the Obukhov Scale length. The friction velocity, u*, was estimated from the wind velocity at 10 and 20m in the following manner:4 Gradients of wind velocity and temperature observed over the canopy at 10 and 20m for computing aerodynamic resistance were found well within the limit of sensitivity (± 0.01°C and±0.01 ms−1) of the used sensors.
Considering the stability classes of Pasquill: A–F (Pruppacher and Klett, Citation1997), the scale length, L, was evaluated using the following:5 where ‘a’ ranges between 0.035 and −0.096 and ‘b’ ranges between 0.029 and −0.036 (Golder, Citation1972).
Pasquill stability classes in terms of wind speed, insolation and state of sky were as follows: D–F (stable) for post-monsoon, B–D (unstable) for pre-monsoon and E, F for monsoon in the night-time and A–C (unstable) for post-monsoon, E, F (unstable) for pre-monsoon and B (unstable or occasionally stable) were observed in the daytime. For surface layer resistance (r
s), following relations with surface transfer function, B−1 (Wesely and Hicks, Citation1977) and u* were used:6 where k is the Von Karman constant; K is the thermal diffusivity of air and D
c is the molecular diffusivity:
7
where T 2 is the absolute temperature at 20m height (Ganguly et al., Citation2008).
Only data from runs in near-neutral stability were considered to minimise error (Mukhopadhyay et al., Citation2002). Advective error varied between 0.001 and 7.15% and storage error during stable condition varied between 4.2 and 21.6%. Results of model calculations for micrometeorological constants (aerodynamic resistance, r a, surface layer resistance, r s, friction velocity, u*, exchange velocity, V c, correction function, ψc, roughness height, Z 0, reciprocal of Obukhov Scale length, 1/L, thermal diffusivity, K, CO2 molecular diffusivity and surface transfer function, B−1) calculated using wind velocity (u) and temperature (T) gradient (10m, 20m) () in the above equations are given in . The flux values reported here are to be considered as estimates rather than absolute values. Total carbon stock in the boundary layer over 4264km2 of reserved forest (M A) was computed from the mean CO2 concentration. From the difference between night-time CO2 efflux from the forest and soil emission, plant respiration (F FA) was calculated. Soil samples were centrifuged for pore water salinity and were extracted in potassium chloride (2mol L−1) for the determination of total inorganic nitrogen (TIN) and total inorganic phosphorus (TIP) by spectrophotometric method (Ganguly et al., Citation2009). Statistical analyses were done by MINITAB (version 13.1) and model equations were simplified by using MATLAB, Mathworks, (version 7.1) during the study.
Table 1. Inter-annual variation of micrometeorological and physico-chemical properties (total inorganic nitrogen (TIN), total inorganic phosphorus (TIP), pore water salinity (S) and organic carbon, (OC) of soil. (mean±standard deviation)
Table 2. Results of model calculation for micrometeorological constants (aerodynamic resistance, r a, surface layer resistance, r s, friction velocity, u*, exchange velocity, V c, correction function, ψc, roughness height, Z 0, reciprocal of Obukhov Scale length, 1/L, thermal diffusivity, K, CO2 molecular diffusivity and surface transfer function, B−1
4. Box model
Box models are representations of a system in which quantities of materials are depicted as uniform within each box, and the flux between them is shown with arrows depending on their net concentrations. Though wide classes of natural processes like radioactive decay, many forms of chemical decomposition, advective transport, and so on increase in a rate proportional to the number of molecules available and in many cases the increase could be smaller than proportional; for example, carbon-dependent photosynthesis in the sea is limited by nitrogen and phosphorus. In this study, the three box models for the carbon cycle with non-proportionalities between fluxes and reservoirs contents are considered (Rodhe and Bjorkstrom, Citation1979) for the Sundarban mangrove forest systems (). There are three coupled reservoirs of carbon in the model: (1) carbon in the form of CO2 in the atmosphere (M A), (2) carbon in the form of organic matter in above- and below-ground biomass (M F) and (3) carbon in the form of organic matter in sediments (M s). Out of the total area of Indian Sundarban (9630 km2), mangrove surrounding water covers about 18.5% and dissolved organic carbon (DOC), particulate organic carbon (POC) and dissolved inorganic carbon (DIC) could be important components of carbon budgets (Bouillon et al., 2008b). In the Sundarban mangrove ecosystem, the amount of carbon storage in the water reservoir was estimated to be 1.54Tg (Mukhopadhyay et al., Citation2006), being 19.6% of soil reservoir and 6.77% of forest reservoir (Ray et al., Citation2011), and CO2 flux from the water reservoir was found to be 0.56% (4.4×10⁻⁵mg m−2s−1; Biswas et al., Citation2004) of the mean soil emission. Therefore, in this forest dominated ecosystem, the contribution of water reservoir to the carbon dynamics has been considered minimum, and the formulation of box model in does not include it to keep the model approach simple and straightforward. The fundamental processes involved in the model are: (1) the exchange (uptake by plant productivity, F AF and emission by plant respiration, F FA) of CO2 between the atmosphere and forest, (2) the burial of above-ground biomass in the sediment through litter fall (F FS) and (3) upon burial, digenesis of organic matter and its breakdown to CO2, CH4 and recycle back to atmosphere (soil respiration, F SA). The amount of carbon stored in the atmosphere is small compared to the amount of carbon in the forest and sediment reservoirs and any anthropogenic addition (ΔM) to the atmosphere would follow the change of exchange rate from the initial value F AFo, F FAo, F FSo, F SAo, to new value F AF, F FA , F FS , F SA to adjust the level of reservoir carbon content from M Ao, M Fo , M So to M A, M F , M S . In formulating the mathematical equations describing the model, we assume that the flux F out of a reservoir is related to the reservoir content M by: (1) F AF =F AFo (M A /M Ao) βA for atmosphere to forest reservoir, (2) F FA=F FAo (M F /M Fo)βF(1) for forest to atmosphere reservoir, (3) F FS =F FSo (M F /M Fo)βF(2) for forest to soil reservoir and (4) F SA =F SAo(M S /M So)βS for soil to atmosphere reservoir and the adjustment rates and equilibrium distributions are dependent upon the value of the coefficients βA, βF(1), βF(2), and βS for reservoirs, atmosphere, forest and soil, respectively.
Fig. 1 Box model of the flow of carbon between the reservoirs and representing processes in the Sundarban forest.
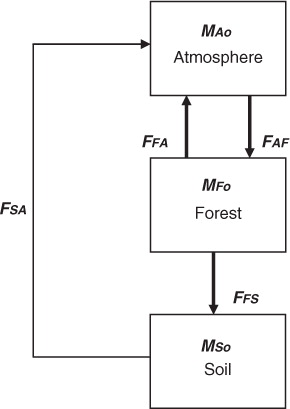
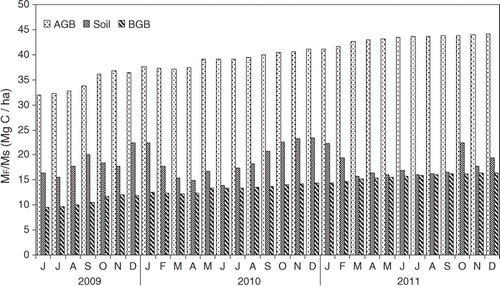
Fig. 2 Monthly variation of organic carbon in above-ground biomass (AGB), below-ground biomass and soil organic carbon (Ms) during the period between June 2009 and 2011.
In case the system receives an additional mass ΔM which distributes (e.g. reservoir distribution is adjusted from the initial value M Ao, M Fo , M So in the atmosphere, forest and sediment, respectively, to M A, M F and M S) such that fluxes in both directions are equal, the mass balance would be (5) M A+M F +M S=M Ao +M Fo +M So +ΔM.
Regression analysis and following formula of RMSE (square root of the mean of the squared prediction error) were used to examine the best-fit, i.e. the value when the observed variable and the modelled variable have the best agreement.
RMSE=√Σ n i=1 (x m –x 0 )2 /n, where x m is the modelled value and x 0 is the observed value, and n is number of observed values.
5. Results and discussion
Annual movement of the Inter-tropical Convergence Zone in this part of the world produces significant changes in micrometeorological parameters throughout the year because of differential temperature and pressure in different seasons. Climate in the region is characterised by the southwest monsoon (June–September), northeast monsoon or post-monsoon (October–January) and pre-monsoon (February–May); 70–80% of annual rain fall occurs during the summer monsoon (Southwest monsoon). Inter-annual variation of mean temperature, humidity and rainfall ranged between 24.9 and 27.77°C, 67.63 and 72.77% and 1549–2500mm. Mean temperature was the least in 2010 which was consistent with the maximum wind speed in the same year. During the study period between 2009 and 2011, atmospheric CO2 concentration was found to increase from 373.5 to 378ppmv and observed overall increase of 4.5 or 2.25ppmv yr−1 at 10m is greater than standard error (±1.22−1.73ppmv). Inter-annual increase of CO2 is consistent with a global increase rate of 2ppmv yr−1 (IGBP, Citation2009). ANOVA test is carried out to find out if a significant difference exists in the monthly CO2 concentration between years. Monthly CO2 concentration in three different years significantly differs (F=4.21, p=0.021, df=2, 33), and the interannual increase is significant. The mean salinity of pore water, noted during 2010, is highest ca. 24.11±5.63 and lowest during 2011 coming down to 19.33±4.93. Available nutrient pools are small (nitrogen 1.7–3.33µg g−1, phosphorus 0.14–0.39µg g−1) indicating their rapid turnover in consistently warm temperatures (Ganguly et al., Citation2009).
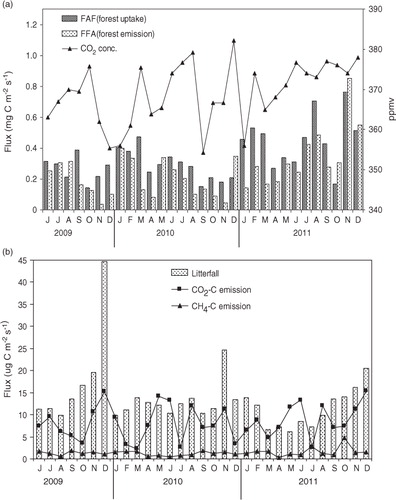
Carbon concentrations were found to be 42.4–43.05% in stems, 42.09–42.5% in leaves and 34.6–42.1% in litter. The carbon stock in the above- and below-ground biomass was increased from 41.62 to 60.50Mg C ha−1 during the study period (). There is a clear difference between rate of uptake and emission in CO2 flux above the canopy (a) with uptake rate varied between 0.14 and 0.76mg C m−2 s−1 (mean 0.348±0.14mg C m−2s−1), and emission rate varied between 0.04 and 0.85mg C m−2 s−1 (mean 0.257±0.16mg C m−2s−1). Monthly variation of litter fall (b) was greater (6.15–44.7µg C m−2s−1 and mean 13.52±6.93µg C m−2s−1) than soil CO2 (2.28−15.47µg C m−2s−1 and mean 8.36±3.84µg C m−2s−1) and CH4 (0.37–4.8µg C m−2s−1 and mean 1.39±0.79µg C m−2s−1) emission. Soil organic carbon varied between 0.64 and 0.79% (), and total carbon storage in the top 30cm of soil ranged between 16.43 and 22.37Mg C ha−1 with a mean of 18.37±2.77Mg C ha−1.
Fig. 3 Monthly variation of (a) biosphere–atmosphere exchange of CO2 –C, (b) litter fall (F FS) and soil emission (F SA) during the period between June, 2009 and 2011.
Regressions between (1) F AF (atmosphere to forest flux F AF) and M A /M Ao (relative changes in M A from the initial value M Ao), (2) F FA (forest to atmosphere flux) and M F /M Fo (relative changes in M F from the initial value M Fo), (3) F SA (soil to atmosphere flux) and M S /M So (relative changes in M S from the initial value M So), and (4) F FS (forest to soil flux) and M F /M Fo (relative changes in M F from the initial value M Fo) were obtained using data for the period between June 2009 and 2011 (). The model treats C flux rate F FA, F FS as a function of C stocks (M F) with explained variability of 65.95 and 45.48%, respectively, indicating that other environmental factors could also affect flux rates. The values of βA, βF(1), βF(2), and βS were found >1 and both forest emission and litter fall are strongly dependent upon the above-ground biomass reservoir and the internal adjustment is a fast process inside the combined reservoir. By solving the box model equations 1–4 with the help of MATLAB, Mathworks, version 7.1, two equations are obtained: (6) M A=2.25×10⁻²⁴ (M F) 13.74 and (7) M S=1.77×10⁻⁷ (M F) 4.75.
Table 3. Regression equations between the fluxes and the reservoirs
From eqs. (5)–(7), the distribution of reservoir content M Ao, M Fo and M So was found to be 0.47, 49.85 and 21.03Mg C ha−1, respectively, at CO2 level of 367ppmv in the boundary layer. A sensitivity test was performed with a CO2 concentration increase from the present mean 367ppmv to 380, 400, 420, 460, 480, 500, 520, 540, 560 and 580ppmv and results are shown in . It also shows an increasing trend with greater slope for M s relative to M F (). Model outputs of M F and M S were compared with the observed values (2011) for the study sites (). Using Box model, the modelled and observed M F (R 2=97.07, p<0.001) and M S (R 2=70.0, p<0.001) reached the best agreement with RMSE at the minimum (±0.94 and ±2.12Mg C ha−1, respectively). The relative changes in M F (AGB and BGB) and Ms were 1.1- and 1.57-fold greater, respectively, than the present level at a CO2 level of 580 ppmv. The present study showed that a 1.58-fold increase of atmospheric CO2 would increase AGB and BGB (M F) by 10.1%, which is consistent with the 14–19% increase of productivity in mangrove observed in the three geographically separate mangrove forests dominated by Bruguiera, Kandelia and Rhizophora across the southern coast of China (Luo et al., Citation2010). Norby et al., (Citation2005) showed that the response of forest productivity to elevated CO2 (~550ppmv) in free-air CO2 enrichment experiment in monoculture plantations of loblolly pine, and deciduous sweet gum was highly conserved with a stimulation at the median of 23±2%. Under favourable conditions of low vapour pressure deficit and low salinity tolerance (<15), Avicennia assimilates CO2 (12.5−20.1µ mol m−2s−1) by photosynthesis at a higher rate than many other mangrove species (Alongi, Citation2009). In a brackish marsh community, Cherry et al., (Citation2009) found an elevated CO2 stimulated biomass production as a result of amelioration of negative effects of salinity stress. Sherman et al., (Citation2003) suggested that the relationship between pore water salinity and forest biomass was not robust because of co-variation of salinity with other potentially stressful factors in the soil environment such as nutrient, H2S, pH and anoxic condition, flooding frequency, and so on, which could interplay with soil salinity, confounding the effects of soil salinity on mangrove growth. In this study, the data for exchange of fluxes between reservoirs to define the model were considered with a temperature variation of ~2°C between 25.51 and 27.77 and an atmospheric CO2 variation of ~7ppmv (). Since the study sites had average air temperature close to the optimal level (25°C) for photosynthesis of the majority of mangrove species (Hutchings and Saenger, Citation1987), the impact of elevated CO2 concentration alone from 367 to 580ppmv on Sundarban mangrove forests was prominent. However, increased CO2 could probably ameliorate many of the negative responses to stress (Miller, Citation1972), and its stimulating effects were demonstrated with the increase of Ms and M F at all CO2 levels. The observed variability in the biomass (AGB+BGB) with atmospheric CO2 and physico-chemical properties of soil with air temperature were used in VARIMAX-rotated factor analysis, and the results are given in . It showed the communality of the factor analysis that expressed the percentage of elements variability explained by the factor model and gave the variance explained by each retained factor. Factor loading larger than approximately 0.3 were considered statistically significant (Heidam, Citation1982). The five-factor model could explain 97.9% of the data variance. The first factor had high loading and could account for 28.7% of total variance. Association of biomass with atmospheric CO2 in the factor 1 indicates the sensitivity of the ecosystem mainly to elevated level of CO2 in the atmosphere over other factors. However, OC (organic carbon), TIN (total inorganic nitrogen) and TIP (total inorganic phosphate) in association with salinity and temperature showed positive loading in factor 2, 3, 4 and 5 indicating the role of salinity and temperature on their variation. This suggests that the increase of carbon stock in the Sundarban mangrove forest could be due to the increase in atmospheric CO2 as ecological theory predicts (Urquiza-Haas et al., Citation2007) and observational evidence suggests (Lewis et al., Citation2009). Intra and inter annual variation of soil organic carbon content showed close relation with seasonal cycle of litter fall with a maximum rate during November–December (b). CO2 enrichment could increase the partitioning of soil carbon to slower cycling pools which is consistent with evidence from the Duke Free-Air CO2 Enrichment experiment. Luo et al., (Citation2003) observed that elevated CO2 could not stimulate the release of recently fixed carbon and suggested that the fraction of easily decomposable organic matter could be lower in soils from low latitude than high-latitude forests (Valentini et al., Citation2000; Enquist et al., Citation2003). The capacity of this mangrove ecosystem to store more carbon could be attributable to the anaerobic sulphate reduction for the major decomposition pathway of organic matter (Ghosh et al., Citation2010) and its diagenetic conversion to more refractory humic substances under waterlogged anoxic condition of the soil (Eh −32.14 to −220.2mV; Mandal et al., Citation2011) owing to a 20% rise in all summer monsoon rainfall by the end of the 20th century (ScienceDaily, Citation2007) and a sea-level rise during the course of climate change (Gilman et al., Citation2008).
Fig. 4 Variation of reservoirs M F (above- and below-ground biomass), M S (soil) content in response to the change of CO2 concentration in the boundary layer.
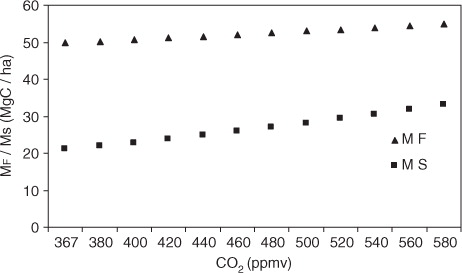
Table 4. VARIMAX-rotated factor loading matrix for biomass with atmospheric CO2 (ppmv), air temperature (T) and soil parameters (salinity, S; total inorganic phosphate, TIP; total inorganic nitrogen, TIN; organic carbon, OC)
6. Conclusions
Sundarban mangrove forest acts as sink for atmospheric CO2 and is potentially sensitive for the increasing atmospheric CO2. Carbon storage increased in above- and below-ground live trees and soil (30cm from the surface) by 18.89 and 5.94Mg ha−1 in response to the atmospheric CO2 increase from 373.5 to 378ppmv during the study period 2009–2011. This is an attempt for simple parameterisation of box model based on mass balance in three coupled reservoirs (atmosphere, forest, and soil) of carbon. It provides a useful tool to dynamically estimate the carbon stocks and flows for mangrove forest, and to improve the estimates of the carbon mitigation potential of mangrove forest options including forest management. This approach can be extended further to other tropical forests in this subcontinent.
7. Acknowledgement
We are grateful to the funding agency, Department of Science and Technology, New Delhi. Thanks are also due to Sundarban Biosphere Reserve and Divisional forest office, South 24 Parganas, Government of West Bengal, for granting permissions to carry out the study.
Related Research Data
References
- Adams J. M , Piovesan G . Long series relationships between global inter annual CO2 increment and climate: evidence for stability and change in role of the tropical and boreal–temperate zone. Chemosphere. 2005; 59: 1595–1612.
- Alongi D. M . The Energetics of Mangrove Forest.
- Barrett K . Oceanic ammonia emissions in the Europe and their trans boundary fluxes. Atmos. Environ. 1998; 32: 381–391.
- Bartlett K. B , Bartlett D. S , Harris R. C , Sebacher D. I . Methane emission along a salt marsh salinity gradient. Biogeochemistry. 1987; 4: 183–202.
- Berger U , Rivera-Monroy V. H , Doyle T. W , Dahdouh-Guebas F , Duke N. C , co-authors . Advances and limitations of individual based models to analyze and predict dynamics of mangrove forest: a review. Aquat. Bot. 2008; 89: 260–274.
- Berner R. A . GEOCARB II: a revised model of atmospheric CO2 over Phanerozoic time. Am. J. Sci. 1994; 294: 56–91.
- Biswas H , Mukhopadhyay S. K , De T. K , Sen S , Jana T. K . Biogenic controls on the air–water carbon dioxide exchange in the Sundarban mangrove environment, of Bay of Bengal, India. Limnol. Oceanogr. 2004; 49(1): 95–101.
- Bouillon S , Borges A. V , Castafieda-Moya E , Diele K , Dittmar T , co-authors . Mangrove production and carbon sinks: a revision of global budget estimates. Glob. Biogeochem. Cy. 2008a; 22(GB2013): 12.
- Bouillon S , Connolly R. M , Lee S. Y . Organic matter exchange and cycling in mangrove ecosystem; recent in sights from stable isotope studies. J. Sea. Res. 2008b; 59: 44–58.
- Cherry J. A , McKee K. L , Grace J. B . Elevated CO2 enhances biological contributions to elevation change in coastal wetlands by offsetting stressors associated with sea-level rise. J. Ecol. 2009; 97: 67–77.
- Chmura G. L , Anisfeld S. C , Cahoon D. R , Lynch J. C . Global carbon sequestration in tidal, saline wetland soils. Glob. Biogeochem. Cy. 2003; 17(4): 1111.
- Cramer W , Bondeau A , Woodward F. I , Prentice I. C , Betts R. A , co-authors . Global response of terrestrial ecosystem structure and function to CO2 and climate change: results from six dynamic global vegetation models. Glob. Change. Biol. 2001; 7: 357–373.
- Curtis P. S , Wang X. Z . A meta-analysis of elevated CO2 effects on woody plant mass, form, and physiology. Oecologia. 1998; 113: 299–313.
- Dewar R. C . An analytical model of carbon storage in the trees. Tree Physiol. 1991; 8: 239–258.
- Donato D. C , Kauffman J. B , Murdiyarso D , Kurnianto S , Stidham M , co-authors . Mangroves among the most carbon-rich forests in the tropics. Nature. Geoscience. 2011; 4: 93–297.
- Enquist B. J , Economo E. P , Huxman T. E , Allen A. P , Ignace D. D , co-authors . Scaling metabolism from organisms to ecosystems. Nature. 2003; 423: 639–642.
- Frost B. W , Franzen N. C . Grazing and iron limitation in the control of phytoplankton stock and nutrient concentration: a chemostat analogue of the Pacific equatorial upwelling zone. Mar. Ecol. Prog. Ser. 1992; 83: 291–303.
- Ganguly D , Dey M , Mandal S. K , De T. K , Jana T. K . Energy dynamics and its implication to biosphere–atmosphere exchange of CO2, H2O and CH4 in a tropical mangrove forest canopy. Atmos. Environ. 2008; 42: 4172–4184.
- Ganguly D , Dey M , Sen S , Jana T. K . Biosphere–Atmosphere exchange of NOx in the tropical mangrove forest. J. Geophys. Res. 2009; 114: G04014.
- Gattuso P , Prakignoulle M , Wollast R . Carbon and carbonate metabolism in coastal aquatic ecosystems. Annu. Rev. Ecol. Syst. 1998; 29: 405–434.
- Ghosh A , Dey N , Bera A , Tiwari A , Sathyaniranjan K. B , co-authors . Culture independent molecular analysis of bacterial communities in the mangrove sediment of Sundarban, India. Saline. Syst. 2010; 6: 1.
- Gilman E. L , Ellison J , Duke N. C , Field C . Threats to mangroves from climate change and adaptation options. Aquat. Bot. 2008; 89: 237–250.
- Giri C , Ochieng E , Tieszen L. L , Zhu Z , Singh A , co-authors . Status and distribution of mangrove forests of the world using earth observation satellite data. Glob. Ecol. Biogeogr. 2011; 20: 154–159.
- Golder D. G . Relations among stability parameters in the surface layer. BLM. 1972; 3: 47–58.
- Grace J , Malli Y , Higuchi N , Meir P , Roy J , Samgier B , Mooney H. A . Productivity of tropical forest. Terrestrial Global Productivity. 2001; San Diego: Academic press. 401–426.
- Heidam N. Z . Atmospheric aerosol factor models, mass and missing data. Atmos. Environ. 1982; 16: 1923–1931.
- Hutchings P , Saenger P . Ecology of Mangroves.
- International Geosphere–Biosphere Programme. Global Change. 2009; Sweden: Stockholm. 15.
- Lewis S. L , Lopwz- Gongalez G , Sonke B , Affum-Buffoe K , Baker R. T , co-authors. Increasing carbon storage in intact African tropical forests. Nature. 2009; 457: 1003–1006.
- Luo Y , Medline B , Hui D , Ellsworth D , Reynolds J , Katul G . Gross primary productivity in the duke forest: modeling synthesis of the free-air CO2 enrichment experiment and eddy-covariance measurements. Ecol. Appl. 2001; 11: 239–252.
- Luo Y , White L. W , Canadell J. G , DeLucia E. H , Ellsworth D. S , co-authors . Sustainability of terrestrial carbon sequestration: A case study in Duke Forest with inversion approach. Global Biogeochem. Cy. 2003; 17(1):
- Luo Z , Jianxin Sun O , Wang E , Ren H , Xu H . Modeling productivity in mangrove forests as impacted by effective soil water availability and its sensitivity to climate change using Biome-BGC. Ecosystems. 2010; 13: 949–965.
- Mandal S. K , Majumder N , Chowdhury C , Ganguly D , Dey M , co-authors . Adsorption kinetic control of As (III & V) mobilization and sequestration by Mangrove sediment. Environ. Earth. Sci. 2011; 65: 2027–2036.
- Masera O. R , Garza-Caligaris J. F , Kanninen M , Karjalainen T , Liski J , co-authors . Modeling carbon sequestration in afforestation, agroforestry and forest management projects: the CO2FIX V.2 approach. Ecol. Model. 2003; 64: 177–199.
- Mery G , Kanninen M , Palo M . Forest plantations and carbon sequestration in Chile. Forest Transitions and Carbon Fluxes, Global Scenarios and Policies. World Development Studies 15. 1999; World Institute for Development Economy Research (UNU/WIDER), Helsinki: United Nations University. 74–100.
- Miller P. C . Bioclimate, leaf temperature, and primary production in red mangrove canopies in south Florida. Ecology. 1972; 53: 22–45.
- Mukhopadhyay S. K , Biswas H , De T. K , Jana T. K . Fluxes of nutrients from the tropical River Hooghly at the land–ocean boundary of Sundarbans, NE Coast of Bay of Bengal, India. J. Mar. Syst. 2006; 62: 9–21.
- Mukhopadhyay S. K , Biswas H , De T. K , Sen B. K , Sen S , co-authors . Impact of Sundarban mangrove biosphere on the carbon dioxide and methane mixing ratios at the NE Coast of Bay of Bengal, India. Atmos. Environ. 2002; 36: 629–638.
- Norby R. J , Delucia E. H , Gielen B , Calfapietra C , Giardina C. P , co-authors A . Forest response to elevated CO2 is conserved across a broad range of productivity. Proc. Natl. Acad. Sci. USA. 2005; 102: 18052–18056.
- Norby R. J , Wullschleger S. D , Gunderson C. A , Johnson D. W , Ceulemans R . Tree responses to rising CO2 in field experiments: implications for the future forest. Plant. Cell. Environ. 1999; 22: 683–714.
- Phillips O. L , Malhi Y , Higuchi N , Laurance W. F , Nunez P. V , co-authors . Changes in the carbon balance of tropical forests: Evidence from long-term plots. Science. 1998; 282: 439–442.
- Pruppacher H. R , Klett J. D . Microphysics of Clouds and Precipitation. 1997; Kluwer Academic, Netherlands.
- Ray R , Ganguly D , Chowdhury C , Dey M , Das S , co-authors . Carbon sequestration and annual increase of carbon stock in a mangrove forest. Atmos. Environ. 2011; 45: 5016–5024.
- Rodhe H , Bjorkstrom A . Some consequence of non-proportionality between fluxes and reservoir contents in natural systems. Tellus. 1979; 31: 269–278.
- ScienceDaily. How Will Climate Change Affect India's Monsoon Season?. 2007. 7 March. Online at: www.sciencedaily.com/releases/2007/03/070308121808.htm .
- Sherman R. E , Fahey T. J , Martinez P . Spatial patterns of biomass and above ground net primary productivity in a mangrove ecosystem in the Dominican Republic. Ecosystems. 2003; 6: 384–398.
- Thompson S. L , Govindasamy B , Mirin A , Caldeira K , Delire C , co-authors . Quantifying the effects of CO2-fertilized vegetation on future global climate and carbon dynamics. Geophys. Res. Lett. 2004; 31(23): Art. No. L23211.
- Twilley R. R , Chem R. H , Hargis T . Carbon sinks in mangroves and their implications to carbon budget to tropical coastal ecosystem. Water, Air. Soil Pol. 1992; 54: 265–288.
- Urquiza- Haas T , Doiman P. M , Peres C. A . Regional scale variation in forest structure and biomass in the Yucatan Peninsula, Mexico; Effects of forest disturbance. For. Ecol Manag. 2007; 247: 80–90.
- Valentini R , Matteucci G , Dolman A. J , Schulze E. D , Rebmann C , co-authors . Respiration as the main determinant of carbon balance in European forests. Nature. 2000; 404: 861–865.
- Van der Nat F. J. W. A , Middelburg J. J . Methane emission from tidal freshwater marsh. Biogeochemistry. 2000; 49: 103–121.
- Wesely M. L , Hicks B. B . Some factors that affect the deposition rates of sulfur dioxide and similar gases on vegetation. JAPCA. 1977; 27: 1110–1116.
- White A , Cannell M. G. R , Friend A . CO2 stabilization, climate change and terrestrial carbon sink. Glob. Change. Biol. 2000; 6: 817–833.
- Wullschleger S. D , Post W. M , King A. W , Woodwell G. M , Mackenzie F. T . On the potential for a CO2 fertilization effect in forests – Estimates of the biotic growth factor based on 58 controlled-exposure studies. Biotic Feedbacks in the Global Climate System: Will Warming Feed the Warming?. 1995; Oxford University Press, USA. 85–107.
- Yong Y , Baipeng P , Guangcheng C , Yan C . Processes of organic carbon in mangrove ecosystem. Acta. Ecol. Sin. 2011; 31: 169–173.