ABSTRACT
This study focuses on the daily and seasonal variability of particle number size distributions and concentrations, performed at the Montseny (MSY) regional background station in the western Mediterranean from October 2010 to June 2011. Particle number concentrations at MSY were shown to be within range of various other sites across Europe reported in literature, but the seasonality of the particle number size distributions revealed significant differences. The Aitken mode is the dominant particle mode at MSY, with arithmetic mean concentrations of 1698 cm3, followed by the accumulation mode (877 cm−3) and the nucleation mode (246 cm−3). Concentrations showed a strong seasonal variability with large increases in particle number concentrations observed from the colder to warmer months. The modality of median size distributions was typically bimodal, except under polluted conditions when the size distribution was unimodal. During the colder months, the daily variation of particle number size distributions are strongly influenced by a diurnal breeze system, whereby the Aitken and accumulation modes vary similarly to PM1 and BC mass concentrations, with nocturnal minima and sharp day-time increases owing to the development of a diurnal mountain breeze. Under clean air conditions, high levels of nucleation and lower Aitken mode concentrations were measured, highlighting the importance of new particle formation as a source of particles in the absence of a significant condensation sink. During the warmer months, nucleation mode concentrations were observed to be relatively elevated both under polluted and clean conditions due to increased photochemical reactions, with enhanced subsequent growth owing to elevated concentrations of condensable organic vapours produced from biogenic volatile organic compounds, indicating that nucleation at MSY does not exclusively occur under clean air conditions. Finally, mixing of air masses between polluted and non-polluted boundary layer air, and brief changes in the air mass being sampled gave rise to unusual particle number size distributions, with specific cases of such behaviour discussed at length.
1. Introduction
The Western Mediterranean Basin (WMB) and Iberian Peninsula represent a very complex climate area owing to its geographical position. Its location between two large bodies of water, with Africa to the south and isolated from mainland Europe to the north, makes it considerably unique within Europe both climatologically and geographically. Atmospheric aerosols here are under the influence of both mesoscale and synoptic meteorology, being affected by marine aerosol, Saharan dust, regional pollution and long-range transport from mainland Europe. The variability of particle number size distributions in background sites throughout Europe has been well documented (Asmi et al., Citation2011), but the lack of similar studies at regional background (RB) sites in the WMB are noticeable by their absence. Previous studies performed in this area have described the variability of particulate matter (PM) (Pérez et al., Citation2008), the chemical speciation of PM (Cusack et al., Citation2012) and the aerosol optical properties of aerosols (Pandolfi et al., Citation2011). Sorribas et al. (Citation2011) published results on sub-micron particle size distributions for a rural background site in southern Spain, which was observed to be heavily influenced by marine, Saharan and continental air masses and, in some circumstances, emissions from a nearby industrial estate. However, the study of particle number concentration and size distributions in the RB of north-east (NE) Spain, until now, has been largely underdeveloped.
The impact of sub-micron aerosols in the atmosphere is of great interest for various reasons: sub-micron particles can penetrate as far as the alveoli in the lungs (Wichmann et al., Citation2000), and they have the ability to absorb and scatter light and act as cloud condensation nuclei (Charlson et al., Citation1987), thus affecting the Earth's radiation balance. Sub-micron aerosols may be emitted directly to the atmosphere or may be formed from gaseous precursors. Usually, cleaner atmospheres are favourable for new-particle formation processes. These pristine environments include: the Polar Regions (Wiedensohler et al., Citation1996), high altitude sites (Venzac et al., Citation2009), continental boreal forests (Kulmala et al., Citation1998) and remote areas (Birmili et al., Citation2001), among others. In the WMB, photochemical nucleation episodes are thought to be very relevant since they are observed even in highly polluted environments (Pey et al., Citation2008; Reche et al., Citation2011).
New particle formation (NPF) and subsequent growth is a current topic of great interest. It is widely accepted that two phases are involved in NPF: (1) the nucleation of an initial cluster and (2) subsequent activation of these clusters resulting in particle growth to a detectable size (Kulmala et al., Citation2000). The formation of these initial clusters is part of the main focus of investigation, with numerous candidates thought to play a role in NPF, such as H2O–H2SO4 (binary nucleation, Easter and Peters, Citation1994), H2O–H2SO4–NH3 nucleation (Eisele and McMurray, Citation1997), ‘nucleation of low vapour pressure organic compounds’ (O'Dowd et al., Citation2002), ‘ion-induced nucleation’ (Kim et al., Citation2002) and ‘activation of existing neutral and/or ion clusters’ (Kulmala et al., Citation2006). However, nucleation and subsequent growth are believed to be two separate processes, and species involved in initial nucleation may not be important for the growth of the nucleating clusters (Kulmala et al., Citation2004). There is increasing evidence to suggest that the condensation of organic vapours on the nucleating clusters play a pivotal role in particle growth. Such organic vapours include the oxidation products of biogenic emissions such as isoprene and terpenes (Allan et al., Citation2006; Laaksonen et al., Citation2008). Results shown in this work present unusual processes regarding ultrafine particles, especially nucleation mode particles that may be indicative of mixing of air masses whereby nucleation events with differing phases of particle formation and growth are sampled during the same day.
The objective of this article is to report the sub-micron particle number size distribution in the WMB RB at Montseny (MSY, NE Spain) with special focus on the aerosol formation and modification processes, and seasonal trends. Most studies on ultra-fine particle size distribution within Spain have focused on the urban environment (Rodriguez and Cuevas, Citation2007; Pey et al., Citation2008; Fernández-Camacho et al., Citation2010; Gómez-Moreno et al., Citation2011) and a rural background site in southern Spain frequently affected by local anthropogenic emissions (Sorribas et al., Citation2011), with relatively few focusing on the regional background environment. This article interprets the combination of a large range of aerosol parameters and properties and their influence on the particle size distribution. The objective is to determine the temporal variations of aerosols and aerosol size distribution occurring and the conditions and processes that govern these variations. Special attention is given to processes affecting the nucleation mode, where some peculiar processes have been observed to have taken place.
2. Methodology
2.1. Measurement site
From October 2010 to June 2011, simultaneous measurements of particle number and size distribution of sub-micron particles (85% data coverage based on hourly resolution), PM (92% data coverage) and Black Carbon (BC; 99% data coverage) mass concentrations, as well as gaseous pollutants (~98% data coverage) were carried out at a RB site at MSY (41°19′N, 02°21′E). The MSY station is located in the MSY natural park, 40 km to the N–NE of the Barcelona urban area, and 25 km from the Mediterranean coast. The station is located on the upper walls of a valley extending perpendicularly from the Catalan Pre-Coastal ranges, in a densely forested area known as La Castanya (720 m.a.s.l.). The station is situated relatively far from urban and industrial zones, but the region is generally densely populated and heavily industrialised, and local anthropogenic emissions can affect this site under specific meteorological conditions. Atmospheric dynamics and aerosol variability of aerosols at MSY has been described in detail by Pérez et al. (Citation2008), Pey et al. (Citation2008) and Seco et al. (Citation2011). The MSY station, located in the WMB RB, is a member of the ACTRIS network. The ACTRIS (Aerosols, Clouds, and Trace gases Research InfraStructure Network; formerly EUSAAR) project aims to provide a reliable and quality-controlled network of aerosol measurements across Europe and farther afield (Philippin et al., Citation2009). This project has harmonised and homogenised measurements of aerosol chemistry and physical and optical properties through the standardisation of protocols of instrument operation and maintenance, data submission and measurement procedures (Wiedensohler et al., Citation2012).
2.2. Measurements
Sub-micrometer particle number size distribution was measured using a mobility particle size spectrometer operated in the scanning mode. In the following article, we call the system a Scanning Mobility Particle Sizer (SMPS). The SMPS system comprises a differential mobility analyser (DMA) connected to a condensation particle counter (CPC, Model TSI 3772). The entire system was designed and manufactured in the framework of the EUSAAR project at the Leibniz Institute for Tropospheric Research (IfT) in Leipzig, Germany. The full specifications of the instrument, such as DMA dimensions, bipolar diffusion charger, and so on for the IFT-SMPS can be found in Wiedensohler et al. (Citation2012). An intercomparison was carried out on the SMPS system in 2010 at the World Calibration Centre for Physical Aerosol Research (WCCAP) at IfT. IfT has designed a calibration programme for aerosol instrument maintenance and comparison and the institute is endorsed by the WMO. The intercomparison found the SMPS at MSY to measure within 10% of the reference mobility size spectrometer for particles 20–200 nm (see Wiedensohler et al., Citation2012 for further details). In that same article, it was observed that measurement accuracy for particles <20 nm and >300 nm was less reliable than for particles 20–200 nm, and thus concentrations reported in this work for these size ranges could be more qualitative in nature rather than quantitative. Furthermore, it is important to note that diffusion loses were not calculated in this work which can affect accurate measurement of ultrafine particles. The SPMS system provided a complete particle number size distribution of the number of particles between 9 and 825 nm (N9–825), and completed one scan every 5 minutes. The aerosol is dried prior to sampling to maintain a relative humidity below 40% using a Nafion dryer, in line with EUSAAR/ACTRIS requirements. Aerosol inlet flow was maintained at 1 l/min and sheath airflow at 5 l/min (which was also dried in a system using a Nafion dryer in a closed loop).
Real-time measurements of PM1 mass concentrations were continuously obtained using a GRIMM optical counter (model 180). Hourly PM1 data provided by GRIMM were daily averaged and subsequently corrected by comparison with 24 hours gravimetric mass measurements of PM1 collected by high volume samplers (sampled consecutively every 4 d). The cross-section absorption coefficient was measured continuously using a Multi Angle Absorption Photometer (MAAP, model 5012, Thermo). Equivalent BC measurements provided by MAAP are calculated by the instrument software by dividing the measured absorption coefficient σap (λ) by 6.6 m2 g−1 which is the mass absorption cross section (MAC) at 637 nm (Müller et al., Citation2011). However, MAC may vary depending on the aerosol composition and age, and may differ depending on the area under study. In accordance with the findings of Pandolfi et al. (Citation2011), the absorption coefficient values measured at MSY provided by the MAAP were converted into BC mass/volume units by multiplying by a factor of 10.4 m2 g−1. Thus, BC results presented in this work are specifically Equivalent Black Carbon (EBC) as measurements are derived from optical methods.
The SMPS system and MAAP instruments were both connected to the same sampling line and inlet, with a cut-off diameter of 10 µm, placed at about 1.5 m above the roof of the cabin housing the instruments. The sampled aerosol for SMPS and MAAP was dried in the same sampling inlet before reaching the respective instruments. Humidity control of the sampled aerosol was performed by attaching a Nafion dryer to the sampling inlet. Real-time measurements of O3, NO, NO2, CO and SO2 were obtained on-site on a separate sampling inlet, supplied by the Department of the Environment of the Autonomous Government of Catalonia. Hourly levels of wind direction, wind speed, solar radiation, temperature, relative humidity and precipitation were recorded in real time on site. See Pérez et al. (Citation2008) for further details.
Measurements of sulphuric acid concentrations were not performed but a proxy, referred to as [H2SO4], was calculated according to the proxy described by Mikkonen et al. (Citation2011), whereby [H2SO4] is the product of SO2 concentrations and solar radiation, although the uncertainty associated with this simplified linear approach is somewhat higher than for non-linear proxies also described by Mikkonen et al. (Citation2011). The dry aerosol condensation sink was calculated as described by Kulmala et al. (Citation2001). Air mass back trajectory analysis was performed using HYSPLIT4 (Draxler and Rolph, 1998) for various altitudes, typically 750, 1500 and 2500 m.a.s.l., to determine air mass origins and to aid in establishing air mass mixing effects.
3. Results
3.1. Overview of aerosol concentrations
The measured particle number size distributions in this work are grouped in size bins, whereby the nucleation mode includes all particles of diameter between 9 and 20 nm, the Aitken mode includes particles of diameter 20–100 nm and finally the accumulation mode 100–825 nm. shows the time variability from 11 October 2010 to 6 June 2011 of the total arithmetic mean (coloured line) and median (black line) daily particle number concentration (N9–825) and the daily particle number concentration for the nucleation mode (N9–20), Aitken mode (N20–100) and accumulation mode (N100–825). The daily arithmetic mean particle number concentration for the measurement period was 2856 cm−3 (median of 2292 cm−3). The maximum daily value (9415 cm−3) was recorded in May and was associated with an intense burst of NPF. The minimum total particle number concentration (537 cm−3) occurred during a period of heavy rainfall.
Fig. 1. Time series of daily mean total particle number concentration (coloured lines), median concentrations (black lines) and particle number concentration for the nucleation, Aitken and accumulation modes from 11 October 2010 to 6 June 2011. Warm period (October, April to June) is shaded in green and cold period (November to March) in blue.
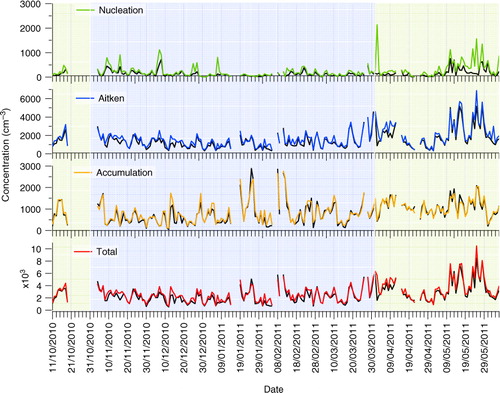
Nucleation mode particles typically registered the lowest concentrations during the study period with a mean hourly concentration of 246 cm−3 (8.7% of the total particle number concentration) and a median concentration of 98.8 cm−3. The large difference between the arithmetic mean and median concentrations can be attributed to nucleation events of short duration, whereby elevated concentrations of N9–20 occurring for only a few hours influence the arithmetic mean concentrations while having a lesser impact on the median value. This is evident in where the variation in the mean concentration of the nucleation mode in some instances differs significantly from that of median concentrations. Average concentrations of this mode increased significantly from April onwards, when the hourly mean concentration for April to early June increased to 352 cm−3 (). For the remaining time period (October to March inclusive), the time series for this mode is marked by relatively intense, short-lived peaks in concentrations, such as occurred on 7 January 2011 (daily mean concentration of 742 cm−3 and median of 128 cm−3). Some of these intense peaks are related to NPF episodes, when low levels of upper Aitken and accumulation mode particles were recorded.
Table 1. Arithmetic mean (n) and median concentrations (ñ) of the Total, N9–20, N20–100 and N100–825 mode particles recorded at Montseny (MSY) for the entire colder period (C) and warmer period (W), and under polluted and clean conditions for measurements from October 2010 to June 2011
The Aitken mode is the dominant particle mode throughout the year, with a mean concentration of 1698 cm−3 (59% of the total) and a median concentration of 1227 cm−3. Similar to that observed for nucleation mode particles, the mean concentration of Aitken mode particles increases significantly in April and May (2274 cm−3) compared to October to March (1414 cm−3). Thus, the majority of sub-micron particles at MSY are of diameter 20–100 nm. The average accumulation mode concentrations registered 877 cm−3 (31% of the total) and median concentrations of 742 cm−3. The accumulation mode bears some correlation with the upper Aitken mode (R2=0.57 for the study period, hourly resolution, 4850 points), as the sources of accumulation mode particles may not always be the same as those of Aitken mode particles (such as during Saharan dust events or increased levels of secondary inorganic particles when larger particles are dominant). The autocorrelation coefficient (whereby the correlation between the accumulation mode and the upper Aitken is shifted for one or more hours for one of the variables), gives R2 for x (t +1) of 0.47 and x (t+2) of 0.37. Hourly autocorrelations from here on will be referred to as R2 0 for x (t), R2 1 for x (t+1) and R2 2 for x (t+2).
Comparisons of particle number concentrations with various other sites across Europe show that levels in MSY fall in line with other RB sites. A study performed by Spracklen et al. (Citation2010) comparing particle number concentrations at various sites across Europe found mean levels at continental boundary layer sites to range from 2000 to 10 000 cm3, and mid-latitude coastal stations to be between 1000 cm−3 and 2000 cm−3, while Mace Head on the west coast of Ireland registered levels of 3000 cm−3. Asmi et al. (Citation2011) compiled particle number concentration data (for particles of diameter 30–500 nm) for various EUSAAR stations. Median concentrations in this range at MSY for the study period were 1764 cm−3, which is lower than the mean of all the median concentrations of all the stations included in the study by Asmi et al. (Citation2011; 2718 cm−3). Comparing results with those observed for other Mediterranean sites included in the study, levels at MSY are significantly lower than those measured at Finokalia in the eastern Mediterranean which registered median concentrations of 2344 cm−3, with most of this difference owing to elevated concentrations at Finokalia of N50–100. Similar concentrations were also measured in Aspvreten (1786 cm−3), which is a regional background station in Sweden surrounded by mixed coniferous and deciduous forest similarly to MSY, but is not typically influenced by anthropogenic activities, unlike MSY. The lack of complete summer measurements of particle number concentrations at MSY in this study, when photochemistry, soil resuspension and Saharan dust intrusions are most influential, means the annual particle number concentrations reported in this work are likely to be underestimated and thus, extended measurements including an entire year of data would make for better comparisons of the other EUSAAR/ACTRIS sites mentioned.
Concerning other stations in Spain, levels of particle number concentrations at a regional station on the southern Atlantic coast of Spain (Sorribas et al., Citation2011) recorded concentrations (for particles of diameter 14–673 nm) significantly higher than those at MSY (8660 cm−3). This significant increase compared to MSY can be attributed to the influence of anthropogenic aerosols on particle number concentrations emitted from an industrial site close to the monitoring station. A study by Venzac et al. (Citation2009) described in detail particle number concentrations and size distributions at the Puy de Dôme site. A strong diurnal and seasonal variability was observed at the site, attributed to the boundary layer height development during the day, reaching the height of the site during warmer months, which is a common occurrence at MSY.
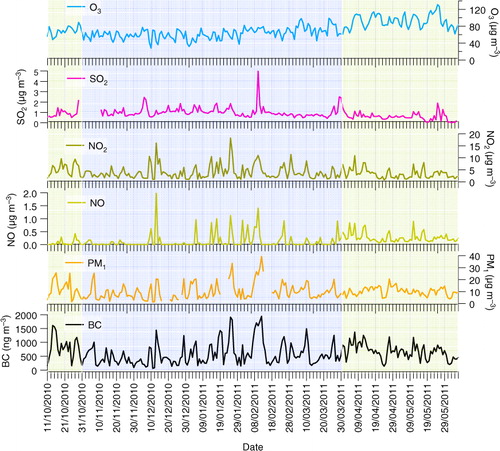
The time series of various other aerosol parameters measured simultaneously are shown in . Average daily BC mass concentrations at MSY for the measurement period were 616 ng m−3. BC was closely related to the accumulation mode (=0.84,
=0.72,
=0.54; hourly resolution, 4850 points), but was not correlated with the Aitken mode (R2=0.21), suggesting that BC at MSY exists mostly in the accumulation mode. BC and NO2 exhibited high correlation (
=0.69,
=0.64,
=0.41), indicating they are of the same source, most likely from traffic and biomass burning emissions. No correlation was observed for SO2 with other pollutants indicating sources of SO2 at MSY are not related to sources of the other parameters measured.
Fig. 2. Daily concentration levels for BC (ng m−3), PM1, SO2 and NO2, O3 and NO (µg m−3) from 11 October 2010 to 6 June 2011. Warm period (October, April to June) is shaded in green and cold period (November to March) in blue.
3.2. Particle number size distributions and seasonality at MSY
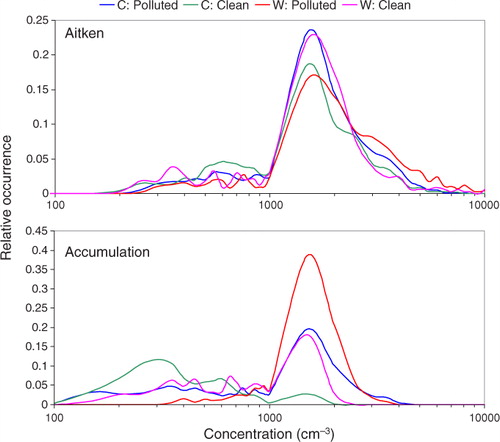
During this study, two periods were identified according to temperature features in the colder and warmer seasons. The first period includes all data recorded from November 2010 to March 2011, when temperatures (average 7°C) were considerably lower than the second period (average 15°C; October 2010, April–June 2011), and thus the periods were accordingly entitled Cold (C) and Warm (W). Furthermore, periods were subdivided according to episodes of pollution and clean air episodes. Episodes of pollution were categorised according to concentrations of BC, and include all days whereby hourly averaged BC concentrations exceeded 700 ng m−3. Clean episodes were classified similarly, and include all days whereby levels of BC hourly averages never exceeded 700 ng m−3. Thus, the colder period was subdivided into C: Polluted (67 d) and Clean (31 d). The same criteria were applied for the warmer period, giving W: Polluted (32 d) and Clean (13 d). These periods will hitherto be referred to as C: Polluted and C: Clean for the colder periods, and W: Polluted and W: Clean for the warmer period. and list the concentrations for various aerosol and meteorological parameters for each period. Analysis of 5-d back trajectories of air masses using HYSPLIT4 aided in verifying that air masses were likely to be clean or polluted. Of the 31 d classified as C: Clean, all were associated with Atlantic advection episodes or occurred after periods of heavy rainfall. The origins of air masses giving rise to episodes of elevated levels of pollution were more varied than under clean conditions. As mentioned previously, local pollution is carried to the site by a mountain breeze with low nocturnal concentrations when MSY resides above the polluted mixing layer. The influence of long-range transport as opposed to local pollution is more difficult to ascertain but is usually evident when elevated nocturnal levels of pollutants occur. The most influential air masses bringing aerosols to MSY are from mainland Europe and North Africa. Saharan dust intrusions from North Africa occurred on 7 d and were associated with high concentrations of PM10 and BC, both during the day and at night. Long-range transport from Europe can occur when a high pressure system builds north of the peninsular as far as the British Isles, and air from mainland Europe travels south. This scenario occurred on 7 d during the colder period and was marked by low temperatures and very high levels of fine PM and BC both during the day and at night. Clean episodes during the warmer period resulted from either air masses from the Atlantic or from the nearby Mediterranean arriving at MSY. During the warmer period, phases of pollution are typically a result of air mass recirculation across the region, creating a continuous increment in pollution levels until it is replaced by a cleaner air mass or removed by precipitation. An intrusion of a polluted air mass from mainland Europe occurred during W lasting for a period of 5 d, resulting in continuously high levels of BC and fine PM.
Table 2. Arithmetic mean and standard deviation for various aerosol parameters, pollutant gases and meteorological variables recorded at MSY for different periods throughout the measurement campaign
Concerning particle number concentrations, levels in all modes were considerably higher during W than those recorded during C. The ratios of W to C mean concentrations for the nucleation (N9–20), lower Aitken (N20–50), upper Aitken (N50–100) and accumulation (N100–825) modes are 1.8, 1.7, 1.6 and 1.4, respectively. Higher levels of upper Aitken and accumulation mode particles in W compared to C can be attributed to the residence of MSY within the mixing layer for longer periods during the day in warmer months and lower precipitation (Pérez et al., Citation2008). Higher number concentrations of nucleation and lower Aitken mode particles are likely a result of increased NPF and growth, which will be discussed anon. shows histograms for concentrations of N20–100 and N100–825 for the measurement period. The accumulation mode presents the greatest differences between each period, with very low concentrations during C: Clean, and highest concentrations during W: Polluted. Elevated concentrations of Aitken mode particles under W: Polluted are more frequent as evidenced by the wider histogram shape. However, Aitken mode concentrations are similar in all periods, even though the sources are likely to be very different depending on the scenario.
Fig. 3. Histogram of N20–100 and N100–825 hourly median concentrations at MSY for the different periods. The concentration bins are evenly distributed along the concentration axis (20 bins/decade) and the y-axis shows the occurrence of each bin relative to the total number of measurements.
The modality of median number size distributions under the different periods and scenarios was also investigated and are presented in . The fitted log-normal modes (dN/dlog10Dp) are also shown underneath each graph (in red). The modal fittings in all cases are performed for day-time size distributions, i.e. 8–20 hours GMT [median night-time size distribution modality (20–8 hours) is represented in each figure by the solid black line]. All scenarios except C: Polluted exhibit a bimodal size distribution. During polluted conditions in C, the size distribution is unimodal with a median diameter (Dpm) around 75 nm. Median size distributions for different seasons at a range of regional background sites across Europe were reported by Asmi et al. (Citation2011). Using the results presented in that article, winter size distributions under polluted conditions at MSY most closely reflect those given for central European stations, indicating that size distributions and concentrations at MSY under these conditions are very similar to continental size distributions. Comparatively, the median size distribution under clean conditions during C is distinctly bimodal, with a Dpm around 35 nm and a second mode with peak diameter around 150 nm, albeit with much lower concentrations. Interestingly, this modality is observed in winter at many of the high altitude sites reported by Asmi et al. (Citation2011), such as at Jungfraujoch (3580 m.a.s.l.). Thus, under clean conditions during the colder period, it appears that MSY bears some similarities with high or mid altitude sites.
Fig. 4. Median distributions for daytime (green lines), night-time (black lines) and modal fittings of daytime distribution (red lines) for periods C and W under polluted and clean conditions.
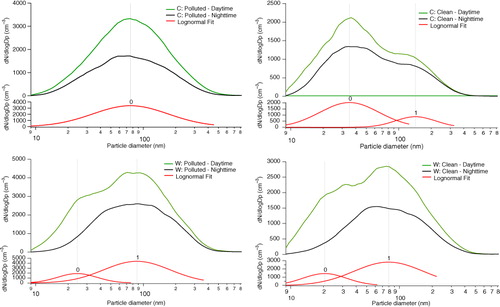
This bimodal behaviour is also evident during W, except the dominant modes in these cases are reversed when compared with C: Clean. The Aitken mode is dominant, with Dpm between 80 and 90 nm under both W: Clean and W: Polluted, with a secondary mode between 20 and 30 nm. Although the modality for both clean and polluted conditions is very similar, concentrations are substantially lower under cleaner conditions. Referring once again to results published by Asmi et al. (Citation2011), MSY displays similar spring time size distributions for the stations Bösel and Schauinsland in Germany. Bösel is a central European low altitude site situated among land mostly used for agriculture and some residential areas. Interestingly, springtime total particle number concentrations at MSY under clean conditions are similar to those reported for Schauinsland (Germany; 1210 m.a.s.l.), while under polluted conditions they are more similar to concentrations at Bösel.
3.2.1. Particle concentrations and variability during colder months.
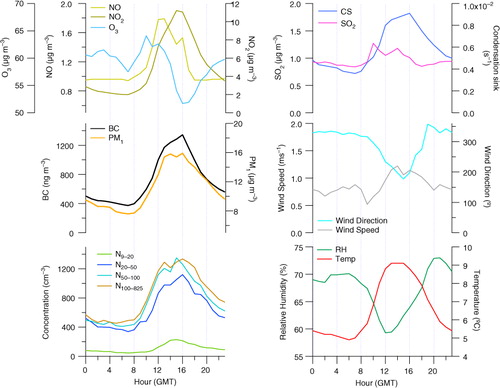
During the colder months, MSY undergoes sharp changes in pollutant concentrations, with daytime maxima and nocturnal minima for all pollutants, driven by the diurnal breeze system (Pérez et al., Citation2008; Pey et al., Citation2010) which advects pollutants from the semi-urban and urban areas at lower altitudes to the site during the day-time. Therefore, mixing effects between polluted and non-polluted boundary layer air masses can be very significant at this site. Aerosols accumulate in the valleys below MSY, and are transported towards elevated areas such as MSY during the day by the presence of mountain and sea breezes, activated by insolation (see wind speed and direction in ). The nocturnal north-west (NW) winds and daytime southerly wind scenarios are related to the topography of the valley wherein the MSY site is located. The polluted southerly breeze proceeds up the valley during the day, followed by a nocturnal drainage flow from the north, removing pollutants from the site. Night-time levels of BC (minimum 374 ng m−3) and PM1 (7.6 µg m−3) are relatively low, but undergo sharp increases during the day with maximum values being reached at 16:00 (1343 ng m−3 and 15.9 µg m−3, respectively). The mixed state of the particle sizes is highlighted by the similar concentrations for the upper Aitken and accumulation mode. Nucleation mode particle concentrations are low (median concentration of 92 cm−3) owing to the elevated condensation sink, which varies similarly to N20–825, highlighting the aged state of the air mass having stagnated within the mixing layer before reaching MSY. As stated previously, the median size distribution of particles under these conditions is clearly unimodal with a Dpm of 75 nm, both during the day and at night ().
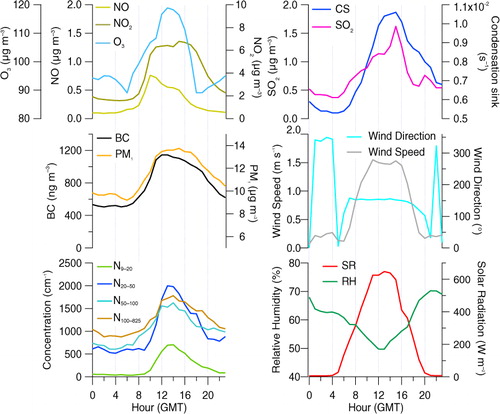
Fig. 5. Median diurnal variation of particle number concentrations of nucleation, lower Aitken, upper Aitken and accumulation mode particles (cm−3); mean concentrations of BC (ng m−3), PM1, NO, NO2, O3, SO2 (µg m−3); temperature (°C), relative humidity (%), wind speed (m s−1), wind direction (°) and condensation sink (s−1) during C: Polluted.
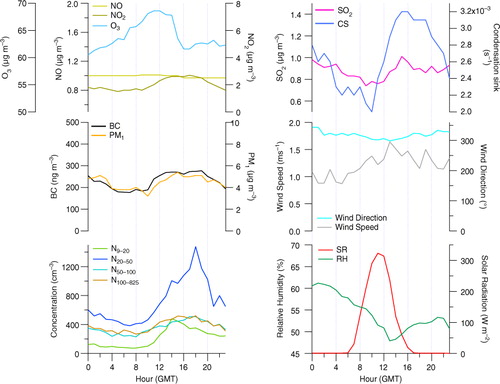
Conversely, shows the diurnal variations for almost the same parameters (temperature is replaced by solar radiation) under clean conditions during the colder months. The NW wind is maintained throughout the day with little change in wind direction and, thus, minimum influence of the polluted mountain breeze. Wind speeds are also slightly higher (1.47±1.2 m s−1) compared to polluted conditions (0.90±0.9 m s−1), especially during the day. The day and night variations are significantly reduced for many pollutants, with night-time minima of BC of 177 ng m−3 and day time maxima of 277 ng m−3. The absence of abundant pre-existing particles allows for NPF to take place, giving rise to higher concentrations of nucleation mode particles. This is evident in the overall reduced condensation sink (daily mean of 2.6×10⁻³ s−1) compared to polluted conditions (5.9×10⁻³ s−1). Kulmala et al. (Citation2005) reported condensation sink values for nucleation event days in Athens and Marseille to range between 5.9×10⁻³−1.3×10⁻² s−1 and 3.2×10⁻³−1.5×10⁻² s−1, respectively, which are in line with values recorded at MSY in winter. Furthermore, the condensation sink reaches a minimum precisely when the nucleation mode begins to increase at 10:00 GMT. Concerning particle number size concentrations, less variation is observed for the accumulation and upper Aitken mode particle number concentrations between night and day, similarly to BC and PM1. However, particle number concentrations of nucleation and lower Aitken mode particles are significantly increased and undergo a large diurnal variation unlike that of the other parameters measured. No correlation between either nucleation or lower Aitken and accumulation mode particle concentrations was observed (R2=0.006 and 0.03, respectively), giving a strong indication that NPF is occurring in-situ and not by transport. Growth to the Aitken mode is possible considering the loose correlation observed for nucleation and the lower Aitken mode (=0.44, hourly resolution, 671 data points), and this correlation actually improves slightly with
(0.48). Further growth from the lower Aitken to the upper Aitken mode is not as efficient (
=0.23). As solar radiation approaches maximum values between 10 and 11:00 GMT, nucleation particle concentrations begin to increase continuously to a maximum median concentration of 480 cm−3 at 14:00 GMT, as shown in . The continuous increase in lower Aitken mode concentrations reaches a maximum of 1475 cm−3 at 18:00 GMT. The diurnal profile for ozone under polluted conditions () is in stark contrast to that of ozone under clean conditions (). The absence of the polluted breeze loaded with NOx allows ozone concentrations to increase throughout the day. Ozone may be a limiting factor in the growth of nucleating particles under these conditions, as it is responsible for the formation of condensable organic species through reactions with VOCs (Hallquist et al., Citation2009). These condensable organic species are not believed to be directly involved in NPF but are believed to promote more rapid growth of nucleating clusters.
Fig. 6. Median diurnal variation of particle number concentrations of nucleation; lower Aitken, upper Aitken and accumulation mode particles (cm−3); mean concentrations of BC (ng m−3), PM1, NO, NO2, O3, SO2 (µg m−3); solar radiation (W m−2), relative humidity (%), wind speed (m s−1), wind direction (°) and condensation sink (s−1) during C: Clean.
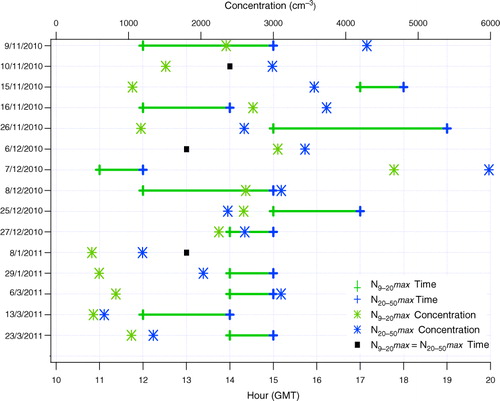
Out of a total of 31 d of clean conditions, 14 episodes of elevated nucleation mode particle concentrations were observed, as shown in . However, episodes with elevated concentrations of nucleation mode particles were observed to occur at different times of day. As outlines, for each date that elevated concentrations of nucleation mode particles occurred, the time (hour GMT) when maximum particle number concentrations of nucleation and lower Aitken mode was recorded for that respective day, and the particle number concentrations reached in those modes at that hour. This highlights how the occurrence of elevated nucleation particle number concentrations varies on different days. According to the classification of nucleation events outlined by Dal Maso et al. (Citation2005), not all of the episodes when elevated N9–20 were observed at MSY can be classified as nucleation events in the traditional sense. For example, elevated concentrations of nucleation mode particles recorded on 10 November 2010, 6 December 2010 and 8 January 2011 coincide with peak concentrations in the lower Aitken mode. In all three cases, a sharp increase was observed simultaneously for both nucleation and Aitken mode particle concentrations, suggesting that there is mixing of different air masses with differing aerosol processes occurring within the air mass. Similarly, days where nucleation mode concentrations are significantly lower than lower Aitken mode concentrations, and when peak concentrations occur quite late in the day such as on the 15 November 2010 and 26 November 2010, may be a result of transport of nucleating particles and accompanying growth particles, with some influence of mixing effects of air masses. Days of elevated nucleation mode particles when nucleation mode particle number concentrations are low are usually accompanied by low lower Aitken mode particle number concentrations, and are not especially intense bursts of NPF. Nucleation events in the traditional sense, displaying the typical banana profile associated with NPF and growth, occurred on the 9 November 2010, 7 December 2010, 8 December 2010, 25 December 2010 and the 27 December 2010.
Fig. 7. Days when elevated levels of N9–20 occurred during C: Clean; the hour (GMT) when maximum particle number concentrations are reached for nucleation (green) and lower Aitken (blue) mode and the respective particle number concentrations. Black dots indicate when peak N9–20 and N20–50 particle number concentrations occur at the same time.
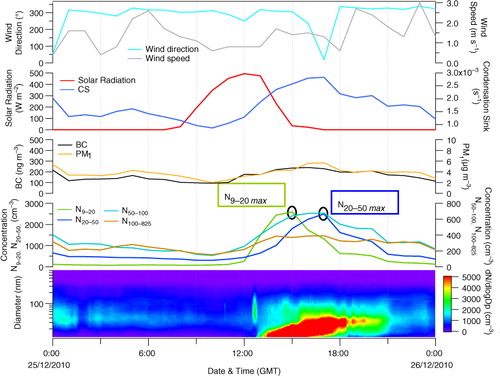
An example of a nucleation event that occurred on 25 December 2010 is shown in . NPF commences around 12:00 GMT, and nucleation mode particle number concentrations reach a maximum at 15:00 GMT. The lower Aitken mode continues to increase after the nucleation mode and reaches a maximum at 17:00 GMT, as the nucleation mode particles grow in diameter to Aitken mode particles. Upper Aitken and accumulation mode concentrations are comparatively much lower (note their concentrations are represented by the right axis), that is, the absence of larger particles allow NPF to take place. This is verified by the variation in the condensation sink, which varies similarly to the upper Aitken mode. SO2 concentrations, and thus [H2SO4], for this particular day were negligible and underwent little variation.
Fig. 8. Time series of a nucleation event recorded during C: Clean on 25 December 2010 showing the contour plot of the particle number size distribution, with median particle number concentration of nucleation and lower Aitken (left axis), and upper Aitken and accumulation mode (right axis) concentrations, PM1, BC, condensation sink and solar radiation, wind speed and wind direction.
Continuous particle number size distribution measurements in Northern Italy (Ispra) were performed from June to December 1999 by Rodríguez et al. (Citation2005). It was observed that nucleation events at the boundary layer site only occurred under clean air conditions. This also appears to be the case at MSY during the colder months, whereby nucleation tends to occur when clean-air conditions are prevalent.
3.2.2. Particle concentrations and variability during warmer months.
The diurnal variations of pollutants measured during the warmer period (W) present significant differences to the variation observed during C. During the day, wind speeds are slightly higher and the daytime southerly breeze is much more stable and longer in duration, owing to the higher temperatures. The effect of the mountain breeze on the aerosol parameters is evident during this period also, but the duration of the peaks in pollutant concentrations are extended compared to C, owing to the higher temperatures, increase in mixing layer height and the increase in wind speed during the warmer months.
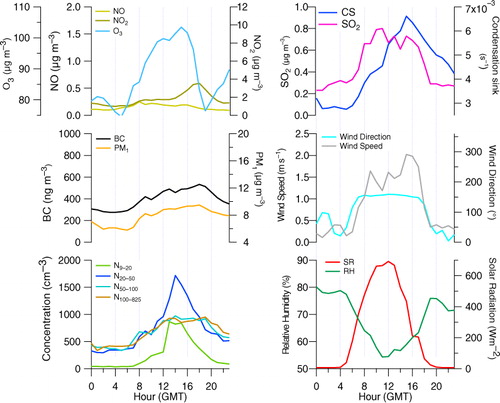
displays the diurnal trends for the same parameters presented in for W under polluted conditions. BC and PM1 concentrations are slightly elevated during the warmer months, with minimum night time concentrations for BC of 505 ng m−3 and PM1 concentrations at 9.2 µg m−3. Particle number concentrations are elevated for all modes compared to C. Upper Aitken and accumulation mode particles undergo similar diurnal variations as BC and PM1 mass concentrations. Ozone concentrations are elevated owing to more intense solar radiation and increased photochemical reactions of VOCs, irrespective of the NOx sink.
Fig. 9. Median diurnal variation of particle number concentrations of nucleation, lower Aitken, upper Aitken and accumulation mode particles (cm−3); mean concentrations of BC (ng m−3), PM1, NO, NO2, O3, SO2 (µg m−3); solar radiation (W m−2), relative humidity (%), wind speed (m s−1), wind direction (°) and condensation sink (s−1) during W: Polluted.
The diurnal variation of the nucleation and lower Aitken modes during the warmer period is unlike the variations observed for BC or PM1. The nucleation mode peaks at 14:00 GMT coinciding with peak solar radiation, and also with maximum lower Aitken mode particle number concentrations. Thus, nucleation mode particle number concentrations increase even in the presence of the polluted breeze and elevated levels of upper Aitken and accumulation mode particles, indicating that NPF may be taking place even in the presence of pre-existing particles, as highlighted by the increased levels of the condensation sink. As observed for the size distribution modality under these conditions, a secondary mode is observed near the nucleation mode (25 nm; ). Hamed et al. (Citation2007) also observed higher nucleation events during the warmer months at the boundary layer site in the Po valley in Italy even under polluted conditions. High particle growth and formation rates of the nucleation particles were recorded, as freshly nucleated particles need to grow quickly before being scavenged by pre-existing particles.
Owing to the heavy particle loading of the polluted air mass arriving at MSY, and the short residence time of nucleation mode particles (reported as a few hours in a roadside environment by Charron and Harrison, Citation2003), the elevated particle number concentrations of nucleation mode particles at MSY are evidently forming and growing faster than they can be removed. Biogenic emissions from local vegetation may be a significant source of condensable organic vapours at MSY. Although organic vapours are not believed to play a role in the initial formation of new particles, subsequent growth of nucleated clusters is considered to be enhanced by oxidation products of biogenic organic vapours such as terpenes (O'Dowd et al., Citation2002). An abundance of such biogenic compounds in the atmosphere might indeed promote the growth of nucleating clusters to a detectable size before the gaseous precursors are lost through coagulation and condensation processes. Seco et al. (Citation2011) reported VOC mixing ratios at the same site of MSY in summer and winter with the aim of determining the effect of biogenic emissions on VOC concentrations. It was reported that short-chain oxygenated VOCs and isoprenoids presented higher mixing ratios in summer, attributed to higher emissions by vegetation and increased photochemistry. This also resulted in higher ozone concentrations. The abundance of VOCs in the atmosphere during the warmer months most likely account for the increase in ultrafine particles observed. Furthermore, a study performed by Querol et al. (Citation1999) in a rural area in NE Spain found midday oxidation rates of SO2 to (the intermediate compound H2SO4 is a known nucleating agent) were seasonally dependent, with oxidation ratios ranging seasonally from <1% h−1 (winter) to 6% h−1 (summer). Thus, an abundance of H2SO4, VOCs and solar energy would likely enhance NPF and growth. displays an example of an episode with elevated levels of nucleation mode particles recorded on the 6 June 2011, a day with relatively elevated levels of pollutants.
Fig. 10. Time series of a nucleation event recorded during W: polluted on 6 June 2010, with the contour plot of the size distribution and median particle number concentrations of nucleation, lower Aitken (left axis), upper Aitken and accumulation modes (right axis), BC mass concentration, condensation sink, solar radiation, a proxy for [H2SO4], wind speed and wind direction.
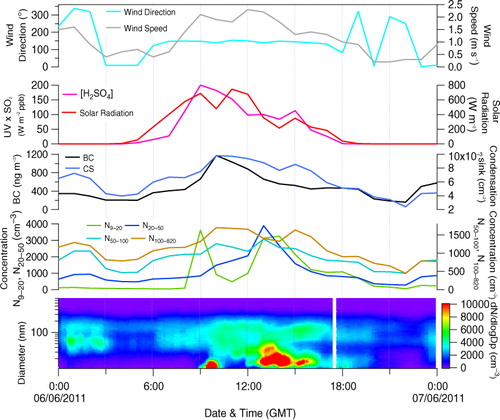
As is evident in , an intense burst of NPF occurs at 9:00 GMT, where nucleation is evidently activated by the peak observed for [H2SO4]. NPF is relatively short lived as it is interrupted by the increasing condensation sink and BC concentrations. A drop in solar radiation is also observed which may be due to a passing cloud or cloud formation on site. As BC and PM1 mass concentration levels begin to decrease as the morning progresses, the lower Aitken and nucleation mode begin to increase, peaking between 13:00 and 14:00 GMT. The lower Aitken mode decreases thereafter but unusually the nucleation mode concentrations are maintained for an hour after the lower Aitken mode decreases. There are various reasons that could explain this unusual behaviour. It is possible that a mixing event between different air masses occurred, whereby nucleation occurring in one of the air masses is replaced briefly by a more polluted air mass. Air mass back trajectory analysis showed a stable atmosphere for various altitudes throughout the day at MSY, but higher resolution analysis may prove that a mixing event is taking place. Thus, it could be suggested that (a) as background aerosol particle number and mass concentrations decrease, nucleation processes resume without further growth; (b) different parts of the air mass at different stages of a nucleation event are being sampled during the same day; (c) particles are actually evaporating from the lower Aitken mode to the nucleation mode. Particle evaporation, to the author's knowledge, has only been described in the urban environment of London (Dall'Osto et al., Citation2011) and Hong Kong (Yao et al., Citation2010). It was suggested that nanoparticle loss as a result of evaporation of the volatile/semi-volatile species caused this phenomenon. At MSY, episodes whereby a reversal of nucleated particle growth occurs in a ‘reverse banana’ profile occurred on 23 d during the entire measurement period. It is likely that these unusual processes are a result of mixing effects of air masses, but the possibility of particle evaporation cannot be ruled out. These findings are beyond the scope of this present work but will be further investigated in detail in future publications.
displays all the same variables for W under clean conditions. Mean particle number concentrations of nucleation mode particles are the same as under polluted conditions (345 cm−3), whereas Aitken and accumulation mode particle number concentrations are significantly lower than under polluted conditions. Peak concentrations of nucleation mode particles are slightly higher (866 cm−3) compared to polluted conditions (706 cm−3). Maximum BC and PM1 mass concentrations reach 532 ng m−3 and 9.5 µg m−3, respectively. BC is closely related to accumulation mode particle number concentration (=0.67,
=0.54,
=0.40; 336 data points) and undergo similar variations. The nucleation and lower Aitken modes undergo alternative variations independent of the other parameters. Nucleation mode concentrations begin to increase in the early morning with increasing solar radiation, to a maximum of 866 cm−3 at 13:00 GMT, followed by a peak in lower Aitken mode concentrations (1718 cm−3 at 14:00 GMT). The condensation sink under clean conditions is significantly lower than under polluted conditions, but this does not seem to affect the nucleation mode concentrations. SO2 concentrations also begin to increase around the same time as the nucleation mode. An input of sulphuric acid (produced from the oxidation of SO2), a summer abundance of condensable organic vapours from vegetative and anthropogenic sources, elevated ozone concentrations and intense solar radiation, would provide perfect conditions for NPF and growth.
Fig. 11. Median diurnal variation of particle number concentrations of nucleation, lower Aitken, upper Aitken and accumulation mode particles (cm−3); mean diurnal variation of BC (ng m−3), PM1, NO, NO2, O3, SO2 (µg m−3); solar radiation (W m−2), relative humidity (%), wind speed (m s−1), wind direction (°) and condensation sink (s−1) during W: Clean.
A measurement campaign performed at Monte Cimone from June to July was described by Van Dingenen et al. (Citation2005). The diurnal trends during the study show remarkable similarities to those observed at MSY during the warmer months. Monte Cimone (2165 m.a.s.l.) is located at a much higher altitude than MSY (720 m.a.s.l.), but BC mass concentrations undergo similar diurnal trends to those observed at MSY. The diurnal trend at Monte Cimone for BC is attributed to the transport of pollution by upslope winds induced by heating of the mountain side, similar to MSY. Furthermore, the morning increase of sub-micron particle number concentrations is noticeably similar to that observed at MSY. The authors suggest that the mixing of polluted boundary layer air with the clean free troposphere air provided favourable conditions for photochemically induced homogenous nucleation to occur in-situ. The example of a nucleation event shown in suggests that mixing of different air masses is similarly influential at MSY.
Fig. 12. Time series of a nucleation event recorded during W: Clean on 2 April 2011 with the contour plot of the size distribution and particle number concentration of nucleation, lower Aitken (left axis), upper Aitken and accumulation modes (right axis); PM1 and BC mass concentrations; condensation sink; a proxy for [H2SO4] concentrations, wind speed and wind direction.
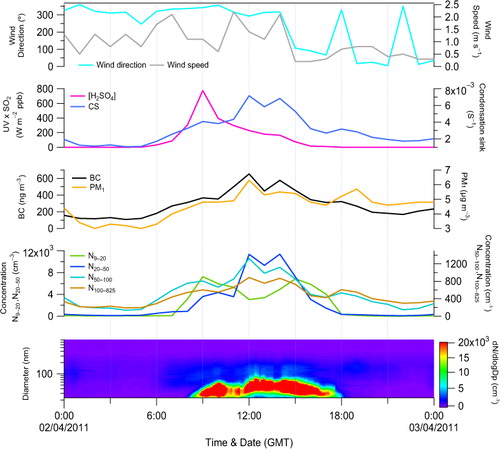
displays an example of NPF occurring at the beginning of April under clean conditions. Nucleation begins at 8:00 GMT and is followed by a rapid increase in concentrations relative to the lower Aitken mode. Peak concentrations of nucleation mode particles also coincide with peak [H2SO4] concentrations. Nucleation is interrupted as levels of BC and PM1 increase suddenly at 12:00 GMT and the condensation sink increases, removing the nucleating particles through condensation and coagulation. The coinciding double peak observed in BC and the Lower Aitken mode suggests that the two parameters are closely related, and also that an abrupt change in the air mass is occurring. The change in wind direction and speed which occurs at the same time when lower Aitken mode concentrations begin to decrease and nucleation mode particles peak suggests that a mixing event is being observed, whereby different phases of a nucleation event within the air mass are sampled during the same day. Air mass back trajectory analysis (using HYSPLIT) at different altitudes did not show any evidence of mixing. However, taking into consideration the change in wind direction, it would seem likely that a nucleation event is being observed over a large area, and the nucleating particles at different stages of formation and growth are being sampled as the day progresses. The nucleation mode reaches a daytime minimum between the hours of 12:00 and 13:00 GMT, when BC and PM1 are at their highest, that is, a polluted air mass has moved over MSY. The change in wind direction and coinciding drop in BC and particles>20 nm, suggest that the polluted air mass is quickly replaced by a cleaner air mass, within which a nucleation episode is occurring.
4. Summary and conclusions
Eight months of sub-micrometer particle number size distributions at the RB site of MSY have been analysed and described to determine their variability in the western Mediterranean. The Aitken mode was observed to be the dominant size mode in terms of particle number concentration, followed by the accumulation and nucleation modes. Furthermore, particle number concentrations showed a clear seasonal variability, with concentrations significantly elevated during warmer months relative to colder months. Owing to this seasonality observed, the dataset was divided according to temperature; a cold period (C: November to March) and a warm period (W: October, April to June). Furthermore, these periods were categorised according to scenarios of clean and polluted episodes. Under polluted conditions during C, the observed daily variability of the various particle properties was related to a diurnal breeze system activated by insolation. This scenario was characterised by low nocturnal number and mass concentrations of aerosols when MSY resided above the polluted mixing layer, with elevated daytime concentrations due to transport of pollutants to MSY carried by upslope winds. Particle number size distributions during C: Polluted were clearly unimodal, both during the day and at night, with a modal diameter around 75 nm. Conversely, the diurnal profile under clean conditions during C presented little day-to-night variation for almost all the pollutant parameters except for the nucleation mode and lower Aitken mode. The absence of pre-existing particles in the form of coarser particles, as evidenced by lower values of the condensation sink, allowed for NPF to take place. The nucleation mode began to increase coinciding with minimum levels of the condensation sink and maximum intensity of solar radiation. The particle size distribution is bi-modal, with a dominant mode peaking at 35 nm and a secondary mode at 150 nm. Nucleation mode concentrations were observed to undergo significant increases at different times of day and to varying degrees of intensity, and this was related to NPF events in some cases. In others, mixing events between polluted and non-polluted boundary layer air gave rise to short intense bursts of nucleation mode particles.
Diurnal particle number concentrations for all modes during W were observed to be significantly different to the diurnal profiles observed during C. The nucleation and lower Aitken modes concentrations exhibited the largest difference between W and C, although particle number concentrations in all modes were elevated. Bimodal size distributions were recorded for both W: Polluted and W: Clean, with modal diameters around 80–90 nm and 20–30 nm, although particle concentrations are reduced under W: Clean. Nucleation mode particle number concentrations were elevated even under polluted conditions and the presence of an elevated condensation sink. NPF under polluted conditions was believed to be able to occur due to (a) increased solar radiation promoting photochemical reactions, and (b) elevated concentrations of condensable organic vapours produced from the photochemical oxidation of secondary aerosol precursor gases and biogenic emissions. An abundance of such condensable organic vapours in the atmosphere might promote the growth of nucleating clusters to a detectable size even in a relatively polluted atmosphere. The diurnal profile for clean conditions during W differs significantly to that of C, specifically in that BC and PM1 mass concentrations are higher and underwent a larger day-to-night variation. NPF clearly occurred even in the presence of pre-existing particles capable of scavenging potentially nucleating gaseous precursors. Finally, mixing effects between polluted and non-polluted boundary layer was observed to be an influential process at MSY, whereby it was observed that different phases of nucleation and growth processes within the same air mass was occurring and sampled at different times of day at the site, giving rise to unusual size distributions.
Acknowledgments
This study was supported by the Ministry of Economy and Competitiveness and FEDER funds under the projects CARIATI (CGL2008-06294/CLI), VAMOS (CGL2010 19464/CLI) and GRACCIE (CSD 2007-00067), and from the Generalitat de Catalunya 2009 SGR8. The research leading to these results has received funding from the European Union Seventh Framework Programme (FP7/2007-2013) ACTRIS under grant agreement no. 262254. The authors would like to extend their gratitude to Jesús Parga and Jordi Gil for their technical support. The authors also thank METEOCAT for the meteorological data and the NOAA Air Resources Laboratory (ARL) for the provision of the HYSPLIT transport and dispersion model and/or READY website (http://www.arl.noaa.gov/ready.html) used in this publication. Finally, the authors thank Dr. Zhibin Wang for his essential input.
Related Research Data
References
- Allan, J. D, Alfarra, M. R, Bower, K. N, Coe, H, Jayne, J. T. and co-authors. 2006. Size and composition measurements of background aerosol and new particle growth in a Finnish forest during QUEST 2 using an Aerodyne aerosol mass spectrometer. Atmos. Chem. Phys. 6: 315–327. 10.3402/tellusb.v65i0.19243.
- Asmi, A, Wiedensohler, A, Laj, P, Fjaeraa, A.-M, Sellegri, K. and co-authors. 2011. Number size distributions and seasonality of submicron particles in Europe 2008–2009. Atmos. Chem. Phys. 11: 5505–5538. 10.3402/tellusb.v65i0.19243.
- Birmili W, Wiedensohler A, Heintzenberg J, Lehmann K. Atmospheric particle number size distribution in central Europe: statistical relations to air masses and meteorology. J. Geophys. Res. D. Atmos. 2001; 106: 32005–32018. 10.3402/tellusb.v65i0.19243.
- Charlson R. J, Lovelock J. E, Andreae M. O, Warren S. G. Oceanic phytoplankton, atmospheric sulphur, cloud albedo and climate. 1987; 326: 655–661. 10.3402/tellusb.v65i0.19243.
- Charron A, Harrison R. M. Primary particle formation from vehicle emissions during exhaust dilution in the roadside atmosphere. Nature. 2003; 37: 4109–4119. 10.3402/tellusb.v65i0.19243.
- Cusack M, Alastuey A, Pérez N, Pey J, Querol X. Trends of particulate matter (PM2.5) and chemical composition at a regional background site in the Western Mediterranean over the last nine years (2002–2010). Atmos. Environ. 2012; 12: 8341–8357. 10.3402/tellusb.v65i0.19243.
- Dal Maso, M, Kulmala, M, Riipinen, I, Wagner, R, Hussein, T. and co-authors. 2005. Formation and growth of fresh atmospheric aerosols: eight years of aerosol size distribution data from SMEAR II, Hyytiälä, Finland. Atmos. Chem. Phys. 10: 323–336.
- Dall'Osto, M, Thorpe, A, Beddows, D. C. S, Harrison, R. M, Barlow, J.F. and co-authors. 2011. Remarkable dynamics of nanoparticles in the urban atmosphere. Boreal. Environ. Res. 11: 6623–6637. 10.3402/tellusb.v65i0.19243.
- Draxler R. R, Hess G. D. An overview of the HYSPLIT_4 modelling system for trajectories, dispersion and deposition. Atmos. Chem. Phys. 1998; 47: 295–308.
- Easter R. C, Peters L. K. Binary homogenous nucleation: temperature and humidity fluctuations, nonlinearity and aspects of new particle production in the atmosphere. Aust. Meteor. Mag. 1994; 33: 775–784.
- Eisele F. L, McMurray P. H. Recent progress in understanding particle nucleation and growth. J. Appl. Meteorol. 1997; 352(1350): 191–200. 10.3402/tellusb.v65i0.19243.
- Fernández-Camacho, R, Rodríguez, S, De La Rosa, J, Sánchez De La Campa, A. M, Viana, M. and co-authors. 2010. Ultrafine particle formation in the inland sea breeze airflow in Southwest Europe. Philos. Trans. R. Soc. Lond. B. 19: 9615–9630. 10.3402/tellusb.v65i0.19243.
- Gómez-Moreno, F. J, Pujadas, M, Plaza, J, Rodríguez-Maroto, J. J, Martínez-Lozano, P. and co-authors. 2011. Influence of seasonal factors on the atmospheric particle number concentration and size distribution in Madrid. 18: 3169–3180. 10.3402/tellusb.v65i0.19243.
- Hallquist, M, Wenger, J. C, Baltensperger, U, Rudich, Y, Simpson, D. and co-authors. 2009. The formation, properties and impact of secondary organic aerosol: current and emerging issues. Atmos. Chem. Phys. 9: 5155–5236. 10.3402/tellusb.v65i0.19243.
- Hamed, A, Joutsensaari, J, Mikkonen, S, Sogacheva, L, Dal Maso, M. and co-authors. 2007. Nucleation and growth of new particles in Po valley, Italy. Atmos. Environ. 7: 355–376. 10.3402/tellusb.v65i0.19243.
- Kim C. S, Adachi M, Okuyama K, Seinfeld J. H. Effect of NO2 on particle formation in SO2/H2O/air mixtures by Ion-induced and homogenous nucleation. Atmos. Chem. Phys. 2002; 36: 941–952. 10.3402/tellusb.v65i0.19243.
- Kulmala, M, Dal Maso, M, Mäkelä, J. M, Pirjola, L, Väkevä, M. and co-authors. 2001. On the formation, growth and composition of nucleation mode particles. Atmos. Chem. Phys. 53B: 479–490.
- Kulmala, M, Laakso, L, Lehtinen, K. E. J, Riipenen, I, Dal Maso, M. and co-authors. 2004. Initial steps of aerosol growth. Aerosol. Sci. Tech. 4: 2553–2560. 10.3402/tellusb.v65i0.19243.
- Kulmala M, Lehtinen K. E. J, Laakso L, Mordas G, Hämeri K. On the existence of neutral atmospheric clusters. Tellus. 2005; 10: 79–87.
- Kulmala M, Lehtinen K. E. J, Laaksoonen A. Cluster activation theory as an explanation of the linear dependence between formation rate of 3 nm particles and sulphuric acid concentration. Atmos. Chem. Phys. 2006; 6: 787–793. 10.3402/tellusb.v65i0.19243.
- Kulmala M, Pirjola L, Mäkelä J. M. Stable sulphate clusters as a source of new atmospheric particles. Boreal. Environ. Res. 2000; 404: 66–69. 10.3402/tellusb.v65i0.19243.
- Kulmala M, Toivonen A, Mäkelä J. M, Laaksonen A. Analysis of the growth of nucleation mode particles observed in Boreal forest. Atmos. Chem. Phys. 1998; 50B: 449–462.
- Laaksonen, A, Kulmala, M, O'Dowd, C. D, Joutsensaari, J, Vaatovaara, P. and co-authors. 2008. The role of VOC oxidation products in continental new particle formation. Nature. 8: 2657–2665. 10.3402/tellusb.v65i0.19243.
- Mikkonen, S, Romakkaniemi, S, Smith, J. N, Korhonen, H, Petäjä, T. and co-authors. 2011. A statistical proxy for sulphuric acid concentration. Tellus. 11: 11319–11334. 10.3402/tellusb.v65i0.19243.
- Müller, T, Henzing, J. S, de Leeuw, G, Wiedensohler, A, Alastuey, A. and co-authors. 2011. Characterization and intercomparison of aerosol absorption photometers: result of two intercomparison workshops. Atmos. Chem. Phys. 4: 245–268. 10.3402/tellusb.v65i0.19243.
- O'Dowd C. D, Aalto P, Hämeri K, Kulmala M, Hoffman T. Aerosol formation: atmospheric particles from organic vapours. Atmos. Chem. Phys. 2002; 416: 497–498. 10.3402/tellusb.v65i0.19243.
- Pandolfi M, Cusack M, Alastuey A, Querol X. Variability of aerosol optical properties in the Western Mediterranean Basin. Atmos. Meas. Tech. 2011; 11: 8189–8203. 10.3402/tellusb.v65i0.19243.
- Pérez, N, Pey, J, Castillo, S, Viana, M, Alastuey, A. and co-authors. 2008. Interpretation of the variability of levels of regional background aerosols in the Western Mediterranean. Nature. 407: 527–540. 10.3402/tellusb.v65i0.19243.
- Pey, J, Pérez, N, Querol, X, Alastuey, A, Cusack, M. and co-authors. 2010. Intense winter pollution episodes affecting the Western Mediterranean. Atmos. Chem. Phys. 408: 1951–1959. 10.3402/tellusb.v65i0.19243.
- Pey, J, Rodríguez, S, Querol, X, Alastuey, A, Moreno, T. and co-authors. 2008. Variability of urban aerosols in the Western Mediterranean. Sci. Total. Environ. 40: 9052–9062. 10.3402/tellusb.v65i0.19243.
- Philippin, S, Laj, P, Putaud, J. P, Wiedensohler, A, de Leeuw, G. and co-authors. 2009. EUSAAR – an unprecedented network of aerosol observation in Europe. Sci. Total. Environ. 24: 78–83.
- Querol, X, Alastuey, A, Lopez-Soler, A, Plana, F, Puicercus, J. A. and co-authors. 1999. Daily evolution of sulphate aerosols in a rural area, northeastern Spain – elucidation of an atmospheric reservoir effect. Atmos. Environ. 105: 397–407. 10.3402/tellusb.v65i0.19243.
- Reche, C, Viana, M, Moreno, T, Querol, X, Alastuey, A. and co-authors. 2011. Peculiarities in atmospheric particle number and size-resolved speciation in an urban area in the western Mediterranean: results from the DAURE campaign. J. Aerosol. Res. 45: 5282–5293. 10.3402/tellusb.v65i0.19243.
- Rodriguez S, Cuevas E. The contributions of “minimum primary emissions” and “new particle formation enhancements” to the particle number concentration in urban air. Environ. Pollut. 2007; 12: 1207–2119. 10.3402/tellusb.v65i0.19243.
- Rodríguez S, Van Dingenen R, Putaud J. P, Martins-Dos Santos S, Roselli D. Nucleation and growth of new particles in the rural atmosphere of Northern Italy – relationship to air quality monitoring. Atmos. Environ. 2005; 39: 6734–6746. 10.3402/tellusb.v65i0.19243.
- Seco, R, Peñuelas, J, Filella, I, Llusià, J, Molowny-Horas, R. and co-authors. 2011. Contrasting winter and summer VOC mixing rations at a forest site in the Western Mediterranean Basin: the effect of local biogenic emissions. J. Aerosol. Sci. 11: 13161–13179. 10.3402/tellusb.v65i0.19243.
- Sorribas, M, de la Morena, B. A, Wehner, B, Lòpez, J. F, Prats, N. and co-authors. 2011. On the sub-micron aerosol size distribution in a coastal – rural site at El Arenosillo Station (SW–Spain). 11: 11185–11206. 10.3402/tellusb.v65i0.19243.
- Spracklen, D. V, Carslaw, K. S, Merikanto, J, Mann, G. W, Reddington, C. L. and co-authors. 2010. Explaining global surface aerosol number concentrations in terms of primary emissions and particle formation. Atmos. Environ. 10: 4775–4793. 10.3402/tellusb.v65i0.19243.
- Van Dingenen R, Putaud J.-P, Martins-Dos Santos S, Raes F. Physical aerosol properties and their relation to air mass origin at Monte Cimone (Italy) during the first MINATROC campaign. Atmos. Chem. Phys. 2005; 5: 2203–2226. 10.3402/tellusb.v65i0.19243.
- Venzac H, Sellegri K, Villani P, Picard D, Laj P. Seasonal variation of aerosol size distributions in the free troposphere and residual layer at the puy de Dôme station, France. Atmos. Chem. Phys. 2009; 9: 1465–1478. 10.3402/tellusb.v65i0.19243.
- Wichmann H.-E, Peters A. Epidemiological evidence of the effects of ultrafine particle exposure. Atmos. Chem. Phys. 2000; 358: 2751–2769. 10.3402/tellusb.v65i0.19243.
- Wiedensohler, A, Covert, D. S, Swietlicki, E, Aalto, P, Heintzenberg, J. and co-authors. 1996. Occurrence of an ultrafine particle mode less than 20 nm in diameter in the marine boundary layer during Arctic summer and autumn. Atmos. Chem. Phys. 48B: 213–222.
- Wiedensohler, A, Birmili, W, Nowak, A, Sonntag, A, Weinhold, K. and co-authors. 2012. Mobility particle size spectrometers: harmonization of technical standards and data structure to facilitate high quality long-term observations of atmospheric particle number size distributions. Atmos. Chem. Phys. 5: 657–685. 10.3402/tellusb.v65i0.19243.
- Yao, X, Choi, M. Y, Lau, N. T, Lau A. P. S, Chan, C. K. and co-authors. 2010. Growth and shrinkage of new particles in the atmosphere in Hong Kong. Philos. Trans. R. Soc. A. Math. Phys. Eng. Sci. 44: 639–650. 10.3402/tellusb.v65i0.19243.