ABSTRACT
Carbon dioxide (CO2) emissions and sinks in western China are estimated and implied from atmospheric CO2 measured at Waliguan during the period of 1995–2008. The observed CO2 data are first classified as background, elevated, and sequestration, using a modified background identification method. Comparing it with two other methods tests the applicability of the method. By using this method, approximately 17.2%±1.2% and 10.1%±0.8% of all observed data are identified as elevated and sequestered CO2, respectively, the percentages (occurrence rates) for both of which increased during 1995–2008. CO2 emissions in western China have enhanced significantly in all seasons during the past 14 yr. Annual mean growth rates of CO2 emissions in the region increased by ~8.4 Tg C yr−1 (3.9% yr−1) during 1995–2008 but accelerated after 2000 to ~12.6 TgC yr−1 (6.2% yr−1). The growth rates of CO2 emission in western China are lower than the rest of the country. The annual mean emissions in the country during 1995–1999 and 2000–2006 are thought to be approximately 5.5 and 6.5 times higher than in western China, respectively. However, the growth rates of CO2 emissions in western China are higher than global increase rates as reported by other studies. CO2 sinks in western China varied from 86.0 Tg C yr−1 in early 1995–1999 to 106.2 Tg C yr−1 in 2005–2008. The most prominent change occurs in summer, indicating enhanced sequestration of photosynthetic CO2 taken up by vegetation. The growth rates in sequestered CO2 cannot keep up with the increase of CO2 emissions in the region. If this continues, it could potentially impact on the global carbon budget.
1. Introduction
Determining the impact of regional carbon dioxide (CO2) exchanges on the global carbon budget is an essential step towards understanding and managing the budget. With rapid economic development, reported growth of CO2 released from fossil fuel combustion and cement manufacturing over the 2001–2006 period has been dominant in developing countries, with 54% of the global increase in CO2 emissions coming from China alone (Raupach et al., Citation2007). China has become the largest national source of CO2 emissions during recent years (Gregg et al., Citation2008; Peters et al., Citation2012). On the basis of two publicly official energy data sets for China for 1997–2010, CO2 emissions have been calculated with a 1.4 Gt emission gap in 2010 between national and provincial statistics (Guan et al., Citation2012). Such an uncertainty of CO2 emissions would result in an incorrect understanding and modelling of the global carbon cycle. Since 2000, China has implemented a national strategy to develop western regions and as a consequence, economic sectors that use petroleum have also been rapidly expanding. Therefore, a question arises of how CO2 emissions over a regional as well as national scale change or are influenced under such a policy. In order to answer this question, there is a need to reduce the uncertainty in estimating regional and national emissions and to learn the extent to which the regional changes impact the global carbon budget.
The vegetation of Asia includes a broad range of temperate and boreal forests, grassland, and desert, and is perhaps one of the critical and sensitive regions in the global climate system. Several studies have reported that the carbon budget in China is primarily driven by land-use changes inferred by inventory and satellite data along with model simulations (e.g. Fang et al., Citation2001, Citation2004; Lal, Citation2004; Huang and Sun, Citation2006; Piao et al., Citation2007, Citation2009; Mu et al., Citation2008; Ren et al., 2011, Citation2012; Tian et al., Citation2011a, Citation2011b; Lu et al., Citation2012). Large-scale reforestation and afforestation programs conducted in western China since the 1980s have been studied as being a main cause of regional carbon sinks (Fang et al., Citation2001). Consequently, the balance of CO2 budget in China is a large issue under the situation of high anthropogenic emissions and land use changes (Tian et al., Citation2011a).
Globally, CO2 flux shows large discrepancies in different continents and regions (Sarmiento et al., Citation2010) with a significant imbalance in the global budget due to the lack of regional flux investigations (Turnbull et al., Citation2011), including uncertainties in anthropogenic emission estimates (Francey et al., Citation2010). The estimated trends of CO2 emissions and sinks possess a high degree of uncertainty in different continental areas based on top-down and/or bottom-up methods (e.g. Francey et al., Citation1995; Fan et al., Citation1998; Bousquet et al., Citation1999, Citation2000; Pacala et al., Citation2001; Gurney et al., Citation2002; House et al., Citation2003; Maksyutov et al., Citation2003; Peylin et al., Citation2005; Ballantyne et al., Citation2012). To some extent, the uncertainties are confined to limited long-term observed data over regional scale.
Measurements of atmospheric CO2 can reflect the information on the local/regional anthropogenic and natural perturbation. This uneven distribution of sources/sinks usually causes large spatial and temporal CO2 variations (Tans et al., Citation1996). Fortunately, we can track the differences in fossil fuel carbon exchanges as well as the terrestrial CO2 fluxes of different regions. In China, the longest observational record of atmospheric CO2 has been obtained from remote Waliguan since the 1990s (Zhou et al., Citation2003). Based on these data obtained in earlier years, the seasonality, secular trend, annual cycle, and inter-annual variability of atmospheric CO2 have been presented and characterized (Zhou et al., Citation2003, Citation2005, Citation2006). For example, Zhou et al. (Citation2003) discussed the background characteristics after filtering the episodes by using a meteorology method. Afterwards, a few field campaigns or research experiments at various remote and urban sites in China were conducted in the past few decades (e.g. Wang et al., Citation2002; Zhang et al., Citation2008; Liu et al., Citation2009; Wang et al., Citation2010). Most of these studies mainly focused on the levels, seasonality and spatial variation at urban or suburban sites. In this study, we will estimate and imply changes of CO2 emissions and sinks in western China from the episodes of atmospheric CO2 measured at Waliguan over 1995–2008. The primary objective is to provide a basic understanding of regional/local impacts on the changes of CO2 emissions and sinks under the situation of high anthropogenic emissions and land use changes in western China. The observed data are first classified as background, elevated, and sequestered CO2 using a modified background identification method. Comparing it with other methods tested the applicability of the method. CO2 emissions and sinks are estimated from the selected elevated and sequestered CO2 episodes. Finally, the changes of CO2 emissions and sinks in western China are inferred.
2. Data and methods
2.1. Data
The CO2 data are from the long-term continuous retrievals of atmospheric CO2 mixing ratios by a Licor6251 non-dispersive infrared NDIR analyzer at Waliguan (36.28N, 100.90E, 3816 m a.s.l.) since November 1994. Both CO2 regional sources and sinks information observed at Waliguan represent a relatively large-scale area due to the high altitude and extensive topography within the region. Therefore, measurements from the site can provide essential information on sources and sinks within the Eurasian continent (Zhou et al., Citation2005, Citation2006). A detailed discussion of the site, measurements, and calibrations for the system has been addressed in previous studies (Wen et al., Citation1997; Zhou et al., Citation2003). The data have also been updated and reported on the WMO X2007 scale (http://ds.data.jma.go.jp/gmd/wdcgg/products/summary/sum34/43_calibration.pdf). The data retrieval period in this study is 1995–2008. The overall CO2 time series had data gaps from June 1997 to November 1998 due to reconstruction of the Waliguan main building. In addition, some data was missing in the winter of 2001 and invalidated during June 2006–February 2007 which was due to calibration and instrumental malfunction (e.g. leakage of the inlet line connected to cryo-coolers).
2.2. Data selection
2.2.1. Data selection method.
A remote location regarded as having no local or regional source/sink influences is usually selected for measuring background conditions. However, within the planetary boundary layer (PBL), a ground-based station like Waliguan is exposed to a wide variety of situations, including air, which is locally or regionally influenced. The observed episodes of anomalous signals presented in the time series could reflect changes of regional emissions and sinks. The objective of selecting the data is to identify those hourly CO2 values that are representative of well-mixed air at the latitude of Waliguan as well as those of which that are affected by some known local/regional phenomenon.
Using an appropriate filter method to distinguish the different conditions is the first step. Data selection can be based on independently measured parameters, such as wind speed and direction, or by using a statistical approach for rejecting certain data, or combined meteorological and statistical filters. The basic assumption is that the concentration of CO2 in well-mixed air should change by only a small amount over several hours at extremely remote monitoring sites, such as the South Pole, Antarctica, where the hour-to-hour variability is very small (<0.1 ppm, Gillette et al., Citation1987).
Thoning et al. (Citation1989) also used this assumption to identify CO2 background conditions at Mauna Loa, but because Mauna Loa is not as remote as the south pole, they used a larger criteria for the initial selection process: instability of the CO2 concentration>0.2 ppm within 1 hour and changes in the CO2 concentration>0.25 ppm from 1 hour to the next were rejected. Any effects from volcanic episodes in the diurnal variation that typically occurred (11:00–19:00 LT) were temporarily removed. Finally, they applied an iterative statistical approach of a smooth spline curve to weighted daily averaged CO2 values, and flagged hourly data greater than two standard deviations from the daily average.
This method assumes that the background signal varies very slowly relative to contributions of the regional signal; these assumptions are suitable to Waliguan where the variation of the baseline signal is in the order of weeks while the regional signal varies from hourly to daily. Thus, we also apply the Thoning method to Waliguan data, without the step of removing diurnal cycle influence due to no existing volcanic episodes as well as insignificant terrestrial biospheric fluxes around the site. By using the Thoning method, approximately 40% of all observed CO2 data are selected as background data. However, according to Zhou et al. (Citation2003), they obtained almost 70% of all the background data by using meteorology as a filter. Therefore, we make modifications based on the Thoning method.
The Licor6251 NDIR system is similar to the instrument at Mauna Loa and is used to measure CO2 at Waliguan. The measurement errors are expected to be random and the overall measurement precision for the instrument is less than 0.1 ppm as determined from the standard deviation of repeated measurements of an approximately 365 ppm standard gas (Zhou et al., Citation2003). The variability within an hour test is also applied – if CO2 hourly means with standard deviations >0.3 ppm are initially removed to distinguish the visible instrument fluctuation. Similar to the Thoning method, changes in the CO2 concentration>0.3 ppm from one hour to the next were rejected.
Waliguan is located at the edge of the northeastern part of the Tibetan Plateau (high altitude). The area surrounding the site is pristine, with sparse vegetation consisting mostly of arid and semiarid grassland and the diurnal variation is relatively small (Zhou et al., Citation2003). Large variabilities are usually observed at Waliguan due to external polluted air parcels undergoing long distance air transportation during short time periods (e.g. 3–5 d). This causes either an increase or decrease of CO2 concentrations that can last anywhere from hours to several days.
Consequently, although the differences in the two consecutive hourly values are insignificant (<0.3 ppm) during the periods, they are actually non-background values. If they are not rejected at this step, they would affect the curve fit. In order to alleviate these problems, our method for this final selection was to temporarily remove 30% of the data, which are statistically calculated as maximum or minimum values by evaluating two weeks of hourly data at a time. A two-week work window is chosen because the data observed during this short period could potentially include both polluted/sequestered episodes and baseline information, but not be influenced by long-term trends or seasonality. The remaining data over the two weeks are then smoothed using an approach of moving an average curve fit where the first hourly concentration of the two weeks, which differed from the average of the curve by more than twice the standard deviation (σ) of the two weeks, were flagged as a non-background value. This is identified as pollution or sequestration according to whether or not this value is larger than the average of the curve. The process then moves to test the second hourly value in another 2-week period. At this point, those values with changes>0.3 ppm in two consecutive hourly concentrations and 30% hourly values previously removed at the beginning of the selection were added if they are now within 2σ of the spline. Daily, monthly and annual means are calculated from the final selected data.
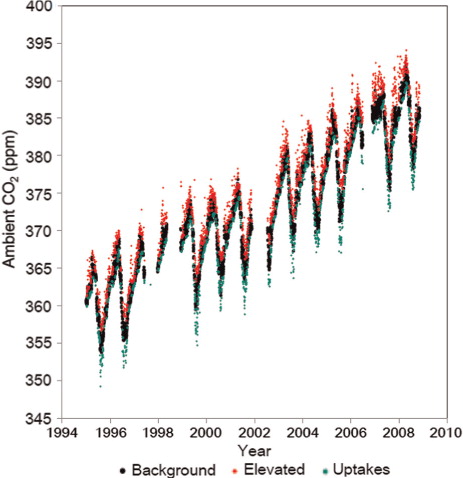
The time series of CO2 identified by our modified method is shown in . More than 70% of all observed CO2 has been selected as background data. Elevated CO2 mixing ratios represent contaminations from local or regional emissions/sources. They were observed with some episodes (red dots) distributed above the background levels (black dots). Back-trajectories for the specific periods of high CO2 have correlated these polluted episodes to regions with large emission sources (Zhang et al., Citation2011) that are especially active in the winter/early spring season. CO2 with relatively low values correspond to sequestrations primarily due to enhanced photosynthetic effects (green dots).
Fig. 1. Time series of CO2 measurements between 1995 and 2008 at Waliguan identified by our modified data selection method.
2.2.2. Applicability of the method.
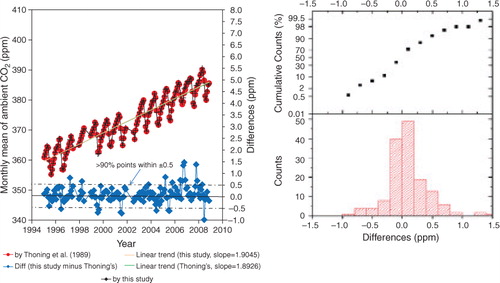
To examine the applicability of our modified method for the identification of CO2 background conditions, overall long-term changes of CO2 monthly means identified by the Thoning method and our modified method at Waliguan during 1995–2008 are shown in . The monthly means obtained from the Thoning method and our modified approach are without significant differences, with more than 90% of all points within ±0.5 ppm, 85% points within ±0.25 ppm and about 70% points closer to zero from the CDF and histogram of the differences embedded in the top and left panel of . The linear trends of the monthly means for the methods are very similar with slopes of 1.9045 and 1.8926 by our method as well as the Thoning method.
Fig. 2. Overall long-term changes of CO2 monthly means from continuous measurements identified by Thoning et al. (2003) (red dots) and by this study (black crosses) at Waliguan during 1995–2008, and the linear trends of the monthly means for the two methods are very similar with slopes of 1.9045 and 1.8926, respectively. The differences between the Thoning method and our method (blue dots) are also shown on the left y-axis. A histogram and probability of the differences, which showed more than 90% of all points are within ±0.5 ppm, are embedded in the top and left panel of the figure.
To further investigate how different selection methods can affect the CO2 seasonality over long-term periods, we compared the results identified by using the method of Thoning et al. (Citation1989) and Zhou et al. (Citation2003) with this study (). Zhou et al. (Citation2003) applied a combined statistical and meteorological parameter as a filter to select CO2 data at Waliguan. However, their method removes the hourly CO2 values associated with the wind direction from polluted wind sectors (e.g. air masses from northeastern and north in summer) as well as CO2 hourly values during calm conditions, during periods with horizontal wind speed >10 m/s, or vertical wind speed>±1 m/s. Finally, they used an iterative approach by a fitting curve (weighted least squares) for each day using criteria involving the differences for each remaining hourly points and curve >3σ to further smooth the data.
Fig. 3. Mean CO2 seasonality identified by Thoning et al. (2003) (red circle), Zhou et al. Citation2003 (blue circle) and this study (black circle) during 1994–2000. The differences of seasonal trends between the method by the other's method and our method are also plotted below.
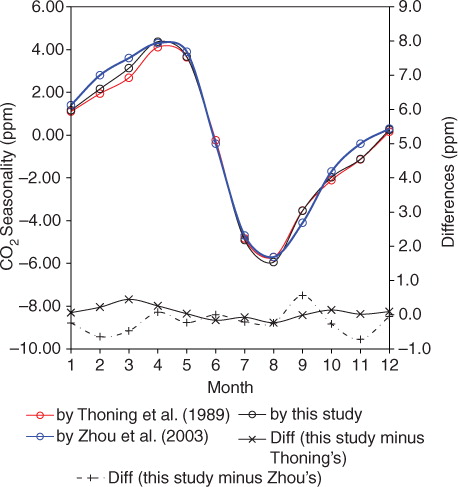
In , the overall characteristic of the CO2 seasonal cycle identified by the three methods did not exhibit a large difference in that the CO2 seasonality showed an early spring (in April) maximum and late summer (in August) minimum. The differences between our modified method and the Thoning method are almost close to zero in all months whereas the discrepancy between our method and the Zhou method is more apparent. The largest differences always appear in cold months, such as February or March, where the CO2 concentrations calculated by the Zhou method are approximately 0.5–0.8 ppm higher than our modified method. CO2 concentrations in these months obtained by the Thoning method are only slightly lower than that identified by our method. However, all three methods observed seasonal amplitudes of 10 ppm. lists the annual means of CO2 calculated from the hourly values as identified by the three methods.
Table 1. Annual means of CO2 calculated from the hourly data identified by the three methods
The differences in the annual means between the Thoning method and our modified approach changed from approximately −0.1 ppm to 0.1 ppm over the period of 1995–2008 while the discrepancies with Zhou's method are also within ±0.1 ppm. This small bias indicates that our modified method is ideal, not only because it is resistant to year-to-year and seasonal variations of ambient CO2 during long-term periods, but also due to more data being retained for the background conditions. In addition, the modified method is more efficient compared to Zhou et al. (Citation2003) for which they also needed to take into account more meteorological conditions. Consequently, elevated CO2 due to regional/local emissions and sequestered CO2 caused by photosynthesis could be selected from all the observed time series.
3. Results and discussion
3.1. Selected data analysis
3.1.1. Percentages of selected CO2 data.
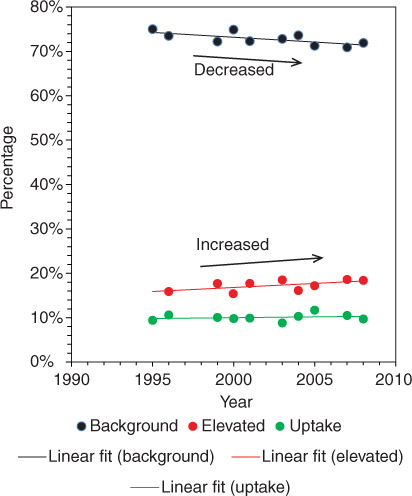
lists percentages for selected background, elevated and sequestered CO2 data in each year by using our method. A percentage of 72.8%±1.4% of all observed CO2 data have been selected as background data over the past 14 years while large CO2 mixing ratios account for 17.2%±1.2% of all data representing the contaminations influenced by local or regional emissions/sources from fossil fuel or biosphere sources. Relatively low values of CO2 concentrations correspond to sequestered CO2 suggesting photosynthetic activity (lower average percentage of 10.1%±0.8%). The percentages of background, elevated and sequestered data in different years reflect the changes in regional sources and sinks for CO2 as well as the changes in meteorological conditions at Waliguan.
Table 2. Percentage for background, polluted and sequestered CO2 data in each year
displays trends in the percentages for background, elevated and sequestered CO2 data. It should be noted that the percentage of elevated data increased slightly from 15 to 16% during the 1995–2000 period and from 17 to 18% during the 2004–2008 period. This is likely a result of increased CO2 sources and enhanced regional impacts in recent years. Such an increase is driven by anthropogenic emissions or natural releases, and thus cannot be sorted out due to all the information being included in the observations. The percentages of CO2 data representing ‘sequestration’ also slightly increased from approximately 10 to 10.6% between 1995 and 2008 suggesting an increased trend of the occurrence of sequestered CO2 in recent years in western China.
Fig. 4. Trends of the percentages for background, elevated, and sequestered CO2 data.
3.1.2. Time series of elevated and sequestered CO2.
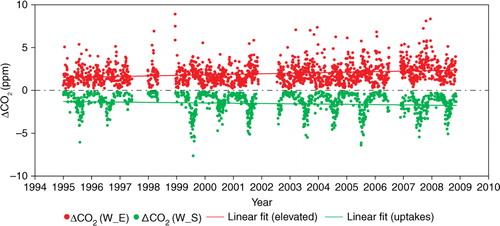
We take elevated and sequestered CO2 as an index in this study in order to investigate the long-term variations of CO2 emissions and sinks. Daily averages are used to calculate the changes of CO2 based on their corresponding background values. By convention, the CO2 sink is reported as negative (removing CO2 from the atmosphere) and its source as positive (adding CO2 to the atmosphere). In this study, ΔCO2(E) refers to the amounts of emissions (typically positive values) and ΔCO2(S) reflects the magnitudes of sinks with negative values. They are calculated by using daily elevated and sequestered CO2 minus background values, respectively. If ΔCO2(E) is more positive or ΔCO2(S) is more negative, that would reflect stronger CO2 emissions or sinks.
shows the time series of elevated and sequestered CO2 as indicated by ΔCO2(E) and ΔCO2(S) during 1995–2008. Significant fluctuations in ΔCO2(E) are exhibited which vary from 0 to approximately 5 ppm during the observed period. There is no apparent seasonal cycle indicated by ΔCO2(E), but ΔCO2(S) does display a significant seasonal variation with values of near zero in winter and negative in the summer (~−5 ppm). The seasonality for ΔCO2(S) should be mainly attributed to enhanced photosynthetic sequestration in the summer which can lead to a sharp decline in atmospheric CO2 mixing ratios in the northern hemisphere (Tans et al., Citation1990).
Fig. 5. Time series of elevated and sequestered CO2 during 1995–2008.
3.2. Implications of CO2 emissions and sinks
3.2.1. Study area definition and estimates method.
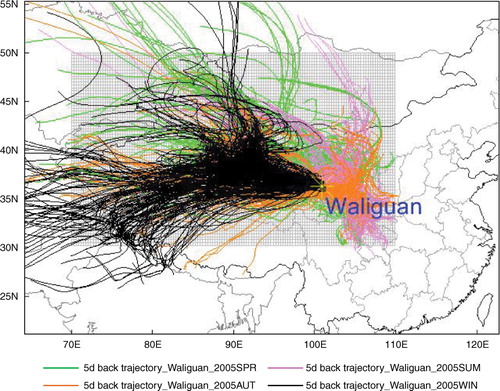
Analysis of air mass back-trajectories combined with long-term ambient air measurements can be used for analysing large-scale air pollutant transport and source identification at a receptor site (Stohl, Citation1996; Rousseau et al., Citation2004). Usually, the influence of air transport over a site within 3–5 d is regarded as a regional impact. Therefore, in this study, we calculated five day (120 h) back-trajectories originating at 00:00, 06:00, 12:00 and 18:00 UTC by the Hybrid Single-Particle Lagrangian Integrated Trajectory model (HYSPLIT) (Draxler and Hess, Citation1998) using NCEP (National Centers for Environmental Prediction) reanalysis data.
The arrival height of the trajectories was 500 m above ground level, which has been shown to be the most representative for air sampled at Waliguan (Zhou et al., Citation2003). According to the paths and regions that the trajectories passed through, we have identified a grid area with latitude of 30N–50N and longitude of 70E–110E (). In this study, the estimated changes of CO2 emissions could thus represent the specified grid area that covers most regions of western China.
Fig. 6. Five-day (120 h) back-trajectories at Waliguan in 2005. The different colours indicate trajectory in different seasons. The back-trajectories originating at 00:00, 06:00, 12:00 and 18:00 UTC were calculated by the Hybrid Single-Particle Lagrangian Integrated Trajectory model (HYSPLIT) (Draxler and Hess, Citation1998) using NCEP (National Centers for Environmental Prediction) reanalysis data. The arrival height of the trajectories was 500 m above ground level. A grid area, covered by almost trajectories of the whole year with latitude of 30°N–50°N and longitude of 70°E–110°E, has been identified, as include most of the region of western China.
Because the occurrences of elevated and sequestered CO2 shows large variances over different periods, using ΔCO2(E) or ΔCO2(S) alone cannot provide a real and integrative estimate of sources and sinks. For example, in winter, high-sequestered CO2 concentrations can be observed at any time but the frequency of occurrence (percentage of sequestered data) is usually low. Therefore, a weighted ΔCO2, which we define as ΔCO2 (W_E) and ΔCO2 (W_S), are calculated using ΔCO2 (E) and ΔCO2 (S) multiplied by their frequency of occurrence. We then estimate the amount of emissions and sinks using ΔCO2 (W_E) and ΔCO2 (W_S) multiplied by a conversion factor of γ (γ=36.7 Tg C/ppm). The conversion factor is calculated from atmospheric CO2 reported as the dry air molar mixing ratio in ppm units (Sarmiento et al., Citation2010), which is then converted to Tg C of CO2 in the atmosphere using the following relationships:
where N air is the number of moles in the atmosphere, m atm is the dry mass of the atmosphere of the area covered by trajectories of the whole year with latitude of 30°N–50°N and longitude of 70°E–110°E (), which accounts for nearly 1.7253% of the total global surface area. In this case, the total dry mass of the atmosphere (5.1352±0.0003×10¹⁸ kg) estimated by Trenberth and Smith (Citation2005) is multiplied by 1.7253% to obtain the m atm. The molar mass of air (µair) in kg mol−1 for which we use the relationship given by Khélifa et al. (Citation2007), ΔCO2 is the dry air molar mixing ratio of CO2 obtained by measurements, and µC=12 g mol−1 is the molar mass of carbon. The conversion factor we obtain is 36.70669 Tg C per ppm of dry air in January of 1995, decreasing to 36.70632 by November of 2008. Thus, we use a conversion factor of 36.7 Tg C per ppm of dry air.
3.2.2. Seasonal changes of CO2 emissions.
illustrates the CO2 emission changes derived from the weighted amounts of elevated CO2 in different seasons between 1995 and 2008 in western China. CO2 emissions as indicated by ΔCO2 (W_E) increased significantly in each season during the past 14 yr. The upward trends in spring and summer are similar, with growth rates of approximately 1.2–1.3 Tg C yr−1. However, ΔCO2 (W_E) showed much larger year-to-year fluctuations during the spring with a low correlation coefficient value while during the summer exhibiting slight inter-annual changes with a smooth increasing linear trend. In autumn, ΔCO2 (W_E) showed a rapid growth rate of ~1.7 Tg C yr−1 over the period of 1995–2008, with large year-to-year fluctuations. In winter, ΔCO2 (W_E) showed the fastest upward trend and increased by approximately 4.0 Tg C yr−1. The inter-annual variation in winter is also small and similar to that obtained in summer. The different growth rates of ΔCO2 (W_E) observed during different seasons reflect the distinct seasonal characteristics of CO2 sources in western China. The large inter-annual variations of ΔCO2 (W_E) in spring and autumn indicated that these regional or local CO2 sources (e.g. fossil fuel, biomass burning or respirations) changed significantly both in magnitude and type from year to year. In other words, the slight year-to-year fluctuations of ΔCO2 (W_E) implied relatively constant CO2 sources in the winter and summer seasons.
Fig. 7. CO2 emission changes estimated from the weighted amounts of elevated CO2 in different seasons between 1995 and 2008 in western China.
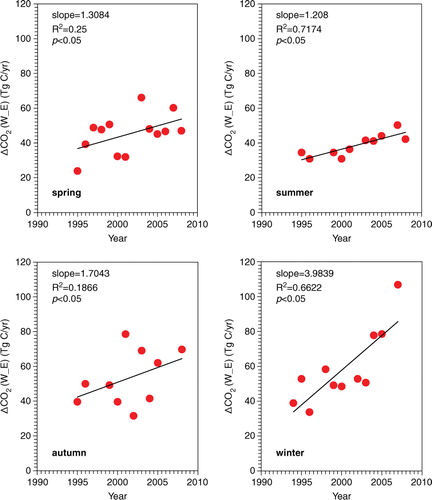
Overall, ΔCO2 (W_E) increases much more dramatically in winter than in summer. According to our previous studies (Zhou et al., Citation2003; Zhang et al., Citation2011), CO2 spikes in winter were closely associated with dominant air parcels especially from the northwestern regions of the site, such as the Taklimakan Desert and Tarim Basin, both of which have been largely developed in past decades due to a wealth of oil and gas resources. In summer, these spikes frequently occur due to prevailing air masses originating from northeastern or eastern regions (e.g. Gansu and Shaanxi provinces).
Furthermore, we assert that anthropogenic CO2 emissions west of the site change faster than eastern areas during previous decades. Surprisingly, we find that potential source regions of CO2 are extensively distributed west of the site (Zhang et al., Citation2011), which was unexpected since the area is typically regarded as relatively remote and clean. High CO2 concentrations in the area have also been retrieved based on the satellite data (Bai et al., Citation2010), which further indicates strong CO2 sources. This change may be the result of emerging economies in western China during the past two decades thus leading to significant increases in CO2 emissions.
The increasing ΔCO2 (W_E) trend observed in autumn is stronger than in the spring. This suggests enhanced respirations due to autumn warming under climate change and growing atmospheric CO2 concentrations according to Piao et al. (Citation2008). They found that both plant photosynthesis and respiration increase during autumn warming, but the increase in respiration is greater by using process-based terrestrial biosphere model and satellite vegetation greenness index observations. Their simulations and observations indicated that northern terrestrial ecosystems may currently lose CO2 in response to autumn warming from using historic climate data during the 1980–2002 period (Piao et al., Citation2008). However, further studies are needed to demonstrate our observed enhanced increasing CO2 emission trend in autumn.
3.2.3. Seasonal changes of CO2 sinks.
displays changes of the CO2 sink derived from weighted amounts of sequestered CO2 in different seasons between 1995 and 2008. The ΔCO2 (W_S) values for every season except summer did not show significant upward or downward trends. The plain lines reflect CO2 sinks due to the terrestrial ecosystem in western China and are relatively constant in the spring, autumn and winter seasons during the 1995–2008 period. The absolute value of ΔCO2 (W_S) in winter is lowest (<10 Tg C yr−1), indicating weak CO2 sinks caused by decreased vegetation activity in the northern hemisphere mid-latitude during cold periods.
Fig. 8. CO2 sink changes estimated from the weighted amounts of sequestered CO2 in different seasons between 1995 and 2008 in western China.
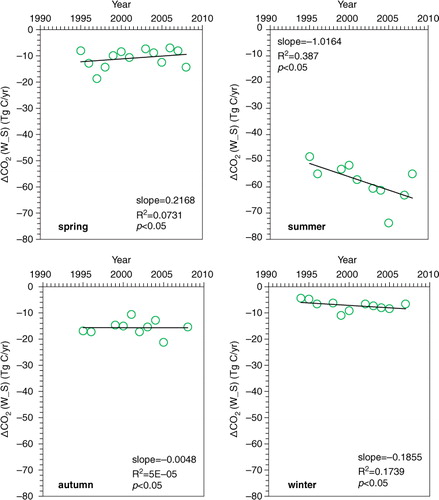
In the summer, the absolute values of ΔCO2 (W_S) are larger (approximately 50–60 Tg C yr−1) due to strong biosphere CO2 sequestration by terrestrial ecosystems. The decreasing trend of ΔCO2 (W_S) in summer implies a slight increase of CO2 sinks with a growth rate of 1.0 Tg C yr−1 from 1995 to 2008. The increase may imply an enhanced terrestrial sink in western China driven by changes of several integral global change factors including solar radiation, precipitation, and vegetation fractional cover (Tian et al., Citation2011a).
3.2.4. Trends of CO2 emissions.
shows total annual emissions and sinks of CO2 as indicated by ΔCO2 (W_E) and ΔCO2 (W_S) in each individual year from 1995 to 2008. Annual emissions of CO2 exhibited a significant increasing trend with a yearly growth rate of approximately 8.4 Tg C yr−1 (3.9% yr−1) during 1995–2008 which accelerated to 12.6 Tg C yr−1 (6.2% yr−1) during 2000–2008. This is most likely due to China implementing a national strategy in 2000 to develop western regions. Economic sectors that use petroleum have also rapidly expanded since 2000. By comparing the total emission growth rate of China, we estimated an increase in CO2 emissions of 58% from 2000 to 2006, which is lower than the near 80% increase (at 10% annual growth) from all China during the same periods reported by Gregg et al. (Citation2008).
Fig. 9. Trend of CO2 emissions and sinks estimated from the observed elevated and sequestered CO2 during 1995–2008 in western China.
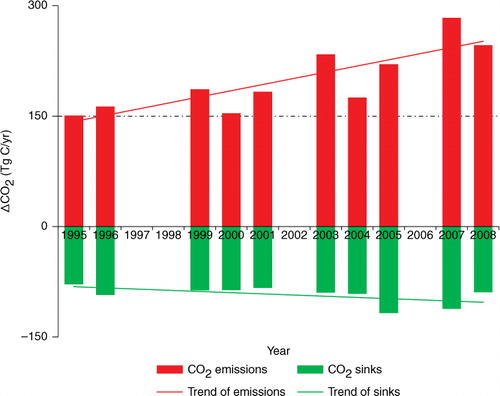
The annual mean emissions changed from 167 Tg C yr−1 in 1995–1999 to 193 Tg C yr−1 during 2000–2006. Gregg et al. (Citation2008) estimated that the country emitted 132 Tg C month−1 in November 2005 and 142 Tg C month−1 in September of 2006. One can thus roughly estimate an annual emission of 1644 Tg C in 2006 by using the average of monthly emissions in November 2005 and September 2006 multiplied by 12. According to the 10% annual growth during 2000–2006, one can also calculate the annual national emissions of nearly 926 Tg C in 2000 and 1256 Tg C during the 2000–2006 period. Consequently, the annual emission during 2000–2006 in the country is almost 6.5 times higher than that in western China. Additionally, we suppose the national annual emission in 2000 should be slightly higher or similar to that during 1995–1999, and thus the annual mean emission during the early years of 1995–1999 in the country is approximately 5.5 times higher than that in western China. The large discrepancy of CO2 emission between western and eastern China has also been indicated by a short-term observed dataset from Shangdianzi, which is located in populated North China Plain (Turnbull et al., Citation2011). Based on the above assumption, the emission gap of CO2 between western China and the rest of the nation has grown since 2000. However, due to the sharp acceleration of emission rates in western China, we imply the numbers would be closer, and the emission gap between the western areas and other regions of China would be reduced with the rapid economic development over the country in the near future.
As compared to global emissions, the growth rates of CO2 emissions in western China are much higher. For example, Le Quere et al. (Citation2009) reported global CO2 emissions from fossil fuel combustion, including small contributions from cement production and gas flaring, increased at a rate of 1.0% yr−1 in the 1990s and 3.4% yr−1 between 2000 and 2008. Canadell et al. (Citation2007) also reported CO2 emissions from fossil fuel burning and industrial processes increased with a similar growth rate of 1.3% yr−1 for 1990–1999 to 3.3% yr−1 for 2000–2006. The quickening trend of CO2 emissions in western China since 2000 implied from changes of atmospheric CO2 by this study is consistent with the trend globally. However, the reported anthropogenic CO2 emissions by the above-mentioned studies are all sourced from CO2 Information Analysis Center (CDIAC) compilations of reported national emissions based on slightly varying inventory methods. While our study just implies regional atmospheric changes in western China, which could provide an important correlation with the reported anthropogenic emissions, one should be cautious when extrapolating it to global acceleration. Raupach et al. (Citation2007) suggested that 54% of the global increase in CO2 emissions from fossil fuel combustion and cement manufacturing over the 2001–2006 periods came from China alone. Gregg et al. (Citation2008) demonstrated that China became the largest national source of CO2 emissions during recent years. Consequently, the much faster increase rates even in remote western China would certainly play a huge role in global emissions. Additionally, the rising respiration in autumn due to climate change and autumn warming (Piao et al., Citation2008) may happen. However, we assume the contribution to the overall trend should be much less compared to the fossil fuels and other human sources.
3.2.5. Trends of CO2 sinks.
Although no apparent upward or downward trend was observed during the 1995–2008 period for the overall change of CO2 sinks, two peaks were present in 2005 and 2007 (). Mean ΔCO2 (W_S) varied from −86.0 Tg C yr−1 in 1995–1999 to −106.2 Tg C yr−1 in 2005–2008. This may yet imply an increasing trend of CO2 sinks in the region. Because the trend was only observed in summer (), we infer that it is attributed to enhanced CO2 fluxes of vegetation absorption.
Several studies have reported increasing trends of carbon sinks in China driven by land-use changes or climate change based on both observations of inventory as well as satellite data and model simulations (Fang et al., Citation2001, Citation2004; Lal, Citation2004; Huang and Sun, Citation2006; Piao et al., Citation2007, Citation2009). For example, Fang et al. (Citation2004) found that the increased summer precipitation in China may have benefited vegetation growth as the large-scale reforestation and afforestation programs conducted since the 1980s have been confirmed by Fang et al. (Citation2001) as being the main causes of regional carbon sinks.
Precipitation has increased significantly in western China during the past 50 yr (Zhai et al., Citation2005). The changes in precipitation amount and distribution would alter current regional and global-scale terrestrial carbon cycles. This is likely associated with enhanced CO2 sinks in western regions of China by our estimation and in addition, changes in land cover/use (e.g. the strategy of returning the grain plots to forestry and grass) over past decades may be another factor that increases carbon sinks in the region (Tian et al., Citation2011a).
However, the growth rate of CO2 sinks cannot keep up with the increase in CO2 emissions in the region which results in the continuous increase of atmospheric loading of CO2 mixing ratios that will greatly impact the global carbon cycle. According to past records, the atmospheric temperature measured at Waliguan increased by more than 0.6°C/decade, which is much faster than the global land mean temperature growth rates of ~0.27°C/decade (IPCC, Citation2007). The rapid growth rate of atmospheric temperature implies that the region is sensitive to climate change. Therefore, further studies including more regional data with high spatial resolutions and more developed models like the atmospheric inverse model and process-based ecosystem models are needed in order to illustrate our results.
4. Conclusions
We have implied changes in CO2 emissions and sinks in western China over the 1995–2008 period based on the long-term dataset of atmospheric CO2 at Waliguan. Changes in CO2 emissions and sinks are estimated from episodes of elevated and sequestered CO2 concentrations selected by a modified background identification method. With this method, we have identified nearly 17.2%±1.2% and 10.1%±0.8% of all observed data as elevated and sequestered CO2, respectively. We propose that the CO2 emissions of western China have increased significantly in all seasons during the past 14 yr, with a growth rate of ~8.4 Tg C yr−1 (3.9% yr−1) during 1995–2008. We estimate the growth trend has steadily increased 12.6 Tg C yr−1 (6.2% yr−1) since 2000.
The growth rates of CO2 emissions from western China are lower than that estimated from all of China by Gregg et al. (Citation2008), but higher than the simulations for the global CO2 emission trend by Le Quere et al. (Citation2009) on the basis of the national energy statistics and by Raupach et al. (Citation2007) during the same periods. We also find that CO2 sinks in western China varied from 86.0 Tg C yr−1 in early 1995–1999 to 106.2 Tg C yr−1 in recent 2005–2008.
According to the seasonal changes of CO2 sinks, we have demonstrated that the change is closely related to the summer enhancement of CO2 sequestration by the vegetation photosynthesis effect during the growing season in the Northern hemisphere. Thus, we suppose the increase of CO2 sinks may be related to increased precipitation and changes in land use over past decades in western China. The growth rate of CO2 sinks cannot keep up with the increase of CO2 emissions in the region, which will result in a continuous increase of atmospheric CO2 mixing ratios and finally influence global CO2 loadings in the future.
Although this relatively comprehensive analysis is intended to identify the changes of CO2 emissions and sinks in the west area of China, it is also critical to recognize the limitation of the current method. Because of the complicated sources and sinks of CO2 in terrestrial systems in China, it is necessary to use more regional input data with higher temporal and spatial resolutions for carbon fluxes estimation in the future. Furthermore, we will apply other models like the atmospheric inverse and process-based ecosystem models to simulate and derive more confident estimations.
5. Acknowledgements
This work was supported by the National Natural Science Foundation of China (41175116), National Basic Research Program of China ‘973’ (Grant No. 2010CB950601, 2013CB955801) and International S&T Cooperation Program of MOST (Grant No. 2011DFA21090). Data used are supplied by the Chinese Academy of Meteorological Sciences (CAMS), China Meteorological Administration (CMA). The paper is based on F. Zhang's PhD program from 2008–2011 during her study in CAMS. We thank the staff of Waliguan Station for their efforts in maintain in-situ measurement systems. We also appreciate two anonymous reviewers for their constructive comments that greatly improved this manuscript. Finally, we would like to thank Mr. Timothy Logan's assistance in correcting the English.
References
- Bai W. G, Zhang X. Y, Zhang P. Temporal and spatial distribution of tropospheric CO2 over China based on satellite observations. Chin. Sci. Bull. 2010; 55(31): 3612–3618. 10.3402/tellusb.v65i0.19576.
- Ballantyne, A. P, Alden, C. B, Miller, J. B, Tans, P. P and White, J. W. C. 2012. Increase in observed net carbon dioxide uptake by land and oceans during the past 50 years. Nature. 488. DOI: 10.3402/tellusb.v65i0.19576.
- Bousquet P, Peylin P, Ciais P, Le Quere C, Friedlingstein P, co-authors. Regional changes in carbon dioxide fluxes of land and oceans since 1980. Science. 2000; 290: 1342–1346. 10.3402/tellusb.v65i0.19576.
- Bousquet P, Peylin P, Ciais P, Ramonet M, Monfray P. Inverse modelling of annual atmospheric CO2 sources and sinks 2. Sensitivity study. J. Geophys. Res. 1999; 104(D21): 26179–26193. 10.3402/tellusb.v65i0.19576.
- Canadell J. G, Le Quere C, Raupach M. R, Field C. B, Buitenhuis E. T, co-authors. Contributions to accelerating atmospheric CO2 growth from economic activity, carbon intensity, and efficiency of natural sinks. Proc. Natl. Acad. Sci. U. S. A. 2007; 104: 18866–18870. 10.3402/tellusb.v65i0.19576.
- Draxler R. R, Hess G. D. An overview of the HYSPLIT 4 modelling system for trajectories, dispersion, and deposition. Aust. Meteorol. Mag. 1998; 47: 295–308.
- Fan S, Gloor M, Mahlman J, Pacala S, Sarmiento J, co-authors. A large terrestrial carbon sink in North America implied by atmospheric and oceanic carbon dioxide data and models. Science. 1998; 282: 442–446. 10.3402/tellusb.v65i0.19576.
- Fang J. Y, Chen A. P, Peng C. H, Zhao S. Q, Ci L. J. Changes in forest biomass carbon storage in China between 1949 and 1998. Science. 2001; 292: 2320–2322. 10.3402/tellusb.v65i0.19576.
- Fang J. Y, Piao S. L, He J. S, Ma W. H. Increasing terrestrial vegetation activity in China, 1982–1999. Sci. China. C. Life. Sci. 2004; 47: 229–240.
- Francey R. J, Tans P. P, Allison C. E, Enting I. G, White J. W. C, co-authors. Changes in oceanic and terrestrial carbon uptake since 1982. Nature. 1995; 373: 326–330. 10.3402/tellusb.v65i0.19576.
- Francey R. J, Trudinger C. M, Schoot M. V. D, Krummel P. B, Steele L. P, co-authors. Differences between trends in atmospheric CO2 and reported trends in anthropogenic CO2 emissions. Tellus. B. 2010; 62: 316–328. 10.3402/tellusb.v65i0.19576.
- Gillette D. A, Komhyr W. D, Waterman L. S, Steele L. P, Gammon R. H. The NOAA/GMCC continuous CO2 record at the South Pole, 1975–1982. J. Geophys. Res. 1987; 92: 4231–4240. 10.3402/tellusb.v65i0.19576.
- Gregg, J. S, Andres, R. J and Marland, G. 2008. China: emissions pattern of the world leader in CO2 emissions from fossil fuel consumption and cement production. Geophys. Res. Lett. 35: L08806. 10.3402/tellusb.v65i0.19576.
- Guan D, Liu Z, Geng Y, Lindner S, Hubacek K. The gigatonne gap in China's carbon dioxide inventories. Nat. Clim. Chang. 2012; 2: 672–675.
- Gurney K. R, Law R. M, Denning A. S, Rayner P. J, Baker D, co-authors. Towards robust regional estimates of CO2 sources and sinks using atmospheric transport models. Nature. 2002; 415: 626–630. 10.3402/tellusb.v65i0.19576.
- House J. I, Prentice C, Ramankutty N, Houghton R. A, Heimann M. Reconciling apparent inconsistencies in estimates of terrestrial CO2 sources and sinks. Tellus B. 2003; 55B: 345–363. 10.3402/tellusb.v65i0.19576.
- Huang Y, Sun W. J. Changes in topsoil organic carbon of croplands in mainland China over the last two decades. Chin. Sci. Bull. 2006; 51(15): 1785–1803. 10.3402/tellusb.v65i0.19576.
- IPCC. 2007. Climate Change 2007: The Physical Science Basis. Cambridge University Press: Cambridge.
- Khélifa N, Lecollinet M, Himbert M. Molar mass of dry air in mass metrology. 2007; 40: 779–784. 10.3402/tellusb.v65i0.19576.
- Lal R. Offsetting China's CO2 emissions by soil carbon sequestration. 2004; 65: 263–275. 10.3402/tellusb.v65i0.19576.
- Le Quere C, Raupach M. R, Canadell J. G, Marland G, Bopp L, co-authors. Trends in the sources and sinks of carbon dioxide. Measurement. 2009; 2: 831–836. 10.3402/tellusb.v65i0.19576.
- Liu L. X, Zhou L. X, Zhang X. C, Wen M, Zhang F, co-authors. The characteristics of atmospheric CO2 concentration variation of four national background stations in China. Clim. Chang. 2009; 52(11): 1857–1863. 10.3402/tellusb.v65i0.19576.
- Lu C, Tian H. Q, Liu M, Ren W, Xu X, co-authors. Effects of nitrogen deposition on China's terrestrial carbon uptake in the context of multiple environmental changes. Nat. Geosci. 2012; 22: 53–75. 10.3402/tellusb.v65i0.19576.
- Maksyutov S, Machida T, Mukai H, Patra P. K, Nakazawa T, co-authors. Effect of recent observations on Asian CO2 flux estimates by transport model inversions. Sci. China. Ser. D. Earth. Sci. 2003; 55: 522–529. 10.3402/tellusb.v65i0.19576.
- Mu, Q. Z, Zhao, M. S, Running, S.W, Liu, M. L and Tian, H. Q. 2008. Contribution of increasing CO2 and climate change to the carbon cycle in China's ecosystems. Ecol. Appl. 113: G01018. 10.3402/tellusb.v65i0.19576.
- Pacala S. W, Hurtt G. C, Baker D, Peylin P, Houghton R. A, co-authors. Consistent land- and atmosphere-based U.S. carbon sink estimates. Tellus. B. 2001; 292: 2316–2320. 10.3402/tellusb.v65i0.19576.
- Peters, G. P, Marland, G, Le Quéré, C, Boden, T, Canadell, J. G. and co-authors. 2012. Rapid growth in CO2 emissions after the 2008–2009 global financial crisis. J. Geophys. Res. 2: 2–4.
- Peylin, P, Bousquet, P, Le Quéré, C, Sitch, S, Friedlingstein, P. and co-authors. 2005. Multiple constraints on regional CO2 flux variations over land and oceans. Science. 19(1): 2214–2237.10.3402/tellusb.v65i0.19576.
- Piao S. L, Ciais P, Friedlingstein P, Peylin P, Reichstein M, co-authors. Net carbon dioxide losses of northern ecosystems in response to autumn warming. Nat. Clim. Chang. 2008; 451: 49–52. 10.3402/tellusb.v65i0.19576.
- Piao S. L, Fang J. Y, Ciais P, Peylin P, Huang Y, co-authors. The carbon balance of terrestrial ecosystems in China. Glob. Biogeochem. Cycles. 2009; 458: 1009–1013. 10.3402/tellusb.v65i0.19576.
- Piao, S. L, Fang, J. Y, Zhou, L. M, Tan, K and Tao, S. 2007. Changes in biomass carbon stocks in China's grasslands between 1982 and 1999. Nature. 21: GB2002. 10.3402/tellusb.v65i0.19576.
- Raupach M, Marland G, Ciais P, L Quéré C, Canadell J. G, co-authors. Global and regional drivers of accelerating CO2 emissions. Nature. 2007; 104: 10288–10293. 10.3402/tellusb.v65i0.19576.
- Ren, W, Tian, H. Q, Tao, B, Huang, Y and Pan, S. 2012. China's crop productivity and soil carbon storage as influenced by multifactor global change. Glob. Biogeochem. Cycles. 18: 2945–2957.10.3402/tellusb.v65i0.19576.
- Ren W, Tian H. Q, Xu X, Liu M, Lu C, co-authors. Spatial and temporal patterns of CO2 and CH4 fluxes in China's croplands in response to multifactor environmental changes. Proc. Natl. Acad. Sci. 2010; 63B: 222–240.
- Rousseau, D. D, Duzer, D, Etienne, J. L, Cambon, G, Jolly, D. and co-authors. 2004. Pollen record of rapidly changing air trajectories to the North Pole. Glob. Chang. Biol. 109: D06116. 10.3402/tellusb.v65i0.19576.
- Sarmiento J. L, Gloor M, Gruber N, Beaulieu C, Jacobson A. R, co-authors. Trends and regional distributions of land and ocean carbon sinks. Tellus. B. 2010; 7: 2351–2367. 10.3402/tellusb.v65i0.19576.
- Stohl A. Trajectory statistics – a new method to establish source-receptor relationships of air pollutants and its application to the transport of particulate sulfate in Europe. J. Geophys. Res. 1996; 30: 579–587. 10.3402/tellusb.v65i0.19576.
- Tans P. P, Bakwin P. S, Guenther D. W. A feasible global carbon cycle observing system: a plan to decipher today's carbon cycle based on observations. Biogeosciences. 1996; 2: 309–318. 10.3402/tellusb.v65i0.19576.
- Tans P. P, Fung I. Y, Takahashi T. Observational constraints on the global atmospheric CO2 budget. Atmos. Environ. 1990; 247: 1431–1438. 10.3402/tellusb.v65i0.19576.
- Tian, H. Q, Melillo, J, Lu, C, Kicklighter, D, Liu, M. and co-authors. 2011a. China's terrestrial carbon balance: contribution from multiple global change factors. Glob. Chang. Biol. 25. 10.3402/tellusb.v65i0.19576.
- Tian, H. Q, Xu, X, Lu, C, Liu, M, Ren, W. and co-authors. 2011b. Net exchanges of CO2, CH4, and N2O between China's terrestrial ecosystems and the atmosphere and their contributions to global climate warming. Science. 116: 1393–1405.
- Trenberth K. E, Smith L. The mass of the atmosphere: a constraint on global analyses. Glob. Biogeochem. Cycles. 2005; 18: 864–875. 10.3402/tellusb.v65i0.19576.
- Thoning K, Tans P. P, Komhyr W. Atmospheric carbon dioxide at Mauna Loa Observatory, 2. Analysis of the NOAA GMCC data, 1984–1985. J. Geophys. Res. 1989; 94: 8549–8565. 10.3402/tellusb.v65i0.19576.
- Turnbull, J. C, Tans, P. P, Lehman, S. J, Baker, D, Conway, T. J and co-authors. 2011. 116: D24306. 10.3402/tellusb.v65i0.19576.
- Wang G. C, Wen Y. P, Kong Q. X. The concentration of CO2 and its variation in China. J. Geophys. Res. 2002; 47(10): 780–783.
- Wang Y, Munger J. W, Xu S, McElroy M. B, Hao J, co-authors. CO2 and its correlation with CO at a rural site near Beijing: implications for combustion efficiency in China. J. Geophys. Res. 2010; 10(18): 8881–8897. 10.3402/tellusb.v65i0.19576.
- Wen Y. P, Tang J, Shao Z. Q, Zhang X. C, Zhao Y. C. A study of atmospheric CO2 concentration variations and emission from the soil surface at MT. Waliguan. Chin. Sci. Bull. 1997; 8: 129–136.
- Zhai P, Zhang X, Wan H, Pan X. Trends in total precipitation and frequency of daily precipitation extremes over China. Atmos. Chem. Phys. 2005; 18: 1096–1108. 10.3402/tellusb.v65i0.19576.
- Zhang, D. Q, Tang, J, Shi, G. Y, Nakazawa, T, Aoki, S. and co-authors. 2008. Temporal and spatial variations of the atmospheric CO2 concentration in China. Q. J. Appl. Meteorol. 35(3): L03801. 10.3402/tellusb.v65i0.19576.
- Zhang F, Zhou L. X, Novelli P. C, Worthy D. E. J, Zellweger C, co-authors. Evaluation of in situ measurements of atmospheric carbon monoxide at Mount Waliguan, China. J. Clim. 2011; 11(11): 5195–5206. 10.3402/tellusb.v65i0.19576.
- Zhou, L. X, Conway, T. J, White, J. W. C, Mukai, H, Zhang, X. and co-authors. 2005. Long-term record of atmospheric CO2 and stable isotopic ratios at Waliguan Observatory: background features and possible drivers, 1991–2002. Geophys. Res. Lett. 19: GB3021. 10.3402/tellusb.v65i0.19576.
- Zhou L. X, Tang J, Wen Y. P, Li J. L, Yan P. The impact of local winds and long-range transport on the continuous carbon dioxide record at Mount Waliguan, China. Atmos. Chem. Phys. 2003; 55: 145–158. 10.3402/tellusb.v65i0.19576.
- Zhou, L. X, White, J. W. C, Conway, T. J, Mukai, H, MacClune, K. and co-authors. 2006. Long-term record of atmospheric CO2 and stable isotopic ratios at Waliguan Observatory: seasonally averaged 1991–2002 source/sink signals, and a comparison of 1998–2002 record to the 11 selected sites in the Northern Hemisphere. Glob. Biogeochem. Cycles. 20: GB2001. 10.3402/tellusb.v65i0.19576.