ABSTRACT
The amount and timing of reactive nitrogen exchange between agricultural land and the atmosphere play a key role in evaluating ecosystem productivity and in addressing atmospheric nitrogen budgets and transport. With the recent development of the Total Reactive Atmospheric Nitrogen Converter (TRANC) apparatus, a methodology has been provided for continuous measurement of the sum of all airborne nitrogen containing species (ΣNr) allowing for diurnal and seasonal investigations. We present ΣNr concentration and net flux data from an 11-month field campaign conducted at an arable field using the TRANC system within an eddy-covariance setup. Clear diurnal patterns of both ΣNr concentrations and fluxes with significant dependencies on atmospheric stability and stomatal regulation were observed in the growing season. TRANC data were compared with monthly-averaged concentrations and dry deposition rates of selected Nr compounds using DELTA denuders and ensemble-averages of four inferential models, respectively. Similar seasonal trends were found for Nr concentrations from DELTA and TRANC measurements with values from the latter being considerably higher than those of DELTA denuders. The variability of the difference between these two systems could be explained by seasonally changing source locations of NOx contributions to the TRANC signal. As soil and vegetation Nr emissions to the atmosphere are generally not treated by inferential (dry deposition) models, TRANC data showed lower monthly deposition rates than those obtained from inferential modelling. Net ΣNr exchange was almost neutral (~0.072 kg N ha−1) at the end of the observation period. However, during most parts of the year, slight but permanent net ΣNr deposition was found. Our measurements demonstrate that fertilizer addition followed by substantial ΣNr emissions plays a crucial role in a site's annual atmospheric nitrogen budget. As long-term Nr measurements with high temporal resolution are usually cost and labour-intensive, field application of the TRANC helps improve the understanding of ecosystem functioning, atmospheric transport and revising definitions of ecosystem-specific critical loads at a relatively moderate operational cost level.
1. Introduction
The biosphere–atmosphere interaction of nitrogen (N) containing species has direct impacts on ecosystem nutrient dynamics and on oxidative atmospheric chemistry (Ollinger et al., Citation2002; Farmer et al., Citation2006). Fertilizer application, symbiotic fixation of dinitrogen (N2), and atmospheric deposition of gaseous ammonia (NH3), particulate ammonium (NH4 +) and oxidized forms of N lead to a net gain of N in ecosystems, whereas soil and plant emissions of nitric oxide (NO) or nitrogen dioxide (NO2) as well as nitrous oxide (N2O) via nitrification and denitrification, cause a release of N into the atmosphere (Vitousek et al., Citation1997). Elevated deposition rates of reactive nitrogen (Nr) are the result of increased ambient concentrations due to high emissions by intensive farming (mainly reduced Nr) and by traffic and industry (mainly oxidized Nr) (Flechard et al., Citation2011). The continued boost in anthropogenic emissions of Nr into the atmosphere and N deposition has led to concerns regarding ecosystem N saturation, which may threaten plant health, increase greenhouse gas emissions, and affect water quality (Aber et al., Citation1998). In a modelling study, Flechard et al. (Citation2011) report on annual Nr dry deposition rates of <2 kg N ha−1 at remote forest sites in Scandinavia and >30–40 kg N ha−1 over parts of the Netherlands and Belgium. Generally, turbulent Nr deposition was modelled to be smaller over short vegetation than over forests due to reduced turbulent exchange. The dry deposition of Nr, i.e. of various inorganic species such as gaseous NH3, nitric acid (HNO3), nitrous acid (HONO), NO, NO2 and aerosol NH4 + and nitrate (NO3 −) as well as in a range of organic molecules in both phases (e.g. gaseous peroxyacetyl nitrate (PAN) and other organic nitrates and amines), typically contributes between one and two thirds of total atmospheric N deposition (Erisman et al., Citation1996; Simpson et al., Citation2006; Zimmermann et al., Citation2006; Zhang et al., Citation2009).
Despite the high relevance of Nr cycling for environmental research, the scientific progress in quantifying ecosystem–atmosphere interactions of Nr has fundamentally depended on advances in chemical measurement techniques (Erisman et al., Citation2001; Fowler et al., Citation2001; Sutton et al., Citation2007). Up to now, measurements of dry, i.e. turbulent, Nr exchange using eddy covariance (EC) (Aubinet et al., Citation2000) have mainly remained experimental and limited to only a few research sites (Munger et al., Citation1996) and to short-term campaigns (e.g. Day et al., Citation2002; Farmer et al., Citation2006; Sintermann et al., Citation2011), whereas wet deposition is monitored in regional networks of wet-only or bulk precipitation collectors (Flechard et al., Citation2011). Reasons for the limitation of dry deposition monitoring of Nr are amongst others the wide range, complexity and labour-intensity of flux measurements of Nr containing compounds as well as their mutual interactions and their different molecular and exchange characteristics.
With the development of a novel converter named Total Reactive Atmospheric Nitrogen Converter (TRANC), a methodology is provided for both the quantification of the sum of all airborne Nr compounds – denoted as ΣNr hereafter – and a device being robust and fast enough to be usable in an EC setup when combined with a fast-response NO detector (chemiluminescence detector, CLD). The basic concept of the TRANC is the full and quasi-immediate conversion of ΣNr to NO within a thermal and a catalytic reaction step (for details see Marx et al., Citation2012). The specific design of the converter overcomes former detection problems such as surface water effects (Kita et al., Citation2006; Sintermann et al., Citation2011) by fast and strong heating of the air sample and quick conversion of Nr compounds to NO, thus allowing for measurements of water soluble and sticky substances like NH3. As NO2 and ozone (O3) are fully converted in the TRANC and therefore total NO is conserved, the use of long tubing between TRANC and CLD – possibly needed for the installation of the TRANC on a tower while the CLD is usually protected and stored in housing on the ground – is feasible. The TRANC was successfully tested for recovery rates of single Nr compounds (NO2, NH3) in the lab and showed excellent agreement during an in-field comparison between the sum of individually measured NO, NO2, NH3, HNO3, HONO, NH4 +, and NO3 − by commercially available systems and the ΣNr concentration measured by the TRANC-CLD system (Marx et al., Citation2012). During concentration step changes, the fast response of the system was proved by e-folding times between 0.30 and 0.35 s for different species.
Although a differentiation into single Nr compounds is not possible, the usage of the TRANC-CLD system allows for the determination of the net ΣNr exchange, thereby providing a parameter of major interest for productivity assessment of ecosystems by its N nutrient inputs. The overall aim of this paper is to present the first continuous, multi-month dataset of direct Nr measurements conducted at an agricultural site. Specifically, we (1) investigate environmental controls on diurnal and seasonal progression of Nr concentration and flux patterns, (2) compare TRANC measurements with results from DELTA observations and inferential modelling, and (3) highlight the impact of fertilization on net ΣNr exchange at an agricultural site. In this paper, we define Nr as all nitrogen-containing trace species except for N2 and N2O, which are both inert in the troposphere (Seinfeld and Pandis, Citation2006) and not measurable by the TRANC-CLD system.
2. Methods
2.1. Site description and management
The research site (51°06′0.13″N, 10°54′51.9″E, 162 masl) is located near the village of Gebesee about 20 km northwest of Erfurt in Thuringia, Germany, and was part of the Integrated Projects CarboEurope (2004–2008) and NitroEurope (2006–2011). The measurements presented in this study were conducted from December 2007 to November 2008. Mean annual air temperature (T a ) and precipitation in Gebesee during the reference period 1961–1990 was 7.9°C and 500 mm, respectively. The year 2007 was an exceptionally warm (10.45°C) and wet (692 mm) year. In 2008, mean annual air temperature was also significantly above the long-term mean (9.98°C), whereas total precipitation was slightly below average (480 mm).
The soil type is classified as Chernozem (FAO) with granular structure and a texture defined as silty clay loam consisting of approximately 30% clay. Soil pH is 6.6±0.5 in the uppermost 10 cm layer and increases to 7.3±0.2 in 90 cm depth. Soil organic carbon content is 42.6 and 2.9 g kg−1 in the AP- and B-horizon, respectively. Total carbon stock in <0.6 m depth is 97 t ha−1 (Kutsch et al., Citation2010) and dry bulk density is 1.29±0.12 g cm−3. Carbon to nitrogen ratio in <40 cm depth is ~9 and ~13 in the layers below (Anthoni et al., Citation2004).
The black soil region of the Thuringian Basin has been farmed for at least 900 years. Since 1970 the research field at Gebesee has been alternately cultivated with winter wheat (Triticum aestivum L.) or winter barley (Hordeum vulgare L.) followed either by potato (Solanum tuberosum L.), sugar beet (Beta vulgaris subsp. vulgaris var. altissima) or rapeseed (Brassica napus L.). Every four years the cereal straw is left on the field after harvest. Farmyard manure is added to the soil about every seven years. Since the 1990, ploughing depth has been reduced and is now usually between 20 and 28 cm.
However, during the observation period, a change in the regular crop rotation was made. Due to the late harvest of sugar beet in 2006, winter wheat seeds were only sown on 9 November 2006, which led to a relatively poor harvest in 2007. As a consequence, the farmers decided to plant winter wheat for a second consecutive year. Seeds in 2007 were sown on October 6. Harvest in the two observational years took place on 7 August 2007 and on 5 August 2008. Four fertilizer applications occurred during this period. The first was farmyard manure three months before the start of measurements at a rate of 260 kg N ha−1 on 3 September 2007. The following three were mineral fertilizer applications on 18 April, 21 May, and 6 June 2008 corresponding to 28.5, 82.7, and 44.6 kg N ha−1, respectively. The type of mineral fertilizer in April and May was a 1:1-mixture of calcium ammonium nitrate and ammonium sulfate, whereas the type of fertilizer in June was solely calcium ammonium nitrate. Plant protection agents included various components such as fungicides and growth regulators, their total amount added during the measurement period was ~1 kg ha−1.
2.2. ΣNr measurements
A tower for conventional EC measurements of carbon dioxide (CO2), water and energy exchange with auxiliary meteorological measurements was setup in January 2001 (details are given in Anthoni et al. Citation2004). The same tower was used for the installation of an extra ultrasonic anemometer (model R3, Gill Instruments, Lymington, UK) and the converter for Nr measurements named TRANC. The sonic and converter were mounted on a boom at a height of 4.8 m facing west. As the converter has a diameter of 12 cm and a length of 71 cm, it was positioned downwind of the sonic as seen from the main wind direction to avoid interferences of the micro-turbulence for most of the time.
Core pieces of the converter are a high-temperature resistant metal tube consisting of an iron–nickel–chrome (FeNiCr) alloy heated up to 870°C followed by a gold (Au) tube heated up to 300°C for thermal and catalytic conversion, respectively, in order to reduce/oxidize all N containing species to NO. A very short distance between the sample air inlet and the two conversion tubes assures a short residence time of the sample air inside the instrument, and minimizes wall sorption problems of water soluble compounds. A current of 80 ampere at a voltage of 5 V was fed to the FeNiCr tube over brass blocks. Provision of electricity was effected by a switch-mode power supply with the temperature of the tube being regulated by a universal modulator and controlled by a thermocouple. The Au tube is indirectly warmed up by the heat loss through the FeNiCr tube. Measurement principle and detailed functionality are given in Marx et al. (Citation2012).
Auxiliary devices required for system calibration and continuous determination of Nr concentration and fluxes comprise a CLD (780TR, ECO PHYSICS, Dürnten, Switzerland), a multi-gas calibrator (S6100, Environics Inc., Tolland, USA), a pure air generator (PAG 003, ECO PHYSICS, Dürnten, Switzerland), and a dry vacuum scroll pump (BOC Edwards XDS10, Sussex, UK), which were kept in an air-conditioned trailer a few meters away from the bottom of the tower. The TRANC was connected with the CLD over 18 m-long opaque tubing. Gas phase titration in the main chamber of the CLD required a low pressure regime to reduce the probability of energy loss of excited NO2 * molecules by collision with others. This was affected by the installation of a critical orifice located at the back end of a stainless steel tube that is leaving the TRANC towards the CLD and also restricted the flow rate to 2.7 L min−1. In our setup, the CLD was running in continuous mode, integrating photons over 0.05 s.
The TRANC-CLD unit was calibrated once every night between 03:30 am and 04:00 am by feeding reference gas with different NO and NO2 concentrations through the system to retain optimal data coverage. The multi-gas calibrator was connected to two reference gas cylinders each containing 10 ppm NO and 10 ppm NO2. The calibrator mixed specified gas concentrations by dilution of the cylinder standard with zero air provided by the pure air generator. Reference gases with concentrations of 0, 6, 10, 20, 50, and 120 ppb NO were used for calibrating the CLD (only one particular concentration per night and the other reference gases in the following nights) and obtaining the respective regression parameters. Additionally, 50 ppb NO2 and 50 ppb NO mixed with O3 (<50 ppb) was put into the system to determine the conversion efficiency of NO2. After activating the TRANC calibration valve, the system was calibrated for 30 min with one specific gas concentration. To assure a well-conditioned calibration gas tube and therefore a clearly stable calibration gas concentration at the sample air inlet of the TRANC, only data of the 10-min period from 15 to 25 min after the initial switch were taken to calculate the NO concentrations. If necessary, spikes were removed and the 10-min window was shifted to the most stable interval during the half-hour calibration period. R 2 values of the calibration regression for single 8-day periods were ranging between 0.81 and 0.99 with R 2=0.98 for the averaged 11-month fit (n=30 for each gas concentration). In most cases, intercepts were found to be slightly positive (Marx et al., Citation2012). The conversion efficiency for NO2 was 91%. A possible reason for the mismatch could be a fluctuating NO2 mixing ratio due to non-ideal mixing in the calibration gas cylinder over this relatively long time period. The conversion rate for in-situ produced NO2 resulting from 50 ppb NO mixed with a surplus of O3 was found to be 105%. Beside high accuracy in capturing dominant Nr species, the fast time response of the TRANC-CLD system during step concentration changes between reference gases of NO, NO2, a gas mixture of NO and O3, and ambient air (e-folding times of 0.30–0.35 s were found) enables the converter to be used in an eddy-covariance setup. The reaction time of the whole system is mainly limited by the flushing of the CLD reaction chamber as the average residence time of air in the cell (V=0.7 l) at a pressure of 20 mbar and a flow rate of 3 sl min−1 is 0.28 s.
Regular site and instrumental maintenance was carried out every two weeks; filter (Acrodisc® Gelman 0.45 µm PTFE membrane) replacement once a month. The agricultural field where the measurement tower was erected had an approximate semi-rectangular size of 750 m×850 m. The fetch in the prevailing bimodal wind directions was around 400 m to the west–southwest and around 600 m to the northeast. Estimates of the flux footprint based on an analytic model by Schmid (Citation1993) indicated that for neutral day-time conditions the maximum source area location was at about 80 m distance, 50% contributions were from within 160 m, and 90% within 300 m of the tower. Unstable conditions led to smaller footprints, but very stable conditions at night could have led to larger footprints, bigger than the fetch of the wheat field (Anthoni et al., Citation2004). However, data from low-turbulence conditions were usually rejected due to low u * (Section 2.3).
2.3. Data analysis and flux calculation
Raw signals of wind vectors, sonic temperature, ΣNr concentration, speed of sound, and system control parameters were recorded on a personal computer at a frequency of 20 Hz using Labview7 software (National Instruments, Texas, USA). Prior to calculating eddy fluxes, high-frequency data were linearly detrended and a 2D rotation of the wind speed vectors u, v, and w according to Aubinet et al. (Citation2000) was applied. ΣNr fluxes were calculated for half-hourly intervals as1
with ρ a being the molar density of dry air (kg m−3), w and c being vertical wind speed and ΣNr concentration (nmol mol−1), respectively, where over bars indicate mean values for each 30-min period. Positive covariances correspond to upward transport. The time lag τ accounts for the delayed detection of NO by the CLD mainly due to the residence time of the air sample in the converter and in the sampling tube. Time lags were determined by shifting the time series of c′ against that of w′ until the maximum covariance was reached. In our setup, τ values were usually between 36 and 46 samples corresponding to 1.8 and 2.3 s, respectively.
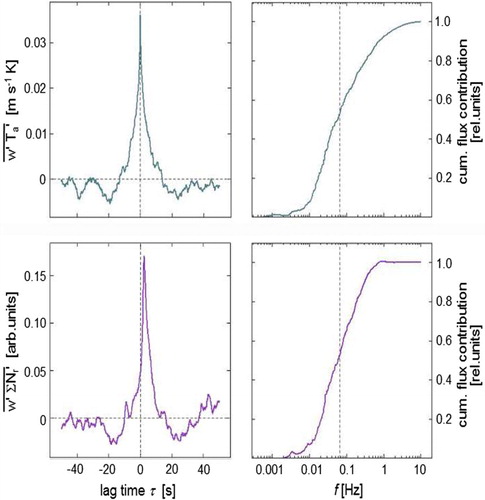
Possible high frequency damping on trace gas time series (here ΣNr) in closed-path systems was analyzed using the ogive method as described in Ammann et al. (Citation2006). Ogives, i.e. cumulative cospectra of were calculated and scaled to the respective reference ogives of
in the lower frequency range. The resulting relative deviations at the high-frequency end are quantitative measures of spectral damping. Over a range of different conditions, e.g. periods with mainly deposition or emission, we found a median of 0.90 indicating a loss of 10% for ΣNr fluxes. As results of this analysis were invariant with changing wind speed and other possible drivers such as z/L, we applied a factor of 1/0.9 to all ΣNr flux values. An example of
and
time series and ogives is given in (further analyses of high-frequency damping using a similar setup can be found in Ammann et al., Citation2012).
Fig. 1. Upper left and lower left panel: Covariance function of vertical wind speed and temperature and covariance function of vertical wind speed and ΣNr concentration measured by the TRANC-CLD system, respectively. Upper right and lower right panel: Normalized flux ogives, i.e. cumulative cospectra of sensible heat and ΣNr flux, respectively. Data were recorded on 7 June 2008, 11:00–11:30 am.
We also observed a small but significant water vapour influence on the CLD signal, probably due to a quenching of the NO chemiluminescence, which consequently affected ΣNr fluxes. For the NO analyser used, a 0.19% NO sensitivity reduction per 1 mmol mol−1 water vapour increase was found. Thus, we corrected every ΣNr flux value [eq. (1)] by adding the term for the water vapour induced NO interference flux (F
NO,int) [eq. (2)]. The latter is defined as follows:2
with being the ΣNr concentration (nmol mol−1) and
being the water vapour flux (mmol m−2 s−1) as was measured by the conventional EC system on the same tower (Anthoni et al., Citation2004). For instance, a cross-sensitivity of −0.038 nmol N (mmol H2O)−1 for a typical background ΣNr concentration of 20 ppb and a water vapour flux of 5 mmol m−2 s−1 was determined, which resulted in F
NO,int of −2.7 ng N m−2 s−1 (see also Ammann et al., Citation2012). However, during the presented Gebesee campaign, the overall balance (Section 3.3) was shifted towards less deposition by only 25 g N ha−1.
In accordance with Ammann et al. (Citation2012), who used the same system at a grassland site in Oensingen, Switzerland, an upper flux detection limit for the Gebesee setup was estimated by using night-time data under stationary conditions, i.e. relatively high wind speeds between 3 and 7 m s−1 and constant wind directions from the homogeneous fetch area southwest of the tower as well as situations with relatively low ΣNr concentrations (<15 ppb). Under these conditions, half-hourly ΣNr fluxes were relatively small. The calculated standard deviation was 3.3 ng m−2 s−1, thus the resulting 2σ-uncertainty range of ~6.6 ng m−2 s−1 may be regarded as an upper flux detection limit for half-hourly values of the TRANC ΣNr eddy-covariance system. The lower detection limit, however, solely depends on the sensitivity of the CLD. Using the same analyser model, Rummel et al. (Citation2002) estimated a flux detection limit due to instrumental noise of 0.07 ng m−2 s−1 for EC measurements of NO.
Night-time data with insufficient turbulence (u *<0.1) were discarded. This filter caused a data loss of 24.1%. As exchange characteristics of ΣNr between ecosystem and atmosphere differ from those of CO2, where night-time gaps are typically filled by fitting a temperature-based respiration model, we used the mean diurnal variation (MDV) method (Falge et al., Citation2001; Moffat et al., Citation2007) to fill all night-time ΣNr flux gaps. A moving window of five consecutive days before and after the missing value was taken to fill the respective gap. As night-time fluxes were comparatively small (see Section 3.2), we estimated the error being induced through the MDV method <6% of the total net ΣNr exchange with a slight tendency towards emission (or lower values of deposition), because low night-time u * mainly occurred when T a was relatively low and surfaces were wetter, i.e. conditions favouring deposition. Those flux cases that passed the u *-filter and were recorded at positive atmospheric stability did never exceed ς=0.05, thus still indicating near-neutral conditions. These situations mainly occurred during night-time when ΣNr fluxes were relatively small and did not significantly contribute to the total ΣNr budget.
Atmospheric stability (ς) was used in the analysis and discussion about controlling factors of ΣNr exchange and was expressed as described in Foken (Citation2008):3
with the Obukhov length (m) being4
where u * is the friction velocity (m s−1), κ is the von Karman constant (=0.4), g is the gravity acceleration (m s−2), T a is the air temperature (K), H is the sensible heat flux (W m−2), and c p is the specific heat of air (J g−1 K−1). Positive values of ς indicate stable conditions, negative values indicate unstable conditions, and values around 0 indicate neutral conditions in the surface layer.
Stomatal conductance (g s ) was used to validate TRANC measurements in the context of canopy resistance modelling. We inferred g s from surface conductance to water vapour transfer at canopy scale and leaf area index (LAI) using the Penman-Monteith approach applied to measured eddy covariance data as described in Lu et al. (Citation2003), Kutsch et al. (Citation2008) and Brümmer et al. (Citation2012).
3. Results and discussion
To specifically study short-term disturbances as well as longer-term ecosystem functioning, data of emission peak events following mineral fertilizer application on the one hand and background exchange on the other hand were analyzed separately. After the first two fertilizer additions on 18 April and 21 May 2008, ΣNr fluxes were significantly elevated compared to pre-fertilization levels for only 3–4 days. After the fertilizer application on 6 June 2008, however, a net release of ΣNr to the atmosphere was observed for several weeks (until August 25) followed by a month of net deposition and another two-week period of net emissions even without previous fertilization. The separation of the entire observation period into net emission and net deposition periods is summarized in .
Table 1. Classification of deposition and emission dominated periods during the measurement campaign from December 2007 to November 2008
3.1. ΣNr concentrations – temporal patterns and controlling factors
3.1.1. Mean diurnal variation.
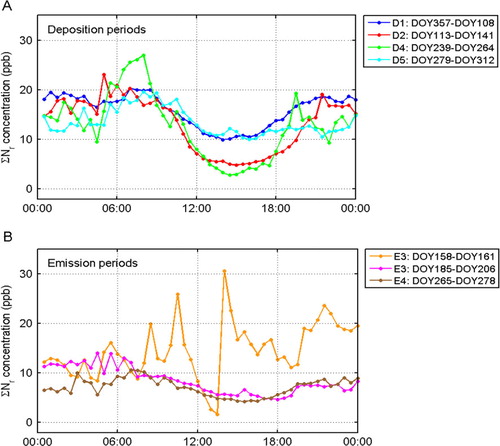
ΣNr concentrations on half-hourly basis were usually between 2 and 70 ppb and between 7 and 23 when averaged over a month (). Clear mean diurnal patterns with highest values around 18 ppb at night and lowest values in early afternoon (~3 ppb) were observed during the growing season and late summer (D2 and D4 in A, respectively) indicating distinct turbulent mixing of the surface layer. Lower daytime ΣNr concentrations during periods like D2, when plants are in a phase of their maximum growth rate, were likely an indicator for atmospheric Nr – presumably NH3 – uptake by the wheat plants as was found by Rogers and Aneja (Citation1980) under increased light and temperature conditions. Furthermore, ΣNr from possible night-time emissions was probably not well mixed into the lower parts of the atmosphere due to a more stable stratification than during daytime. Under these conditions, ΣNr could have also been transported through lateral flow paths from sources other than the investigated agricultural field. A smoother and less clear pattern of mean diurnal ΣNr concentrations was found during October (D5). One reason for this observation – particularly for the relatively low night-time values – might be the fact that already four months passed since the last fertilizer application and a considerable amount of ΣNr had been removed from the atmosphere due to vertical mixing of the planetary boundary layer and relatively low lateral ΣNr input because of homogeneous agricultural land in the whole region without heavy industry and no significant wintertime household heating in residential areas in October/November. Furthermore, manure spreading in the wider vicinity is not done during that time of year, thus keeping the diurnal variability of ΣNr concentrations less dynamic than during the growing season or immediately after fertilization (first part of E3 in B).
Fig. 2. Mineral fertilizer applications (grey bars), field management [harvest (a), tillage (b), and deep tillage with subsequent row forming for potato planting (c)] as well as vegetation height (dark green line) (Panel A), cumulative precipitation (Panel B), daily mean air temperature (red line) and net radiation (black line) (Panel C), half-hourly means of ΣNr concentrations (Panel D), monthly boxplots of ΣNr concentrations with red horizontal lines indicating the median, blue horizontal lines indicating lower and upper quartile values, black whiskers representing the interquartile range and outliers from this range plotted as grey crosses (Panel E), half-hourly means of ΣNr fluxes (Panel F), and monthly boxplots of ΣNr fluxes (Panel G; same colour and line coding as in Panel E) during the observation period from December 2007 to November 2008.
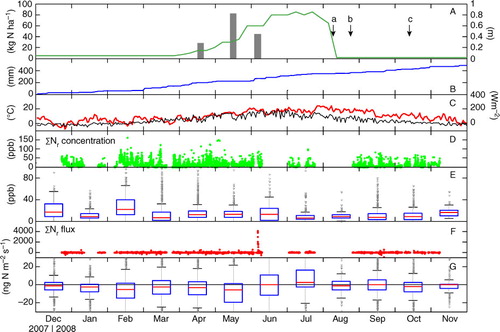
Fig. 3. Mean diurnal variation of ΣNr concentrations separated in periods dominated by deposition (Panel A) and periods dominated by emission (Panel B). Emission period 3 (E3) was divided into sub-sections due to significant changes four days after fertilization.
3.1.2. Comparison of seasonal patterns by TRANC and DELTA.
ΣNr concentrations measured by the TRANC-CLD system were compared with those obtained by DELTA denuders (details are given in Sutton et al., Citation2001; Tang et al., Citation2009), which were measured at the same site within the framework of NitroEurope-IP (Flechard et al. Citation2011). This system integrates gaseous NH3, HNO3, HONO, and aerosol NH4 + and NO3 − over a period of one month. As DELTA denuders measure neither NOx nor organic N compounds (PAN, etc.), we expected TRANC values to be somewhat higher than DELTA values. A shows that this assumption is consistent with the observations, and that the two time series generally revealed similar temporal patterns, which were likely driven by strong seasonal variability of atmospheric turbulent mixing. The difference between the two, however, varied through the year. A discrepancy of up to 10 ppb was observed from December 2007 to May 2008 and from October 2008 to November 2008, whereas the difference during the summer months (June 2008 to September 2008) was small (1–2 ppb). We assume that these differences were caused by the NOx contribution to the ΣNr signal generated from wintertime household heating through domestic coal, which strongly depends on wind direction. A bimodal wind direction pattern at the research site in Gebesee (C) with west–southwest and east–northeast being the main and the second most common wind direction, respectively, was prevalent. The area around the tower (and outside the footprint) is mainly agricultural land with only a few country roads subjected to very low traffic volume. Two kilometres to the north, however, there is the small village of Gebesee, and around 15 km to the south the city of Erfurt with ~200,000 residents is located (B). As shown in D winds are rarely coming from these directions, but if so, ΣNr concentrations were significantly higher (up to 50 ppb) than by winds from the west or east (usually between 20 and 25 ppb). This was particularly the case in February when the discrepancy between TRANC and DELTA values was relatively high as were ΣNr concentrations by winds from the south, thus being an indicator for NOx contributions detected at the site through wintertime heating from residential areas of Erfurt.
Fig. 4. Monthly mean concentrations of ΣNr measured by the TRANC-CLD system (red line) and DELTA denuders (blue line) in ppb (left y-axis). Each dot of the DELTA line represents the sum of NH3, HNO2, HNO3, particulate NO3 and particulate NH4. Monthly mean atmospheric stability ς is shown in grey (right y-axis) (Panel A). Panel B shows a map of the Thuringian Basin with the field site in Gebesee and the City of Erfurt. Mean frequency distribution of wind direction for selected periods and mean frequency distribution of ΣNr concentrations measured by the TRANC-CLD system for selected periods are shown in Panel C and Panel D, respectively.
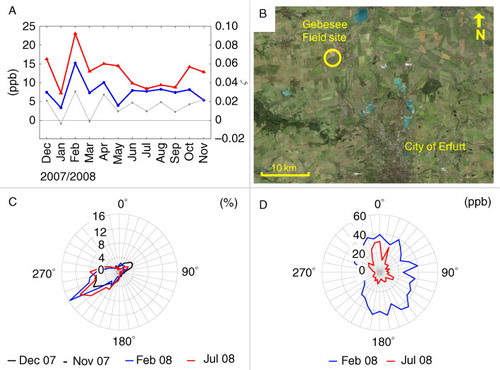
On an annual basis, the mean difference between TRANC and DELTA ΣNr concentrations was observed to be ~5 ppb. This magnitude is completely in the range of annual NO2 values obtained from the EMEP model (Simpson et al., Citation2003; Tuovinen et al., Citation2009; Flechard et al. Citation2011) (see Section 3.2.2) and spatially averaged annual NO2 concentrations from a regional air quality monitoring network of the Federal Environment Agency (UBA) (Gauger, Citation2009), who found ~3–5 ppb and ~5–7 ppb from model runs and measurements, respectively.
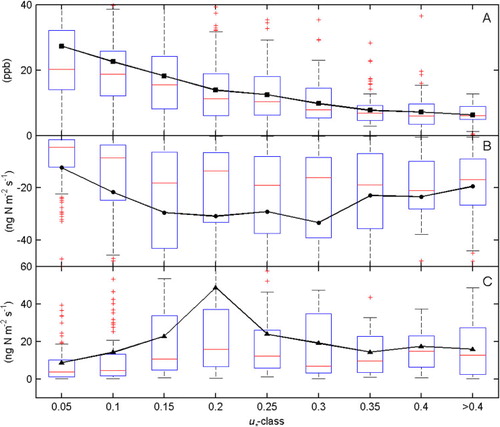
We found a significant correlation (R 2=0.40; p<0.05) between ς and ΣNr concentrations, even when averaged over a month (A). Primarily stable conditions indicated by positive ς values corresponded to relatively high mean ΣNr concentrations (~23 ppb), e.g. in February 2008, whereas neutral to unstable conditions indicated by ς≤0 corresponded to relatively low ΣNr concentrations (≤10 ppb). The same relationship was found when comparing ΣNr concentrations with u * values (A). Bin-averaged low turbulence conditions (u *<0.1 m s−1) were observed when mean ΣNr concentrations were relatively high (>20 ppb), whereas relatively low ΣNr concentrations (<18 ppb) were found during unstable atmospheric conditions (u *>0.2 m s−1) revealing a countercyclical course of ΣNr concentrations (cf. A) and u * on a diurnal basis.
Fig. 5. Dependency of ΣNr concentration (Panel A), ΣNr deposition fluxes (Panel B), and ΣNr emission fluxes (Panel C) on friction velocity (u * in m s−1). All u * data are from the net deposition period D2 (DOY113–DOY141, cf. ) and are bin-averaged into 0.05 m s−1 classes with the black markers representing the arithmetic mean. Red horizontal lines indicate the median, blue horizontal lines indicate lower and upper quartile values, black whiskers represent the interquartile range and outliers from this range are plotted as red crosses.
3.2. ΣNr fluxes
3.2.1. Variability and determinants.
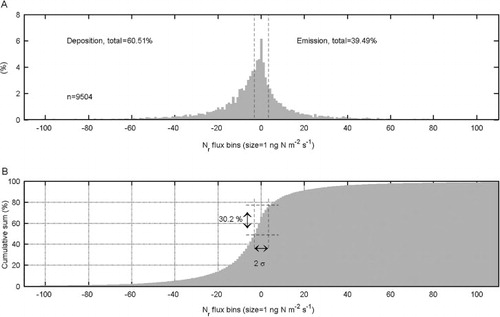
Half-hourly ΣNr fluxes were usually between −40 to 40 ng N m−2 s−1 with single uptake values as low as −175 ng N m−2 s−1 and highest emission values reaching 4132 ng N m−2 s−1 after the fertilization event on 6 June 2008. The frequency distribution in shows that the bulk of the fluxes were within −20 to 20 ng N m−2 s−1 (Σ=3.3 ng N m−2 s−1, cf. Section 2.3) with mostly zero exchange or a small uptake. Around 60.5% of the fluxes were negative, corresponding to deposition of ΣNr.
Fig. 6. Frequency distribution (Panel A) of 30-min ΣNr fluxes from the entire observation period (December 2007 to November 2008). Vertical lines indicate the estimated flux detection limit (σ=3.314 ng m−2 s−1) at −σ and +σ. Panel B shows the cumulative sum of the 30-min ΣNr flux frequency distribution. As indicated by the vertical and horizontal lines, 30.2% of the measured ΣNr fluxes are within the 2σ-sector around zero exchange, i.e. the point where deposition changes to emission or vice versa. Although single flux values were ranging from −166 to 4145 ng m−2 s−1, x-axes are truncated at −110 and +110 ng m−2 s−1 due to only marginal contributions outside these ranges.
We observed high variability in mean diurnal courses of ΣNr fluxes (A and B) between different periods of both deposition and emission phases. While deposition fluxes during winter (D1) and autumn (D5) were virtually zero during night-time and rarely up to 20 ng N m−2 s−1 in the morning hours, higher amplitudes of up to 60 ng N m−2 s−1 (also zero exchange at night, but up to 60 ng N m−2 s−1 in the morning) were found in the growing season (D2) and after harvest in August to September (D4). In deposition period D2, the diurnal progression of ΣNr concentration lagged behind that of ΣNr flux by approximately 5–6 hours (cf. A and B). ΣNr uptake increased shortly after sunrise when ΣNr concentrations were relatively high and likely above the canopy compensation point for NH3 (χ s ), thus promoting Nr uptake (in the form of NH3). Although the N status of crops is usually high, we assume that during this period of maximum plant growth the NH4 + concentration in the apoplast was kept on a relatively low level, because at that time of the year NH4 + uptake reactions (e.g. N transport and NH4 + assimilation) outbalance NH4 +-releasing reactions (e.g. deamination, senescence-induced proteolysis, and NO3 − reduction) thereby favouring NH3 uptake (Schjoerring et al., Citation1998; Francis et al., Citation2008). The daily course of ΣNr uptake was in phase with that of g s , peaking before noon and recovering to its initial level in the afternoon (cf. B and C). Shape and correlation of ΣNr exchange and g s might have been caused by both the fact that water vapour deficit becomes a key limiting factor for stomatal activity around noon and that further uptake of Nr was impeded by already decreased ΣNr concentrations at that time of the day. Furthermore, vertical mixing of the planetary boundary layer likely controlled the diurnal pattern of ΣNr concentration with highest values during night-time and lowest values in the afternoon (cf. Section 3.1). Beside NO2, which can also be consistently taken up via stomata, the shape of the diurnal ΣNr fluxes in the morning hours was – at least on some days – also likely influenced by significant non-stomatal sinks for NH3 such as leaf surface wetness (dew formation, evaporation and rainfall).
Fig. 7. Mean diurnal variation of ΣNr fluxes separated in periods dominated by deposition (Panel A) and periods dominated by emission (Panel B). Due to the logarithmic scale, some negative night-time flux values in a range of −50 to 0 ng N m−2 s−1 are missing in Panel B. As for , emission period 3 (E3) was divided into sub-sections by reason of significant changes in exchange characteristics four days after fertilization.
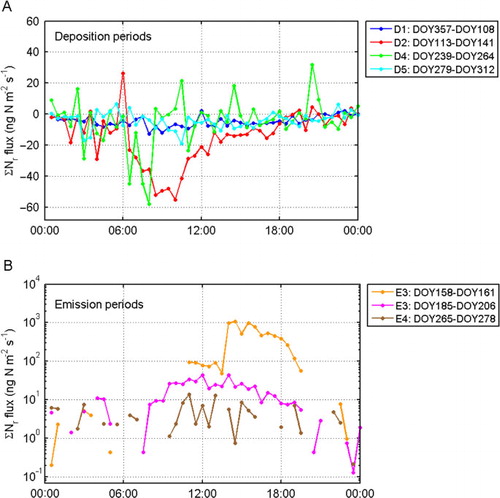
Fig. 8. Mean diurnal variation of ΣNr concentration (Panel A), ΣNr flux (Panel B), stomatal conductance (g s ) (Panel C), ΣNr concentration multiplied by g s (Panel D), and the dependency of ΣNr flux on ΣNr concentration multiplied by g s (Panel E) during deposition phase D2 (DOY113–DOY141).
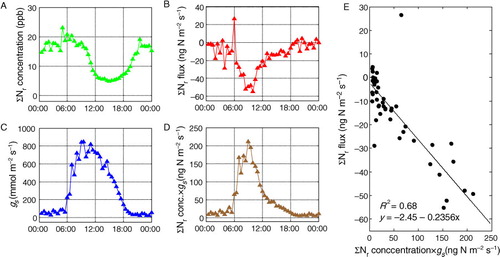
Furthermore, we found a significant correlation (R 2=0.77; p<0.001) between ΣNr fluxes and ΣNr concentrations multiplied by g s for the deposition period D2 with low exchange between −10 and +5 ng N m−2 s−1 occurring when values for Nr concentration multiplied by g s were <50 ng N m−2 s−1 and high uptake (~40–50 ng N m−2 s−1) corresponding to values of ΣNr concentration multiplied by g s >150 ng m−2 s−1 (D and E). This demonstrates that ecosystem–atmosphere matter fluxes – mainly unidirectional deposition fluxes as prevalent in April and May – may be viewed and derived in analogy to Ohm's law, i.e. the flux of a substance is expressed as the ratio of its concentration at measurement height and the resistance against deposition to the ground. In inferential modelling of trace gas dry deposition, where one-point concentrations of any Nr compound are usually determined at lower temporal resolution and at the same time information of temperature, wind speed and direction are available, the resistance term R is commonly composed of the sum of R a , R b , and R c , representing aerodynamic, quasi-laminar layer and canopy resistance, respectively. R c may be further split up into several sub-resistances such as stomatal, mesophyll, cuticle, surface and soil resistances (Grünhage and Haenel, Citation1997; Mohr et al., Citation2005; Sutton et al., Citation2007). This detailed consideration, however, has been neglected in E, where g s only partly represents R c , but it is clear that systematic diurnal patterns of R a and R b are also expected (mostly controlled by u *), with highest R a and R b values during night-time.
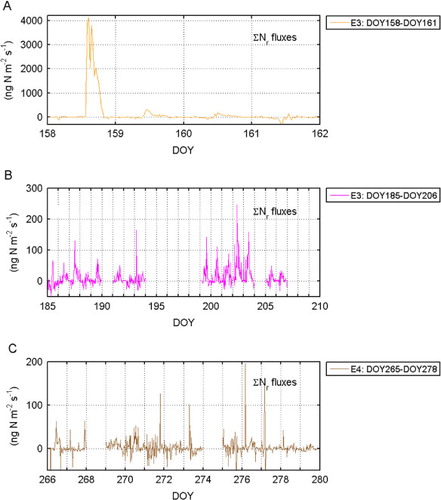
In total, four net ΣNr emission periods with significantly different diurnal patterns were identified (). While after the first two fertilizations (18 April and 21 May 2008) ΣNr fluxes were relatively low (occasionally up to 50 ng N m−2 s−1) and the period of net ΣNr release lasted only for a few days, emissions after the fertilization on June 6 reached average peak values of around 1000 ng N m−2 s−1 in the afternoon during the first four days and decreased to average values of ~70 ng N m−2 s−1 for the rest of emission period E3 (DOY265−278, B). In emission period E4, ΣNr fluxes were ranging on a smaller level between 1 and 20 ng N m−2 s−1. Half-hourly ΣNr fluxes during E3 and E4 are plotted as time series in . The extensive length of emission period E3 (49 days in B) revealed an N saturation of the ecosystem during that time. With the wheat plants reaching maturity, considerable amounts of NH3 were likely released to the atmosphere due to higher concentrations of NH4 + in the apoplast than ambient values of NH3 concentrations. In contrast, ΣNr fluxes after harvest (on DOY218) were significantly lower (in E4) than those during the second part of E3 as a consequence of the missing above-ground biomass pathway for ΣNr.
Fig. 9. Half-hourly ΣNr fluxes following fertilization on 6 June 2008 (DOY158) (Panel A) as well as half-hourly ΣNr fluxes in selected net emission periods before (Panel B) and after harvest (Panel C).
The relationship between bin-averaged u *-data and ΣNr fluxes was analyzed for the net deposition period D2 (B and 5C). As was found for ΣNr concentrations, both half-hourly ΣNr deposition and emission fluxes varied with changing u *. Highest mean deposition fluxes around 35 ng N m−2 s−1 were measured at u *-values of 0.3 m s−1. During low (u *<0.15 m s−1) and high turbulence conditions (u *≥0.35 m s−1), mean deposition rates were significantly lower (<25 ng N m−2 s−1). A similar pattern was observed for mean emission ΣNr fluxes. The u *-class for peak emissions, however, was shifted towards a lower turbulence regime (0.2 m s−1) where mean ΣNr release was observed to be >40 ng N m−2 s−1. These findings correspond well with the mean diurnal flux patterns shown in where highest emission and deposition rates occurred during the day when u *-values are on average significantly higher than during night-time.
3.2.2. Comparison of TRANC-derived ΣNr fluxes with results from inferential modelling.
Monthly sums of ΣNr exchange measured by the TRANC-CLD system were compared with results from four inferential models (). These are four dry deposition routines, which are currently used as modules within chemical transport models at national and continental scales in Europe and North America. They include the UK CBED scheme (Smith et al., Citation2000; Vieno, Citation2005), the Dutch IDEM model (Erisman et al., Citation1994; Bleeker et al., Citation2004; van Jaarsveld, Citation2004), the dry deposition module of the Environment Canada model (Zhang et al., Citation2001, Citation2003), and the surface exchange scheme of the EMEP model used under CLRTAP (Simpson et al., Citation2003; Tuovinen et al., Citation2009). The implemented processes of exchange include the aerodynamic transport from the free atmosphere to the leaf or soil surface, the diffusion through the pseudo-laminar boundary layer, the exchange to/from stomates (diffusion through stomatal apertures, uptake/emission by the apoplast), the transport through the canopy (in-canopy aerodynamic resistance), the non-stomatal deposition to leaf surfaces (with differential treatment for wet and dry conditions) and to soil surfaces (using soil resistance). Dry N deposition simulated in these atmospheric chemistry and transport models is compensated by values of NH3 and NO taken from national emission inventories when applied at regional scale, thereby not directly modelling soil or plant NH3 or NO release except for the CBED scheme, which does account for stomatal NH3 emissions. In our study, we compare results from model applications at field scale where no NH3 and no NO soil emissions were included. All four models use DELTA-based concentrations of NH3, HNO2, HNO3, aerosol NH4 and NO3 as well as NO2 from modelled EMEP 50 km×50 km data as input values. Detailed information about these models and an application to 55 European sites is given in Flechard et al. (Citation2011) and references therein.
Fig. 10. Comparison of monthly sums of N exchange as determined by the TRANC-CLD system (black line) and by four inferential models (cf. Flechard et al., Citation2011), i.e. the UK CBED scheme (CB), the dry deposition module of the Environment Canada model (CD), the surface exchange scheme of the EMEP model used under CLRTAP (EM), and the Dutch IDEM model (ID) (Panel A). Panel B shows the monthly ensemble means of the four models displayed in Panel A with each monthly value being composed of the compounds NH3, HNO3, NO2, particulate NH4, and particulate NO3. Standard deviations of each compound based on these deposition rates are shown in Panel C.
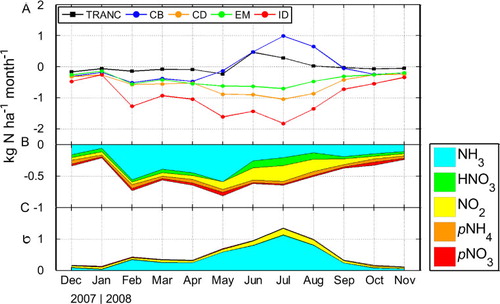
Measured monthly ΣNr values from the TRANC-CLD system were only slightly negative (up to 0.2 kg N ha−1) in the period December 2007 to May 2008. During this time, simulations of the four models resulted in higher uptake rates with monthly peak values from the IDEM-model between 1.0 and 1.7 kg N ha−1. In June, July, and August 2008, monthly net emissions of up to 0.5 kg N ha−1 were measured by the TRANC-CLD system and even higher release rates of up to 1 kg N ha−1 in July 2008 were simulated by the CBED scheme. During these summer months, modelled deposition rates from the three other models (EMEP, IDEM, Environment Canada model) even increased compared to winter and spring values showing monthly uptake of 1.9 kg N ha−1 in July 2008 (IDEM-model). In the following months from September to November 2008, measured and modelled values showed near-neutral exchange to moderate deposition (<1 kg N ha−1). Overall, monthly deposition rates from all models were always higher than measured values from the TRANC-CLD system with less discrepancy in winter months. The only exceptions were July and August 2008 where simulations of the CBED scheme resulted in higher net monthly emissions than those obtained by the TRANC measurements.
It turned out that models (EMEP, IDEM, Environment Canada model) without the implementation of NO or NH3 emission routines significantly overestimate the monthly and consequently the annual sum of Nr deposition at an agricultural site such as Gebesee in comparison to directly measured Nr exchange using the novel TRANC methodology. On one hand, this might indicate that the compensation values in these models that are taken from NO and NH3 emission inventories tend to underestimate the actual Nr exchange thus leading to higher deposition rates. Furthermore, considerable upward fluxes to the atmosphere are likely to be included in the TRANC data throughout the year – either as soil NH3 release under high pH conditions or soil NO emissions through nitrification/denitrification or possibly as emissions from the wheat plants when concentrations of NH4 + in the leaf tissues are somewhat higher than the ‘compensation point’ concentration for NH3 (χ s ). On the other hand, results from the CBED model with a direct soil and plant NH3 emission routine, corresponded much better with the measured values – at least when averaged over an entire annual course. In this comparison, higher deposition in winter and spring is compensated by higher emissions during summer when N fertilizer additions (see chapter 3.3) lead to considerable N-enrichment in the ecosystem (cf. chapter 3.2.1). Consequently – although not matching single monthly Nr exchange values – model types like the CBED scheme appear to be more appropriate and realistic in simulating Nr exchange as both NH3 uptake and release are directly accounted for, consistent with the eddy-covariance based TRANC measurements, where every single TRANC ΣNr flux is a net signal of emission and deposition of ΣNr.
A partitioning into single Nr compounds (NH3, HNO3, NO2, pNH4, pNO3) taken from modelled ensemble mean monthly Nr exchange values (B) revealed that for the most part of the year NH3 formed the largest fraction of total Nr, i.e. ΣNr exchange (between ~40 and 80%). The proportion for NH3 was significantly lower during the summer months from June to August 2008, which was likely due to: (1) lower NH3 concentrations than in spring, (2) plant surfaces were drier and thereby reduced non-stomatal uptake as well as (3) higher T a generally favours stomatal and other emissions (the compensation point is doubled every additional 5K). Another reason is the fact that the numbers presented in B are monthly ensemble means of all four above-mentioned models including the results from the CBED model, which are showing Nr emissions as a consequence of N fertilizer applications in these months and are therefore shifting the NH3 exchange numbers towards a more neutral exchange regime. Furthermore, higher global radiation favours the deposition of NO2, whereas higher soil temperatures during summer months leads to enhanced soil respiration, elevated soil organic matter mineralization, nitrification and/or denitrification followed by NO emission (e.g. Rosenkranz et al., Citation2006). The emitted NO is then oxidized to NO2 by O3, thus offsetting the dry deposition gradient of atmospheric NO2.
3.3. Effect of fertilization on ΣNr exchange
During the first five months of measurements, small but permanent uptake of ΣNr, with a slightly higher rate from April to May than from January to March, was observed (). The net gain of the ecosystem was ~0.6 kg N ha−1 by the end of May 2008. Two shifts in the course of cumulative exchange towards net release of ΣNr to the atmosphere occurred after fertilizer applications on April 18 and May 21 (emission period E1 and E2). These two emission pulses were relatively low compared to the one observed on June 6 corresponding to the third fertilization. ΣNr fluxes exceeded 4000 ng N m−2 s−1 immediately after fertilizer addition and were still elevated up to 300 ng N m−2 s−1 on the following days with clear diurnal patterns showing highest release in early afternoon (see showing time series of ΣNr fluxes during E3 after fertilization and before harvest as well as parts of E4 corresponding to the post-harvest period). ΣNr fluxes recorded on June 6 and the following few days led to an almost entirely compensation of the ΣNr uptake measured until early June.
Fig. 11. Cumulative net ΣNr exchange during the entire observation period from December 2007 to November 2008. The red line indicates the cumulative net ΣNr loss to the atmosphere during net emission periods, the green line indicates the cumulative net ΣNr gain of the plant–soil system during net deposition periods, and the blue line represents the cumulative total net ΣNr exchange. Periods D1–D5 and E1–E4 correspond to naming in .
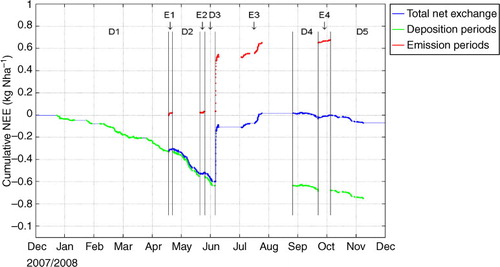
As meteorological conditions on all three fertilization days were similar, the influence of temperature, soil moisture, leaf surface wetness, radiation or atmospheric turbulence as drivers for the clear differences in ΣNr fluxes after fertilizer application can largely be excluded. One possible reason for the considerably different exchange behaviour might be the type of mineral fertilizer applied, i.e. the sole use of calcium ammonium nitrate on June 6, which caused relatively high emissions ( and ) compared to only little ΣNr release when a mixture of calcium ammonium nitrate and ammonium sulfate was used and the presence of sulfur in the form of SO4 2− presumably inhibited the release of Nr compounds (primarily NH3). However, contrasting results about the emission potential of these fertilizer types were reported in former studies. While Jarvis et al. (Citation1989), Shahandeh et al. (Citation1992) and the FAO (Citation2001) support the reasoning that lower emissions were – at least partly – due to sulfate-containing fertilizer, other authors (e.g. Asman, Citation1992; Buijsman, Citation1986; Aneja et al., Citation2003) report on higher emission factors (EF) for ammonium sulfate (9.7%) compared to ammonium nitrate (2.5%). Thus, it is more likely that the timing and developmental stage of the wheat plants had a considerable influence on the amount of ΣNr released on June 6. While fertilizer N was possibly taken up by the wheat plants with high efficiency during the main growth phase in April and May, Nr could be more readily volatilized in June when the wheat plants were already in a mature state. Similar observations, for example, of NH3 emissions from senescing foliage compared with growing leaves have been shown in studies from Farquhar et al. (Citation1979), Harper et al. (Citation1987) and Husted et al. (Citation1996). Also, canopy recapture of soil- and fertilizer-emitted NH3 might have played a role in the variant exchange characteristics after fertilization – particularly between those in April and May where an almost three times higher fertilizer amount applied in May (82.7 kg N ha−1) did not lead to significantly elevated emissions compared to the fertilization in April (28.5 kg N ha−1). According to studies of Nemitz et al. (Citation2000), Denmead et al. (Citation2008) and Bash et al. (Citation2010), closer plant canopies – as was the case in May – are likely to recapture more NH3 than open plant canopies. However, for the June fertilization with a medium quantity of 44.6 kg N ha−1 applied, but followed by the substantial emission rates, maturity effects must have been predominated over canopy recapture effects.
Another emission phase in mid July was observed without prior fertilization (second part of E3, ). As net Nr release to the atmosphere, mainly in the form of NH3, has been reported earlier for both agricultural croplands (Sutton et al., Citation2000) and semi-natural vegetation, e.g. at a dry Dutch heathland site (Erisman and Wyers, Citation1993), the observation of Nr emission in mid-July at the Gebesee site might be the result of N saturation, raising χ s and limiting net deposition, thus being itself an ecosystem response indicating exceedance of the instantaneous crop nitrogen requirement. Also, this short but significant emission phase occurred during a couple of successive dry days, i.e. under conditions favouring emissions in saturated systems as opposed to wet leaf surfaces, which are known for rapid uptake of NH3 (Aneja et al., Citation1986; Duyzer et al., Citation1994) due to the large solubility of ammonia in water.
Direction and amplitude of Nr exchange in periods where no measurements were available due to system breakdowns remain speculative. We assume that almost certainly small Nr uptake would have been registered following the commonly observed non-fertilized pattern, particularly before June 2008 when the biosphere–atmosphere exchange was dominated by Nr input into the ecosystem and a supposed saturation state had not been reached.
The cumulative net ΣNr exchange between the wheat field and the atmosphere by the end of the observation period () resulted in very low deposition of 0.072 kg N ha−1. This value is not significantly different from zero and appears to be small given the fact that expected emissions calculated on the basis of literature emission factors of NH3 accounting for the respective amount and mixture of fertilizer types (Jarvis et al., Citation1989; Shahandeh et al., Citation1992; FAO, Citation2001; Aneja et al., Citation2003) plus reported emissions of NO on fertilized wheat fields (Johansson and Granat, Citation1984; Ludwig et al., Citation2001) would lead to a range between 2.7 and 12.1 kg N ha−1. However, subtracting the background dry deposition of ~4.1 to 11.75 kg N ha−1 as was modelled by Flechard et al. (Citation2011) (cf. Section 3.2.2), the net ΣNr exchange measured by the TRANC-CLD system fits reasonably into the balance between fertilizer-induced Nr emissions and year-round background dry Nr deposition.
Bearing in mind that TRANC-measured fluxes represent the net exchange, i.e. the balance between emission and deposition by turbulent processes, these values cannot be directly compared with pure deposition values determined in other studies, which are usually reported as total, i.e. dry plus wet N deposition. Though highly variable for different land use types and surface characteristics, mean N deposition in Germany was estimated to range between 15 and 18 kg N ha−1 yr−1 (Gauger et al., Citation2002; Heinzeller, Citation2007). N deposition rates at agricultural sites (20 to 48 kg N ha−1 yr−1) are mainly driven by management intensity and distance to pig and poultry farms, in the vicinity of which values up to 85 kg N ha−1 yr−1 (Bartels and Wagener, Citation2005) can be found. Forested areas, particularly those located at edges near adjacent source areas such as cities or agricultural land, also exhibit large N deposition rates due to higher canopy roughness. Friedmann et al. (Citation2001) report on a value of ~32 kg N ha−1 yr−1 for Bavarian forest sites, whereas Mohr et al. (Citation2005) measured 57 kg N ha−1 yr−1 (13 and 44 kg N ha−1 yr−1 attributed to bulk and dry deposition, respectively) above a pine forest in Northern Germany.
Regarding the ΣNr exchange pattern and fluxes in Gebesee (), it seems likely that due to the low values found, Nr emissions – either in the form of NH3 after fertilization or as NO release from soil as an intermediate product of nitrification – compensate for a significant part of the Nr deposition. This also shows that the co-occurrence of both stomatal exchange and leaf surface uptake on the one hand, and soil emissions on the other hand, complicate the interpretation of net Nr flux measurements. However, as continuous long-term measurements of any Nr species are extremely rare, ΣNr data provided by the TRANC-CLD system are nevertheless of major importance for Nr budget estimations, possible revisions of Nr emission factors, and for assessing the productivity of ecosystems by its nutrient N input.
4. Conclusions
With the development of the TRANC, a novel methodology has been provided for both quantifying ΣNr concentrations and a device being robust and fast enough to be applicable in an EC setup for the measurement of ΣNr fluxes when combined with a fast response NO detector (CLD). In this study, we present the first long-term data set of ΣNr net exchange above arable land demonstrating the importance of continuous measurements with high temporal resolution for a better understanding of ecosystem functioning and its controlling parameters. Reasonable agreement and similar seasonal trends were found in a comparison between monthly ΣNr concentrations measured by TRANC and DELTA denuders and filters. Differences could be explained by missing NOx determination in DELTA measurements. Monthly ΣNr net exchange measured by TRANC was fairly in the range of monthly Nr deposition rates obtained from dry deposition inferential modelling. As TRANC values were closest to those from the UK CBED scheme, the significant differences among the four models used were likely due to inadequate treatment of ecosystem Nr emissions in the applied inferential model routines. Distinctive diurnal patterns in ΣNr concentrations and fluxes were observed to be dependent on turbulence, stomatal regulation and non-stomatal sinks for NH3. At the end of the observation period, the net exchange of ΣNr at the Gebesee site was quasi neutral (0.072 kg N ha−1 deposition) with small net deposition through most parts of the year and substantial emissions after one particular fertilization stressing the likely influence of fertilizer type, environmental conditions and maturity stage of the wheat plants during field application. Offsetting emission factor-based calculations of Nr release (~2.7–12.1 kg N ha−1) by modelled background dry deposition (~4.1–11.75 kg N ha−1), the cumulative TRANC-derived exchange provides a reasonable estimate of the site's annual ΣNr budget. However, more research and field campaigns like the present one are needed to: (1) conduct this type of measurement in different ecosystems to better understand ΣNr dynamics on broader scales and (2) possibly further develop the TRANC methodology to be able to differentiate between oxidized and reduced N species to identify factors and drivers of quantitative Nr exchange between biosphere and atmosphere, e.g. NOx contributions from traffic/industry or NH3 from agricultural sources.
5. Acknowledgements
This work was supported by the EU project NitroEurope-IP (Contract 017841) under the EC 6th Framework Program for Research and Technological Development and by the Max Planck Institute for Biogeochemistry (MPI-BGC) in Jena, Germany. We gratefully acknowledge Geratal Agrar GmbH (Andisleben, Thuringia), the owners of the field, and the city council for permitting research activities at the Gebesee site. Dirk Lempio and Catharina Don are thanked for technical support and field assistance. We highly appreciate the help of Jürgen Conrad, Kerstin Gilke and the lab team of the Institute of Agricultural Climate Research (vTI-AK) in Braunschweig, Germany, for running and maintaining the DELTA denuder system.
Related Research Data
References
- Aber J, McDowell W, Nadelhoffer K, Magill A, Berntson G, co-authors. Nitrogen saturation in temperate forest ecosystems: hypotheses revisited. Bioscience. 1998; 48: 921–934. 10.3402/tellusb.v65i0.19770.
- Ammann C, Brunner A, Spirig C, Neftel A. Technical note: water vapour concentration and flux measurements with PTR-MS. Atmos. Chem. Phys. 2006; 6: 4643–4651. 10.3402/tellusb.v65i0.19770.
- Ammann C, Wolff V, Marx O, Brümmer C, Neftel A. Measuring the biosphere-atmosphere exchange of total reactive nitrogen by eddy covariance. Biogeosciences. 2012; 9: 4247–4261. 10.3402/tellusb.v65i0.19770.
- Aneja, V. P, Nelson, D. R, Roelle, P. A, Walker, J. T and Battye, W. 2003. Agricultural ammonia emissions and ammonium concentrations associated with aerosols and precipitation in the southeast United States. J. Geophys. Res. 108(D4): 4152. 10.3402/tellusb.v65i0.19770.
- Aneja V. P, Rogers H. H, Stahel E. P. Dry deposition of ammonia at environmental concentrations on selected plant species. J. Air. Pollut. Contr. Ass. 1986; 36: 1338–1341. 10.3402/tellusb.v65i0.19770.
- Anthoni P. M, Freibauer A, Kolle O, Schulze E.-D. Winter wheat carbon exchange in Thuringia, Germany. Agric. For. Meteorol. 2004; 121: 55–67. 10.3402/tellusb.v65i0.19770.
- Asman, W. A. H. 1992. Ammonia Emission in Europe: Updated Emission and Emission Variations. National Institute of Public Health and Environmental Protection (RIVM): BilthovenThe Netherlands. Report No. 228471008.
- Aubinet M, Grelle A, Ibrom A, Rannik Ü, Moncrieff J, co-authors. Estimates of the annual net carbon and water exchange of forests: the EUROFLUX methodology. Adv. Ecol. Res. 2000; 30: 114–177.
- Bartels, U and Wagener, S. 2005. Nitrogen Deposition in the Münsterland Region (in German). Reports of the State Environmental Agency, Münster. 21. pp.
- Bash J. O, Walker J. T, Jones M, Katul G, Nemitz E, co-authors. Estimation of in-canopy ammonia sources and sinks in a fertilized Zea mays field. Environ. Sci. Technol. 2010; 44: 1683–1689. 10.3402/tellusb.v65i0.19770.
- Bleeker, A, Reinds, G. J, Vermeulen, A. T, de Vries, W and Erisman, J. W. 2004. Critical Loads and Present Deposition Thresholds of Nitrogen and Acidity and Their Exceedances at the Level II and Level I Monitoring Plots in Europe. Energy research Centre of the Netherlands, Petten, The Netherlands. ECN report ECN-C-04-117.
- Brümmer C, Black T. A, Jassal R. S, Grant N. J, Spittlehouse D. L, co-authors. How climate and vegetation type influence evapotranspiration and water use efficiency in Canadian forest, peatland and grassland ecosystems. Agric. For. Meteorol. 2012; 153: 14–30. 10.3402/tellusb.v65i0.19770.
- Buijsman, E. 1986. Historical Trends in Ammonia Emission in Europe (1870–1980). Institute for Meteorology and Oceanography: State University of UtrechtThe Netherlands. Report R-86-9.
- Day, D. A, Wooldridge, P. J, Dillon, M. B, Thornton, J. A and Cohen R. C. 2002. A thermal dissociation laser-induced fluorescence instrument for in situ detection of NO2, peroxy nitrates, alkyl nitrates, and HNO3. J. Geophys. Res. 107(D6). 10.3402/tellusb.v65i0.19770.
- Denmead O. T, Freney J. R, Dunin F. X. Gas exchange between plant canopies and the atmosphere: case-studies for ammonia. Atmos. Environ. 2008; 42: 3394–3406. 10.3402/tellusb.v65i0.19770.
- Duyzer J. H, Verhagen H. L. M, Westrate J. H, Bosveld F. C, Vermetten A. W. M. The dry deposition of ammonia onto a Douglas-fir forest in the Netherlands. Atmos. Environ. 1994; A28: 1241–1253. 10.3402/tellusb.v65i0.19770.
- Erisman, J. W, Mennen, M. G, Fowler, D, Flechard, C. R, Spindler, G. and co-authors. 1996. Towards Development of a Deposition Monitoring Network for Air Pollution in Europe. RIVM: The Netherlands. Report no. 722108015. Online at: http://rivm.openrepository.com/rivm/bitstream/10029/10432/1/722108015.pdf..
- Erisman J. W, Otjes R, Hensen A, Jongejan P, van den Bulk P, co-authors. Instrument development and application in studies and monitoring of ambient ammonia. Atmos. Environ. 2001; 35: 1913–1922. 10.3402/tellusb.v65i0.19770.
- Erisman J. W, van Pul A, Wyers P. Parameterization of surface resistance for the quantification of atmospheric deposition of acidifying pollutants and ozone. Atmos. Environ. 1994; 28: 2595–2607. 10.3402/tellusb.v65i0.19770.
- Erisman J. W, Wyers G. P. Continuous measurements of surface exchange of SO2 and NH3: implications for their possible interaction in the deposition process. Atmos. Environ. 1993; A27: 1937–1949.
- Falge E, Baldocchi D, Olson R, Anthoni P, Aubinet M, co-authors. Gap filling strategies for long term energy flux data sets. 2001; 107: 71–77. 10.3402/tellusb.v65i0.19770.
- FAO (Food and Agriculture Organization of the United Nations) and IFA (International Fertilizer Industry Association). 2001. Global Estimates of Gaseous Emissions of NH3, NO and N2O from Agricultural Land. International Fertilizer Industry Association: RomeItaly. ISBN 92-5-104689-1.
- Farmer D. K, Wooldridge P. J, Cohen R. C. Application of thermal-dissociation laser induced fluorescence (TD-LIF) to measurement of HNO3, Σalkyl nitrates, Σperoxy nitrates, and NO2 fluxes using eddy covariance. Science. 2006; 6: 3471–3486. 10.3402/tellusb.v65i0.19770.
- Farquhar G. D, Wetselaar R, Firth P. M. Ammonia volatilization from senescing leaves of maize. Atmos. Chem. Phys. 1979; 203: 1258–1275. 10.3402/tellusb.v65i0.19770.
- Flechard C. R, Nemitz E, Smith R. I, Fowler D, Vermeulen A. T, co-authors. Dry deposition of reactive nitrogen to European ecosystems: a comparison of inferential models across the NitroEurope network. 2011; 11: 2703–2728. 10.3402/tellusb.v65i0.19770.
- Foken T. Micrometeorology. Springer, Heidelberg, Germany. 2008; 308.
- Fowler D, Coyle M, Flechard C, Hargreaves K. J, Nemitz E, co-authors. Advances in micrometeorological methods for the measurement and interpretation of gas and particle nitrogen fluxes. 2001; 228: 117–129. 10.3402/tellusb.v65i0.19770.
- Francis D. D, Vigil M. F, Mosier A. R. Gaseous losses of nitrogen other than through denitrification. Nitrogen in Agricultural Systems. Schepers J. S.Raun W. R.American Society of Agronomy: Madison WI, 2008; 255–280.
- Friedmann, L, Rosenwirth, W and Meier, D. 2001. Nitrate Report Bavaria, 1996–1999 (in German). Reports of the Bavarian State Office for Water Management, Munich, 35. pp.
- Gauger, T. 2009. Acquisition, Projection and Assessment of Matter Fluxes and Their Impacts on Ecosystems in Germany (in German). Final report of the MAPESI project ‘Modelling of Air Pollutants and EcoSystem Impact’ by order of the German Federal Environment Agency (UBA), Grant No. 3707 64 200, 32. pp.
- Gauger, T, Anshelm, F, Schuster, H, Draaijers, G. P. J, Bleeker, A. and co-authors. 2002. Mapping of Ecosystem Specific Long-Term Trends in Deposition Loads and Concentrations of Air Pollutants in Germany and Their Comparison with Critical Loads and Critical Levels. Part 1: Deposition Loads 1990–1999. Institute of Navigation, Stuttgart University. BMU/UBA. , FE No. 299 42 210, 207. pp.
- Grünhage L, Haenel H.-D. PLATIN (PLant-ATmosphere INteraction) I: a model of plant-atmosphere interaction for estimating absorbed doses of gaseous air pollutants. Agron. J. 1997; 98: 37–50. 10.3402/tellusb.v65i0.19770.
- Harper L. A, Sharpe R. R, Langdale G. W, Giddens J. E. Nitrogen cycling in a wheat crop: soil, plant and aerial nitrogen transport. 1987; 79: 965–973. 10.3402/tellusb.v65i0.19770.
- Heinzeller, C. 2007. Regionalization of Nitrate Export from Forests in Germany (in German). PhD Thesis. University of Freiburg, Freiburg, Germany.
- Husted S, Mattsson M, Schjoerring J. K. Ammonia compensation points in two cultivars of Hordeum vulgare L. during vegetative and generative growth. Plant. Cell. Environ. 1996; 19: 1299–1306. 10.3402/tellusb.v65i0.19770.
- van Jaarsveld, J. A. 2004. The Operational Priority Substances Model. Description and validation of OPS-Pro 4.1. RIVM, Bilthoven, The Netherlands. RIVM report 500045001/2004.
- Jarvis S. C, Hatch D. J, Lockyer D. R. Ammonia fluxes from grazed grassland – annual losses from cattle production systems and their relation to nitrogen inputs. J. Agric. Sci. 1989; 113: 99–108. 10.3402/tellusb.v65i0.19770.
- Johansson C, Granat L. Emission of nitric oxide from arable land. Tellus. 1984; 36B: 25–37. 10.3402/tellusb.v65i0.19770.
- Kita K, Morino Y, Kondo Y, Komazaki Y, Takegawa N, co-authors. A chemical ionization mass spectrometer for ground-based measurements of nitric acid. J. Atmos. Ocean. Tech. 2006; 23: 1104–1113. 10.3402/tellusb.v65i0.19770.
- Kutsch W. L, Aubinet M, Buchmann N, Smith P, Osborne B, co-authors. The net biome production of full crop rotations in Europe. Agr. Ecosyst. Environ. 2010; 139: 336–345. 10.3402/tellusb.v65i0.19770.
- Kutsch W. L, Hanan N, Scholes B, McHugh I, Kubheka W, co-authors. Regulation of carbon fluxes and canopy conductance in a savanna ecosystem. Biogeosciences. 2008; 5: 1797–1808. 10.3402/tellusb.v65i0.19770.
- Lu P, Yunusa I. A. M, Walker R. R, Müller W. J. Regulation of canopy conductance and transpiration and their modelling in irrigated grapevines. Funct. Plant Biol. 2003; 30: 689–698. 10.3402/tellusb.v65i0.19770.
- Ludwig J, Meixner F. X, Vogel B, Förstner J. Soil–air exchange of nitric oxide: an overview of processes, environmental factors, and modelling studies. Biogeochemistry. 2001; 52: 225–257. 10.3402/tellusb.v65i0.19770.
- Marx O, Brümmer C, Ammann C, Wolff V, Freibauer A. TRANC – a novel fast-response converter to measure total reactive atmospheric nitrogen. Atmos. Meas. Tech. 2012; 5: 1045–1057. 10.3402/tellusb.v65i0.19770.
- Moffat A. M, Papale D, Reichstein M, Hollinger D. Y, Richardson A. D, co-authors. Comprehensive comparison of gap-filling techniques for eddy covariance net carbon fluxes. 2007; 147: 209–232. 10.3402/tellusb.v65i0.19770.
- Mohr, K, Meesenburg, H, Horvárth, B, Meiwes, K. J, Schaaf, S. and co-authors. 2005. Determination of Ammonia Input from the Air and Its Effect on Forest Ecosystems (in German). Landbauforschung Völkenrode – FAL Agricultural Research, Braunschweig Völkenrode. Special Issue 279, ISSN 0376-0723.103. pp.
- Munger J. W, Wofsy S. C, Bakwin P. S, Fan S.-M, Goulden M. L, co-authors. Atmospheric deposition of reactive nitrogen oxides and ozone in a temperate deciduous forest and a subarctic woodland, 1. Measurements and mechanisms. Agric. For. Meteorol. 1996; 101(D7): 639–657. 10.3402/tellusb.v65i0.19770.
- Nemitz E, Sutton M. A, Gut A, San Jose R, Husted S, co-authors. Sources and sinks of ammonia within an oilseed rape canopy. Glob. Change Biol. 2000; 105: 385–404. 10.3402/tellusb.v65i0.19770.
- Ollinger S. V, Aber J. D, Reich P. B, Freuder R. J. Interactive effects of nitrogen deposition, tropospheric ozone, elevated CO2 and land use history on the carbon dynamics of northern hardwood forests. Plant Soil. 2002; 8: 545–562. 10.3402/tellusb.v65i0.19770.
- Rogers H. H, Aneja V. P. Uptake of atmospheric ammonia by selected plant-species. J. Geophys. Res. 1980; 20: 251–257. 10.3402/tellusb.v65i0.19770.
- Rosenkranz P, Brüggemann N, Papen H, Xu Z, Horvarth L, co-authors. Soil N and C trace gas fluxes and microbial soil N turnover in a sessile oak (Quercus petraea (Matt.) Liebl.) forest in Hungary. Atmos. Environ. 2006; 286: 301–322. 10.3402/tellusb.v65i0.19770.
- Rummel, U, Ammann, C, Gut, A, Meixner, F. X and Andreae, M. O. 2002. Eddy covariance measurements of nitric oxide flux within an Amazonian rain forest. Boundary-Layer Meteorol. 107: 8050. 10.3402/tellusb.v65i0.19770.
- Schjoerring J. K, Husted S, Mattsson M. Physiological parameters controlling plant-atmosphere ammonia exchange. 1998; 32: 491–498. 10.3402/tellusb.v65i0.19770.
- Schmid H. P. Source areas for scalars and scalar fluxes. Commun. Soil Sci. Plant Anal. 1993; 67: 293–318. 10.3402/tellusb.v65i0.19770.
- Seinfeld J. H, Pandis S. N. Atmospheric Chemistry and Physics – From Air Pollution to Climate Change2nd ed. John Wiley & Sons, Inc.: HobokenNew Jersey, 2006; 1232.
- Shahandeh H, Cabrera M. L, Sumner M. E. Ammonia volatilization from urea, ammonium sulfate, and nutrasweet sludge in bare and straw-covered soils. 1992; 23: 775–786. 10.3402/tellusb.v65i0.19770.
- Simpson D, Butterbach-Bahl K, Fagerli H, Kesik M, Skiba U, co-authors. Deposition and emissions of reactive nitrogen over European forests: a modelling study. Atmos. Meas. Tech. 2006; 40: 5712–5726. 10.3402/tellusb.v65i0.19770.
- Simpson, D, Fagerli, H, Jonson, J. E, Tsyro, S, Wind, P. and co-authors. 2003. Transboundary Acidification, Eutrophication and Ground Level Ozone in Europe. Part I: Unified EMEP Model Description. Det Meteorologisk Institutt: Oslo. EMEP Status Report, ISSN 0806–4520.
- Sintermann J, Spirig C, Jordan A, Kuhn U, Ammann C, co-authors. Eddy covariance flux measurements of ammonia by high temperature chemical ionisation mass spectrometry. Plant Soil. 2011; 4: 599–616. 10.3402/tellusb.v65i0.19770.
- Smith R. I, Fowler D, Sutton M. A, Flechard C, Coyle M. Regional estimation of pollutant gas deposition in the UK: model description, sensitivity analyses and outputs. Environ. Pollut. 2000; 34: 3757–3777. 10.3402/tellusb.v65i0.19770.
- Sutton M. A, Milford C, Nemitz E, Theobald M. R, Hill P. W, co-authors. Biosphere-atmosphere interactions of ammonia with grasslands: experimental strategy and results from a new European initiative. Agric. For. Meteorol. 2001; 228: 131–145. 10.3402/tellusb.v65i0.19770.
- Sutton M. A, Nemitz E, Erisman J. W, Beier C, Butterbach-Bahl K, co-authors. Challenges in quantifying biosphere-atmosphere exchange of nitrogen species. 2007; 150: 125–139. 10.3402/tellusb.v65i0.19770.
- Sutton M. A, Nemitz E, Milford C, Fowler D, Moreno J, co-authors. Micrometeorological measurements of net ammonia fluxes over oilseed rape during two vegetation periods. Agr. Ecosyst. Environ. 2000; 105: 351–369. 10.3402/tellusb.v65i0.19770.
- Tang Y. S, Simmons I, van Dijk N, Di Marco C, Nemitz E, co-authors. European scale application of atmospheric reactive nitrogen measurements in a low-cost approach to infer dry deposition fluxes. Ann. Forest Sci. 2009; 133: 183–195. 10.3402/tellusb.v65i0.19770.
- Tuovinen J.-P, Emberson L, Simpson D. Modelling ozone fluxes to forests for risk assessment: status and prospects. 2009; 66(4): 401.10.3402/tellusb.v65i0.19770.
- Vieno, M. 2005. The Use of an Atmospheric Chemistry-Transport Model (FRAME) over the UK and the Development of Its Numerical and Physical Schemes. PhD Thesis. University of Edinburgh, Edinburgh..
- Vitousek P. M, Aber J. D, Howarth R. W, Likens G. E, Matson P. A, co-authors. Human alteration of the global nitrogen cycle: sources and consequences. Atmos. Chem. Phys. 1997; 7: 737–750.
- Zhang L, Brook J. R, Vet R. A revised parameterization for gaseous dry deposition in air-quality models. Atmos. Environ. 2003; 3: 2067–2082. 10.3402/tellusb.v65i0.19770.
- Zhang L, Gong S, Padro J, Barrie L. A size-segregated particle dry deposition scheme for an atmospheric aerosol module. J. Geophys. Res. 2001; 35: 549–560. 10.3402/tellusb.v65i0.19770.
- Zhang, L, Vet, R, O'Brien, J. M, Mihele, C, Liang, Z. and co-authors. 2009. Dry deposition of individual nitrogen species at eight Canadian rural sites. Atmos. Environ. 114: D02301. 10.3402/tellusb.v65i0.19770.
- Zimmermann F, Plessow K, Queck R, Bernhofer C, Matschullat J. Atmospheric N- and S-fluxes to a spruce forest – comparison of inferential modelling and the throughfall method. Agric. For. Meteorol. 2006; 40: 4782–4796. 10.3402/tellusb.v65i0.19770.