Abstract
Three years of aerosol particle number concentrations (PNCs), size distributions and vertical particle fluxes measured at the semi-urban SMEAR III station in Helsinki, Finland, were studied. The purpose is to study the local emission sources and their effect on particle concentrations and size distributions. By means of cluster analysis, six representative size distributions were identified. Their occurrence together with particle concentrations and fluxes were found to vary significantly with wind direction. Lower particle concentrations and fluxes were measured downwind from vegetated and residential areas compared to directions where the measurement site is downwind from roads passing near the measurement site. For these directions, contributions of the local sources on the measured particle concentrations and size distributions were evident. In particular, size distributions with a mode in the size range 20–40 nm were found to be more affected by local traffic emissions, whereas the mode shifted towards larger sizes when contribution from distant sources was more evident. Using flux footprint functions, mixed vehicle fleet emission factors (EFs) were derived from the particle flux measurements. EFs of 6.03 (±0.19)·1014 # Veh−1 km−1 and 3.65 (±0.12)·1014 # Veh−1 km−1 were estimated for cold (October–March) and warm (April–September) periods, respectively. Emission factors increased with decreasing air temperature (T) following a linear relationship EF=−0.20·1014 # Veh−1 km−1°C−1 T+6.98·1014 # Veh−1 km−1 (RMSE=3.7·1014 # Veh−1 km−1).
1. Introduction
It is widely recognised that particulate air pollution can affect human respiratory and cardiology health (Pope and Dockery, Citation2006). Therefore, urban areas act as hotspots for health risks as both particle sources and human population are concentrated in these areas. The scientific research on particulate matter (PM) in the urban environment has provided a background for governments to recognise and to face the problem. PM emission limits for main anthropogenic sources and monitoring programmes of urban air have been established and implemented (e.g. European Union directive Citation2008/50/EC and European Union directive Citation2008/1/EC). In the last decade, scientific research has focused on the ultrafine fraction of ambient particles (UFP; particle diameter d p<0.1 µm) as emerging epidemiological and toxicological evidence indicate particle toxicity to be dependent on particle size, with increasing capacity to affect human health with decreasing particle size (Hoek et al., Citation2010; Franck et al., Citation2011). UFP accounts for the majority of ambient particles in terms of number, yet they contribute little to the overall particulate mass. Consequently, they are scarcely represented by standard PM measurements (Sioutas et al., Citation2005).
Road traffic is reported to be the main source of UFP in urban areas (e.g. Hussein et al., Citation2005; Jonsson et al., Citation2011). UFP are directly emitted as a combustion by-product or formed in secondary reactions from vehicle exhausts immediately after their release in the atmosphere (Morawska et al., Citation2008). Other important urban sources of UFP's are combustion processes for energy demand (either power plants or residential scale combustion) and industrial processes (Young and Keeler, Citation2007; Pey et al., Citation2009). Moreover, ship emissions are reported as UFP sources in coastal cities where important harbours are located (González et al., Citation2011; Mueller et al., Citation2011). Besides primary emissions, UFP can originate from secondary formation in the atmosphere through nucleation of gaseous precursors (e.g. Hussein et al., Citation2008; Salma et al., Citation2011). UFP number concentrations as well as particle number size distributions (PNSDs) show high spatial variability within a city, which is mostly related to the presence of strong local sources such as road traffic emissions, and to the short lifetime of UFP (Ketzel et al., Citation2004; Tuch et al., Citation2006; Pohjola et al., Citation2007; Wang et al., Citation2011). Despite the increasing number of studies concerning PNSD in cities, the available knowledge on urban UFP appears still scarce compared with the complexity and variability of the phenomenon. In particular, the comprehension of the relationship between particle sources and ambient UFP levels appears incomplete. Such information is required for orienting future air quality policies as well as for developing urban scale air quality models. In this context, the eddy covariance (EC) technique has recently been applied in a few cities to directly measure particle number exchange between the surface and the atmosphere (e.g. Martin et al., Citation2009; Järvi et al., Citation2009b; Contini et al., Citation2012). It gives the net particle flux transported by turbulent eddies to/from a wider surface area called the footprint, and it can be used to study the strength and distribution of particle sources and sinks. Previous studies have shown the urban surface to act as a net source for UFP, but strong dependence on different urban surface cover types has been observed (Mårtensson et al., Citation2006; Järvi et al., Citation2009b). A close relationship between UFP fluxes and traffic intensity has been found and EC measurements have been used to derive real-world emission factors (EF) for a mixed vehicle fleet (Mårtensson et al., Citation2006; Järvi et al., Citation2009b; Vogt et al., Citation2011). Although urban areas have been found to act as a source for total particle number, the size-resolved fluxes of accumulation mode particles has shown how certain sizes can deposit to urban surfaces (Schmidt and Klemm, Citation2008; Harrison et al., Citation2012). Such information on smaller particles does not exist as size-resolved UFP fluxes have not been directly measured in urban areas.
Simultaneous monitoring of PNSD and particle fluxes could provide information about the ambient particle concentrations and their emission sources as the two metrics represent different source areas. The concentration footprint is commonly larger than the flux footprint (Vesala et al., Citation2008a), thus distant sources can contribute to particle concentrations without influencing particle fluxes. Therefore, differences in their behaviour can be used to distinguish different particle sources or sinks.
In this study, we analyse simultaneous measurements of PNSD, UFP vertical fluxes (F p) and meteorological parameters carried out at the urban measurement station SMEAR III in Helsinki, Finland, over three years from January 2008 to December 2010. Previously, the particle concentrations and fluxes have been found to represent different urban surface types in different wind directions at the site (Järvi et al., Citation2009a, Citation2009b), and cluster analysis has shown how the PNSDs in the size range 7–950 nm can be represented using six group (clusters) signatures of certain particle sources or atmospheric processes (Wegner et al., Citation2012). We want to further extend the analysis of the different particle sources and sinks at the site by combining the analysis of the PNSD (including cluster analysis) and F p in order to examine the spatial and temporal variabilities of particle sources and sinks affecting our measurements. Particularly, we try to extract the effect of local sources from the observed particle number concentrations (PNC) and will characterise the most important local particle source (i.e. road traffic) by deriving real-time particle number emission factors for a mixed vehicle fleet in different temperatures.
2. Materials and methods
2.1. Measurement site
The measurements were carried out at the semi-urban measurement station SMEAR III in Helsinki, Finland (60°12N′, 24°57′E, Järvi et al., Citation2009a). The Helsinki Metropolitan Area, located on the shore of the Baltic Sea, covers an area of 765 km2 with about 1 million inhabitants. Besides traffic emissions, other important particle sources in the metropolitan area are combustion in energy production, industrial and shipping activity (Malkki et al., Citation2011). The high demand of heating during colder months is mainly covered by district heating supplied by power plants. Three large power plants and nine smaller heat plants using coal or natural gas are located in Helsinki. However, in some residential areas, oil/wood stoves are used in addition to the district heating. Emissions from the large power plants released at about 150 m height above ground are expected to marginally impact the ground-level air quality within the city. On the contrary, emissions from small-scale combustions have been reported to locally affect particulate levels (Saarikoski et al., Citation2008; Saarnio et al., Citation2012). Long-range transported pollutants from forest and wild fires in Russia and Eastern Europe can occasionally contribute to the particle concentration in the area typically during Spring, increasing the concentration of accumulation mode particles (d p>0.100 µm) (Niemi et al., Citation2005; Citation2009). Moreover, as typically in sub-arctic cities, bad air quality events occur mainly during inversion situations in winter or in late winter/spring due to high concentration of fine and coarse particles from road dust re-suspension (Kupiainen et al., Citation2011).
The SMEAR III station site is located on the top of a rocky hill; at the University of Helsinki campus in a suburban area about 4 km north of the Helsinki city centre (). The surroundings of the measurement site can be divided into three surface cover areas: road, vegetation and built. In the road area (40–180°), one of the main roads leading to downtown Helsinki, with a traffic rate of 44 000 vehicles per workday, passes at a distance of 150–270 m from the site. The area between is covered with deciduous forest which might act as a buffer for aerosol particle emissions from the road during summer. This sector is also characterised as an area of high pollutant emissions from road traffic (Hussein et al., Citation2004; Järvi et al., Citation2009a, Citation2009b). In the vegetation area (180–320°), the closest 600 m from the site is characterised by a valley with high fraction of vegetation cover, including an allotment and a University Botanical garden. Beyond this green belt, an urban area with small roads and residential buildings starts. In this direction at a distance of about 1 km a heavily trafficked road (Mäkelänkatu) is located. In the built area (320–40°), the university campus with buildings and parking lots is located next to the station. The mean height of the buildings is 20 m and the closest one of them is located 55 m from the station. Further away, residential areas with detached houses equipped with small-scale combustion devices are located.
Fig. 1 Aerial photograph of the measurement site and the six sectors identified based on differences in cluster occurrences. Please note that the six sectors differ from the three areas [road (40–180°), vegetation (180–320°) and built (320–40°)] in which can be divided the surroundings of the station based on different surface cover.
![Fig. 1 Aerial photograph of the measurement site and the six sectors identified based on differences in cluster occurrences. Please note that the six sectors differ from the three areas [road (40–180°), vegetation (180–320°) and built (320–40°)] in which can be divided the surroundings of the station based on different surface cover.](/cms/asset/aaf33e13-c5e7-462e-8224-00ad067cb572/zelb_a_11817214_f0001_ob.jpg)
The measurements of the vertical particle fluxes were made on top of a 31-m high triangular lattice tower. The flux measurements are made 1.5 times the mean building height in the built area and therefore in this direction can partially be affected by the properties of the roughness sublayer. PNC and size distributions were measured 4 m above the ground next to the tower where an air-conditioned container is located. The meteorological measurements were made at 26 m above the ground on the roof top of a university building located 220 m away from the tower and the measurement container.
2.2. Measurements
2.2.1. PNC and size distribution.
PNC and size distributions in the size range of 3–950nm were measured using a Twin Differential Mobility Particle sizer (Twin DMPS; Aalto et al., Citation2001). The DMPS apparatus consists of a bipolar charger to bring the particles into a well-known charge distribution, a differential mobility analyser (DMA) to classify particles according to their electrical mobility and a condensation particle counter (CPC) to count the selected particles. In the twin setup, one DMPS measures particles with mobility diameters in the size range 3–50nm (DMA length: 10.9cm, TSI 3025 CPC), and the other in the size range 10–950nm (DMA length: 28cm, TSI 3010 CPC). More information about the measurements’ setup can be found in Aalto et al. (Citation2001).
2.2.2. Particle flux.
The turbulent vertical fluxes of aerosol particle number were measured using the EC technique. The sampling instrumentation consists of a Metek ultrasonic anemometer (USA-1, Metek GmbH, Germany) to measure all the three wind velocity components and sonic temperature, and a water-based condensation particle counter (WCPC, TSI-3781, TSI Inc., USA) to measure aerosol PNC (Järvi et al., Citation2009b). The 50% cut-off diameter of the WCPC is 6nm. All measurements were recorded with 10Hz frequency. The air inlet covered with a 6mm diameter filter (mesh: 0.1mm) and a rain protection is located 13cm below the anemometer. After the inlet, the air sample is drawn through a 40m long steel tube (inner diameter: 8mm) that serves several instruments, and the side flow to the WCPC is derived at a distance of 3.6m from the inlet through a 0.1m long tube.
The particle fluxes (F
p) were calculated over periods of 30 minutes as covariance between fluctuations in vertical wind speed w′ and particle number concentration N′1
where the overbar refers to time average. Prior to the calculation of the 30-minute fluxes, raw data were de-spiked, linearly de-trended, and a two-dimensional coordinate rotation was applied. The computed fluxes were then corrected for losses at the high- and low-frequency ends of co-spectra. In addition, several quality assurance tests including a stationarity test, flux kurtosis and skewness, were run. System malfunction covered 21% of the data and after the quality assurance, 33% of flux data was used in the analysis. A detailed description of raw data post-processing and quality assurance can be found in Järvi et al. (Citation2009b) and Nordbo et al. (Citation2012).
2.2.3. Auxiliary meteorological measurements.
Meteorological variables with 4-minute resolution were measured on top of the University building about 200 m north-east from the tower. Air temperature, relative humidity and air pressure were measured using a platinum-resistance thermometer, a thin-film polymer sensor and a barometer (HMP243, Vaisala Oyj, Vantaa, Finland), respectively. Wind speed was measured using a cup anemometer (WAA141, Vaisala Oyj, Vantaa, Finland), and a weighting rain gauge (Ott Pluvio, Ott Hydromet GmbH, Kempten, Germany) was used to measure precipitation.
2.2.4. Traffic data.
On-line traffic counts measured on a highway (Itäväylä) located a few kilometres east of the measurement site were used in the analysis. Good correlation between traffic on the Itäväylä highway and traffic on the road next to the measurement site was shown by comparative campaigns with Tr site=0.94Tr offsite+49.3, R2=0.76, RMSE=381.3Vehh−1 (N=840) (Järvi et al., Citation2012). Traffic counts applied in this study were corrected according to the linear relationship in the traffic counts between the two roads. The data were recorded with hourly resolution excluding the rush hours when 15-minute resolution was used, and no classification on vehicle type was made. In the analysis, time resolution was converted to half an hour for homogeneity with the other parameters. Missing traffic counts have been filled according the procedure described in Järvi et al. (Citation2012).
2.3. Data processing
2.3.1. Cluster analysis.
Cluster analysis is a statistical tool for data reduction, which classifies the observations into homogenous groups (clusters) whose observations are similar within the group and different between the groups (MacQueen, Citation1967; Jain et al., Citation1999). This statistical tool has shown to be suitable for applications to particle size distribution data in order to reduce their complexity and to identify representative PNSDs (Charron et al., Citation2008; Beddows et al., Citation2009; Dall'Osto et al., Citation2011; Wegner et al., Citation2012). In this study, the cluster analysis was applied to half-an-hour median PNSDs computed from the raw data of 3 years of DMPS observations. To avoid using the most uncertain part of the data, the particle distribution was restricted to the size range 7–950 nm. The clustering was performed using the k-means algorithm following the procedure suggested by Beddows et al. (Citation2009) and tested for the Helsinki site in a previous study (Wegner et al., Citation2012). The algorithm was tentatively initialised with each k number of cluster in the range k [2, 20], then the optimum number of clusters was chosen according to the maximisation of Dunn index values. The Dunn index reports the compactness of each cluster and the separation between the clusters. Beddows et al. (Citation2009) identified the Dunn index as the most useful parameter for this type of application.
2.3.2. Flux footprint and emission factor.
The EC technique gives the net aerosol particle flux from/to a certain area called a footprint (or source area). The source area is that fraction of the surface including effective sources and sinks that contribute to the conducted measurements. It depends on surface characteristics (e.g. surface roughness) and atmospheric conditions, particularly the mixing of the atmosphere. Also concentration measurements represent a source area, which is different from the flux footprint (Vesala et al., Citation2008a). EC measurements consider only turbulent transport, whereas concentration measurements take also into account transport by the mean flow. Thus, concentration footprints are typically larger than their flux counterparts. In order to understand the processes affecting the measured flux, the source area needs to be determined and this is particularly important over complex terrain such as urban landscape, where the sinks and sources are heterogeneously distributed. However, current footprint models cannot properly solve the source areas in complex terrain and the given footprints are only indicative. In this study, an analytical footprint model by Korman and Meixner (Citation2001) was used to give estimations for the flux footprints. We created footprint look-up tables for three different surface roughnesses representing the different surface cover areas (i.e. road, vegetation, built), and for a range of meteorological variables observed at the measurement site. These were the stability parameter derived from the flux measurements, the wind speed and the standard deviation of the lateral wind speed. Subsequently, for each 30-minute flux value the cross-wind integrated footprint function Fy (x) was assigned according to the prevailing wind direction and meteorological condition.
Moreover, F
y
(x) were used to get estimations for particle number emission factors for mixed fleet traffic. The estimation of EF from turbulent flux measurements requires calculation of the line source strength L(a) at the distance of the road using equation (Järvi et al., Citation2009b)2
where F y (a) is the cross-wind integrated footprint value at a distance a upwind from the measurement tower. Dividing L(a) with the corresponding 30-minute traffic rate gives the particle emission factors for mixed fleet traffic.
3. Results and discussion
3.1. Overview of PNC, particle number flux and meteorological conditions
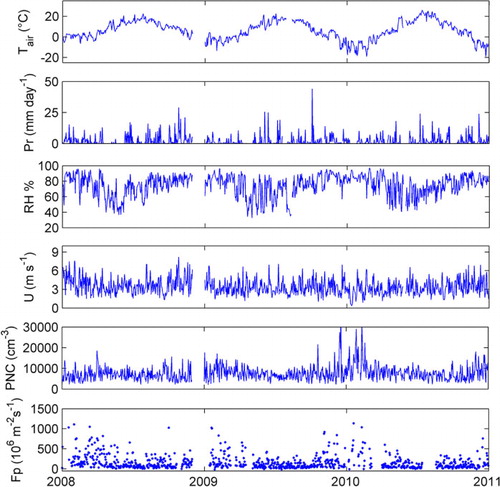
To get an overall picture about the general weather and atmospheric conditions, the time series of the main meteorological parameters, total PNC and F p measured from January 2008 to December 2010 are shown in . The sampling site is characterised by a well-defined seasonality of ambient air temperature, which shows the lowest values in winter (monthly average temperatures from −11 to −0°C) and the highest values in summer (monthly average temperatures: 14–22°C). Followed loosely by air temperature, relative humidity (RH) has the lowest values in May through July and the highest values in winter. Conversely, no clear seasonal variations are observed in wind speed (monthly averages around 3–4 m s−1) and precipitation (monthly sum variable in the range 7–160 mm). During the analysed 3 yr, the daily average PNC vary in the range 2000–41 000 cm−3 and the daily F p in the range 5–1100·106 m−2 s−1. Both metrics experience their maxima in winter when poorly developed atmospheric mixing and high air pollutant emissions from heating processes are typically observed. A similar seasonal pattern of PNC was previously observed in Helsinki (Hussein et al., Citation2004; Järvi et al., Citation2009a) as well as in other urban areas (Wehner and Wiedensohlder, Citation2003; Gómez-Moreno et al., Citation2011; Wang et al., Citation2011). Elevated PNC and F p are particularly accentuated in winter 2009–2010, when Helsinki experienced a very long and cold winter. The highest monthly average PNC (12 300 cm−3) was recorded in February 2010, whereas the lowest values of 5600 cm−3 were recorded in October 2008 and July 2009. The highest monthly average F p (370·106 m−2 s−1) on the other hand was recorded in March 2008, whereas the lowest values of 70·106 m−2 s−1 were recorded in July 2008 and September 2009. Thus, the general behaviour of concentrations and fluxes follows each other but also differences are observed. To the authors’ knowledge, this is the longest published time series of UFP fluxes measured in urban areas as previous studies have been based on short-term measurements campaigns and seasonal pattern of F p has been lacking.
Fig. 2 Time series of daily average air temperature (T air) , precipitation (Pr, mm day−1), relative humidity (RH), wind speed (U), total particle number concentration (PNC), and vertical particle flux (F p).
3.2. Flux footprints
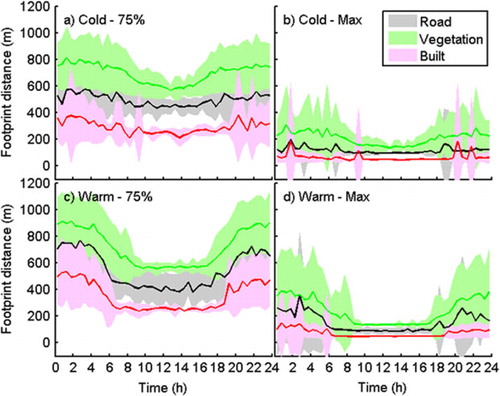
shows the diurnal behaviour of the cross-wind integrated 75% footprint (i.e. distance from within which 75% of the measured particle flux originates) and the distance of the maximum of the cross-wind integrated footprint calculated for the three different areas (road, vegetation, and built representing different urban surface covers. In night-time, when the atmosphere is most stable, the footprint reaches the longest distance meaning that the flux observations cover a longer upwind area than in daytime. In the morning, the increased turbulent mixing leads to an unstable boundary layer and the length of the footprints decreases. This daily cycle is particularly accentuated during the warm period when the daily evolution of atmospheric stability is well defined since intense solar radiation causes strong unstable conditions (Järvi et al., Citation2009a). In cold temperatures, the nocturnal boundary layer tends to be less stable due to anthropogenic heat emissions (see also Vesala et al., Citation2008b, Nordbo et al., Citation2012). As a consequence of a different surface roughness, the 75% flux footprint is shorter in the built area, where the daytime along wind distance varies around 200–300 m, and longer in the road and vegetation areas, with the daytime along wind distance varying around 400–500 m and 500–600 m, respectively. Similarly, the maximum flux footprint reaches daytime along wind distance around 50 m in the built area, and around 100–150 and 150–200 m in the road and vegetation areas, respectively.
Fig. 3 The median diurnal behaviour of (a) the 75% and (b) maximum flux footprint in the road, vegetation and built sectors during the cold, and (c) and (d) the warm period. Shaded areas show the quartile deviations.
3.3. Cluster analysis
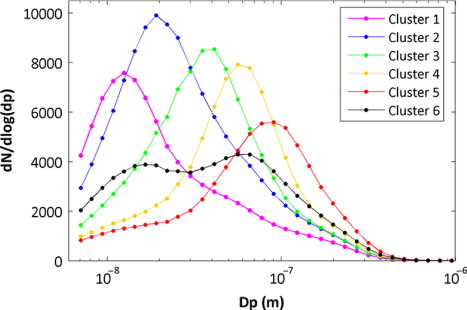
Six clusters were identified by the Dunn index (maximum values of 0.036) as the optimum result of the clustering procedure for the three studied years. shows the representative median PNSD of each cluster when the entire dataset is considered. Clusters 1–5 were named according to geometric mean diameter of the dominant mode, and Cluster 6 is a bi-modal cluster. Clusters 1–3 are dominated by particles in the size range 7–40 nm, Clusters 4 and 5 by particles in the size range 40–100 nm, whereas for Cluster 6 the two size ranges (7–40 nm and 40–100 nm) are equally dominating. Clusters with a similar pattern have also been observed in previous studies at the same site for different years. Wegner et al. (Citation2012) identified PNSDs similar to those of Clusters 1 and 2 as a signature of local anthropogenic sources (traffic, domestic and district heating). These representatives’ PNSDs were more frequent during winter and autumn. Also, the bi-modal PNSD corresponding to Cluster 6 was associated with traffic and local urban sources in general but it was observed to occur equally throughout the year. PNSDs similar to that of Cluster 3 were related to urban aged aerosol. On the other hand, PNSDs similar to those of Clusters 4 and 5 were identified as signatures of aged aerosol mainly associated with air masses of maritime origin and occurring mostly during spring and summer. In the following, we further investigate the signature associated with each cluster trying to identify more in detail the sources and sinks causing the different cluster occurrences.
Fig. 4 The median particle number size distributions (7–950 nm) of the six identified clusters.
3.4. Spatial and temporal variability of PNSD
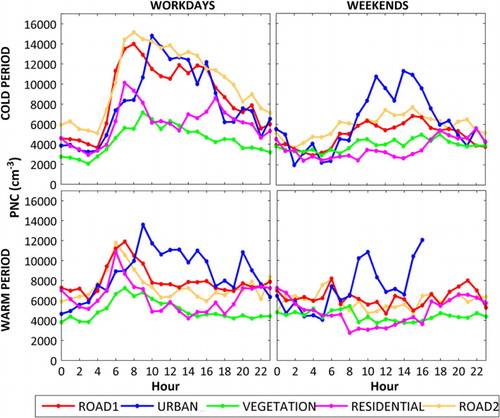
Besides seasonal variations of the cluster occurrences, also a spatial variability of the cluster occurrences was suggested by Wegner et al. (Citation2012) for the same site for 1 yr of measurements. Here, this aspect is further developed by studying the daily occurrence of the six clusters according to the prevailing wind direction in order to identify wind directions likely influenced by different particle sources and atmospheric processes. To take the seasonal changes in cluster occurrences into account, data were further divided into warm (April–September) and cold periods (October–March). Also separation to workdays and weekends was made (). The cluster occurrence shows a significant spatial variability during both the warm and the cold periods (), and five wind direction sectors representing different cluster occurrences can be identified ().
Fig. 5(a–d). Daily occurrence of the six clusters according to the prevailing wind direction separately for cold and warm periods, and workdays and weekends. Colours represent the cluster occurrence for each hour and wind direction. Within each single period, the cross section sum of each cell having the same position in the six separate clusters is normalised to one.
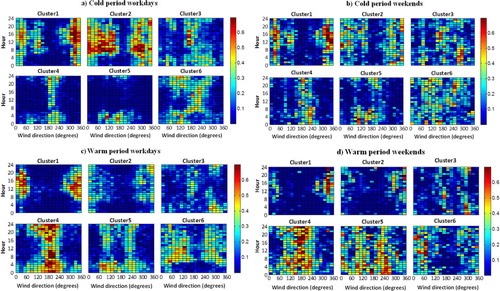
In the Road 1 sector (60–150°), Clusters 1, 2 and 6 related to local traffic emissions from the large road dominate especially during the rush hours (). Clusters 1 and 2 are more frequent during cold periods, whereas Cluster 6 dominates during warm periods (c). This behaviour could be related to the different atmospheric evolution of traffic exhaust emissions with lower temperatures promoting nucleation process and thus the occurrence of Clusters 1 and 2 (Charron and Harrison, Citation2003; Olivares et al., Citation2007). The clusters representing aged aerosols (Clusters 4 and 5) are present mainly on weekend nights during warm periods when the traffic rates are lower (c, d and ).
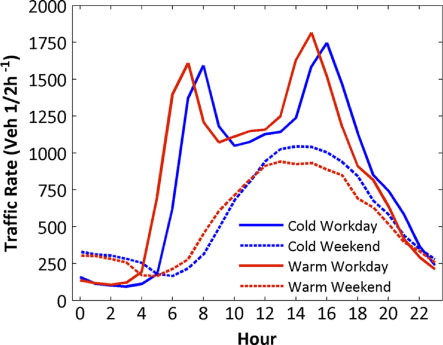
Fig. 6 Diurnal variation of traffic rate (unit) during workdays and weekends separately for the cold (October–March) and the warm period (April–September) in 2008–2010. The x-axis shows the time UTC +2 hours.
In the Urban sector (150–180°), Cluster 3, signature of aged urban aerosol, dominates during daytime both on workdays and weekends (). This sector in fact is representative for a typical high-density urban area of Helsinki and is characterised by variety of sources: the nearby road and further away by the city centre and its harbours. The cluster's occurrence can be explained by a superposition of aged and freshly emitted aerosol. This is particularly clear on workdays during the cold period, as during morning rush hour (6:00–9:00), when the traffic emissions are high and the atmospheric vertical mixing is still low, fresh traffic emissions from the local road dominate and Cluster 2 is detected (a). During late morning and afternoon instead, with the increase of atmospheric mixing, the importance of aged aerosol from further away increases and Cluster 3 becomes more important.
In the Vegetation sector (180–240°), Clusters 1 and 2 are infrequent and size distributions are characterised by larger particle sizes. Clusters 3, 4 and 6 are frequent during the cold period, with the occurrence of Cluster 6 following the daily cycle of traffic intensity (a, b and ). During the warm period, Clusters 4 and 5 cover all the observations both on workdays and weekends (c and d). This sector is characterised by a large vegetated valley and the closest large road is located more than 700 m from the station. The longer distance from the sources implies the detection of aged aerosol that may also be associated with short- and long-range transport, especially of marine origin, during warm seasons (Wegner et al., Citation2012).
Wind directions from 240° to 280° show a cluster occurrence that is similar to that of the two adjacent sectors (i.e. Vegetation and Residential sectors) () and were considered not to add new information to the analysis and were therefore excluded.
In the Residential sector (280–20°), Clusters 1 and 2 dominate both day- and night-time during the cold period when the traffic activity is highest (a and b). During the warm period the occurrence of Cluster 2 decreases, whereas Cluster 1 remains dominant in the afternoon. This sector is covered by residential areas with high presence of vegetation, and partially the university campus. Besides emissions from local traffic and domestic heating, the high occurrence of Clusters 1 and 2 may be influenced by the typically lower air temperatures associated with these wind directions compared to other directions. Lower temperature may affect the atmospheric evolution of emissions, for example enhancing nucleation processes, resulting in PNSD dominated by smaller particle sizes. Moreover, the occurrence of Cluster 1 may also be related to episodes of new particle formation. The 60% of new particle formation events in 2008–2010 occurred downwind from this direction, especially in April and September. During these episodes, Cluster 1 dominates around midday covering 80% of the observations.
The Road 2 (20–60°) sector shows a cluster occurrence similar to that in the adjacent Residential sector with a dominance of Clusters 1 and 2 throughout the day, especially during the cold period. Despite the similarity, the two sectors have been analysed separately because of differences in surface cover with a main road passing through the Road 2 sector.
3.5. Particle number concentrations
The median values of total PNC measured for the different wind direction sectors identified above are shown in . The sectors crossed by the main road (i.e. Road 1, Road 2, Urban) show higher concentrations than the Vegetation and Residential sectors, especially in daytime when the median PNCs vary in the range 0.6–1.2·104 cm−3 for the first three sectors and in the range 0.3–0.7·104 cm−3 for Vegetation and Residential sectors. Despite differences in the studied particle size range, the observed concentrations are in agreement with those observed in other urban and suburban areas and they seem to be somewhat lower than in larger metropolitan areas or southern Europe (e.g. Aalto et al., Citation2005; Lonati et al., Citation2011; Reche et al., Citation2011). Differently to daytime concentrations, the nocturnal concentrations increase during the warm period showing a warm/cold ratio in the range 1.1–1.7; possibly an effect of enhanced long-range transport.
Table 1. The median PNC in size range 7–950 mm and quartile deviations for the different wind direction sectors.
All sectors, excluding the Urban, show rather similar daily concentration patterns following the typical diurnal cycle of traffic intensity (). On workdays, PNCs peak during morning rush hours and decrease towards evening. As in other studies (e.g. Hussein et al., Citation2004; Harrison and Jones, Citation2005), the afternoon peaks in PNC are less intense than morning peaks likely due to higher atmospheric mixing during the afternoon hours. During the warm period, the afternoon peaks seem to disappear in all sectors. Moreover, the PNC daily patterns follow the 1-hour shift observed in the traffic intensity patterns between cold and warm periods due to the onset of the daylight saving time (). In the Vegetation sector, always characterised by the lowest PNCs, the daily patterns of PNCs are less pronounced. This is consistent with the results of the cluster analysis that indicate for this sector low local emissions and PNSDs characterised by aged particles coming from distant sources. The Road 2 sector shows a notable difference in daytime PNCs between cold and warm periods. Higher concentrations from this sector when compared to other wind direction sectors on workdays during the cold period could be related to emissions of small-scale oil/wood combustion from the residential areas. The Urban sector is characterised by PNC daily patterns clearly different from the other sectors. On workdays, the PNCs peak later than the morning rush hours, around 9:00–11:00 and remain high along daytime. Similar daily evolution is observed on weekends except PNCs start to rise later, suggesting influence of traffic emissions. Differences in concentration levels between cold and warm periods and between workdays and weekends are less significant than those observed in other sectors (). This evidence, supported by the cluster occurrence, suggests contribution from other sources beside traffic on the main road, such as industrial and ship emissions from the harbour and traffic emissions from downtown Helsinki, whose daily and weekly variation is expected to be less pronounced.
Fig. 7 Median diurnal variation of PNC in the size range 7–950 nm for the five wind direction sectors () during workday and weekends separately for cold (October–March) and warm period (April–September).
3.6. Vertical particle fluxes
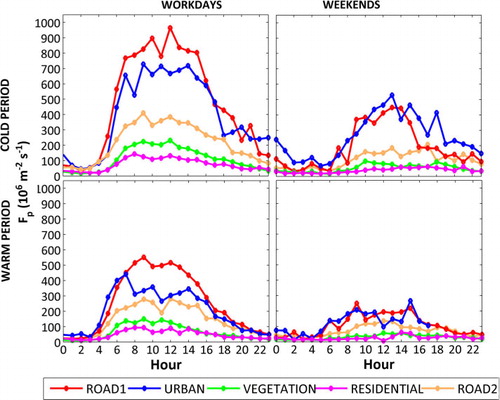
The median values of particle number fluxes (F p) measured for the different wind direction sectors as defined from the cluster occurrences are shown in . In all directions, particle emissions dominate the particle deposition, resulting in an upward net flux of particles. The occurrence for downward net fluxes is 4% from the available flux data. These are only observed occasionally and thus are likely caused by the stochastic nature of turbulence. The highest fluxes are observed from the Road 1 and the Urban sector with daytime median F p in the range 150–730·106 m−2 s−1 and 170–620·106 m−2 s−1, respectively, suggesting the presence of a strong local source inside the flux footprint. In these directions belonging to the road surface cover area, the main road is typically inside the footprint with maximum contributions often coinciding with the road lanes (). Significantly lower F p are observed in the Road 2 sector than in the Road 1 and Urban sectors, especially in daytime when the median F p are in the range 90–320·106 m−2 s−1. The daytime 75% footprint distances characterising this sector, belonging partially to built and to road surface cover areas, vary between 200 and 500 m with a maximum contribution falling in the area of the university campus and parking lots. Therefore, the main road located at a distance between 300 and 700 m in this direction should only marginally affect F p, and F p is rather related to traffic activity around the university campus and in the parking lot. In this direction, the flux measurements can also be affected by the flow distortion caused by the tower and nearby buildings so the flux measurements from the Road 2 sector should be considered with caution. Similarly to concentrations, lowest F p are observed in the Vegetation and Residential sectors suggesting weaker local particle sources inside the flux footprint. The median daytime F p are in the range 40–160··106 m−2 s−1 and 20–100··106 m−2 s−1, respectively. The higher values seen in the Vegetation sector could be affected by the partial inclusion of the main road in the footprint area for wind directions around 180°. The observed levels of F p and the differences between wind direction sectors confirm what was measured at the same site in 2007–2008 (Järvi et al., Citation2009b), with the exception of higher F p levels reported for wind directions in the Residential sector likely caused by construction work that ended in 2008.
The diurnal pattern of F p is rather similar in all sectors and the fluxes rise in the morning and fall in the evening, with temporal differences between workdays and weekends (). In the Road 1 and the Urban sectors, the daily variation is particularly accentuated referring to the impact of road emissions. The diurnal pattern of F p follows that of traffic intensity; however, F p do not show the drop around 10:00–12:00 observed for traffic intensity. This behaviour, also reported in other studies (Dorsey et al., Citation2002; Mårtensson et al., Citation2006; Järvi et al., Citation2009b; Martin et al., Citation2009; Contini et al., Citation2012), can be associated with the effect of micrometeorological parameters such as stronger turbulent mixing around midday. A significant decrease of F p from the cold to the warm period in the Road 1 and the Urban sectors is observed. This decrease may be associated with the decrease of the footprint, especially in the Urban sector where the road is further away from the measurement site, but also with decreasing traffic emissions with increasing ambient temperature, as discussed in Section 3.8. Furthermore, other factors such as tree foliage deposition could contribute marginally. Variation in flux footprints may explain other events such as the sudden decrease of F p around 6:00–7:00 during warm workdays in the Urban sector () when the 75% flux footprint decreases from 700 to 500 m (). The diurnal behaviours of F p in the Vegetation and Residential sectors are less pronounced, particularly on weekends, when F p appear rather constant throughout the day ().
Fig. 8 Median diurnal variation of UFP vertical Flux (F p) for the five wind direction sectors () during workday and weekends separately for the cold (October–March) and the warm period (April–September).
Although a direct comparison between previous studies is difficult because of differences in the investigated particle size ranges and sampling designs, the observed F p appear in the same order of magnitude than those reported for other urban locations, with values varying in the range 10–2000·106 m−2 s−1 (Dorsey et al., Citation2002; Mårtensson et al., Citation2006; Schmidt and Klemm, Citation2008; Martin et al., Citation2009; Järvi et al., Citation2009b; Dahlkotter et al., Citation2010; Contini et al., Citation2012). In particular, Mårtensson et al. (Citation2006) reported similar differences in F p and its daily pattern between a vegetated/residential urban area (F p levels below 200·106 m−2 s−1) and a high traffic urban area (F p levels below 1200·106 m−2 s−1).
3.7. Comparison of PNC and vertical particle fluxes: localisation of sources
As already mentioned, the concentration footprints are generally larger than the flux footprints and therefore different sources can affect the two measurements. Here, the median diurnal cycles of PNC and F p ( and ) will be comparatively analysed in order to derive indicators of the contribution of local or distant sources to PNC and therefore to PNSD measured in each wind direction sector.
The lowest F p always characterising the Residential sector are not associated with the lowest particle concentrations that are typically measured in the Vegetation sector. It appears that sources located outside the flux footprint significantly contribute to the PNC observed in the Residential sector. In this sector, in fact, the flux footprint was observed to be particularly short (daytime 75% flux footprint around 200–300 m) due to the higher surface roughness. Thus, particle sources in the residential area mainly located outside the flux footprint can affect PNC and size distributions without increase in F p.
Similar PNCs are measured in the Road 2 and Road 1 sectors, whereas significantly lower F p are observed in the Road 2 sector. This suggests that the emissions from the flux footprint, mainly associated with emission from parking lots, contribute only marginally to the PNC, which seems to be primarily affected by vehicle emission from the main road and from the residential area located at the border of the 75% flux footprint.
In Road 1 and Urban sectors, particle fluxes behave fairly similarly whereas the particle concentrations vary both in terms of level and diurnal behaviour. When comparing the diurnal cycles of F p and PNC, it is visible that the higher daytime (9:00–14:00) PNCs observed in Urban than in the Road 1 sector are not associated with higher F p. This indicates that distant sources located outside the flux footprint are more significant in the Urban sector than in the Road 1 sector. On the contrary, in the Road 1 sector, PNC appears to be more affected by the local sources, such as the main road located also inside the flux footprint. This result supports cluster analysis, which indicates PNSDs to be more affected by fresh vehicle emissions in the Road 1 sector, where Clusters 1, 2 and 6 are recurrent. Conversely, PNSD appear to be characterised by higher presences of aged aerosols in the Urban sector, where Clusters 3 and 4 are dominant.
In the Road 1 and Urban sectors, the comparisons of PNC and F p were further extended considering the cluster classification. The analysis has been restricted to daytime hours (10:00–15:00) in order to compare clusters observed in homogenous conditions of atmospheric turbulence and mixing. a and 9b show the median PNC and F p for the different cluster occurrences, and reports the number of data point available for each median value.
Fig. 9(a, b). Median PNC and F p for the different cluster occurrences in Road_1 sector (a) and Urban sector (b). The median values are computed for daytime hours 10.00–15.00. See for the amount of data used for the calculation of each data point.
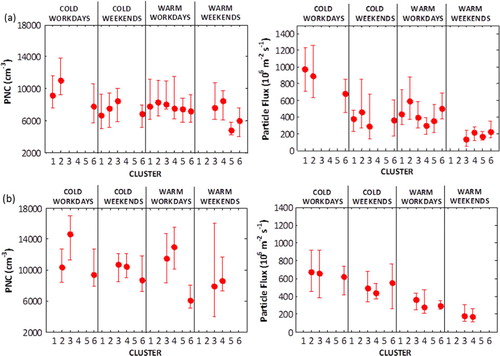
Table 2. Number of data points used in the calculation of the median PNC and F p reported in for daytime hours 10.00–15.00 for the Road 1 and Urban sectors
In the Road 1 sector, Clusters 1, 2 and 6 show similar behaviour when comparing the levels of PNC and F p during both the cold and warm periods. Clusters 1 and 2 have similar concentrations and fluxes, whereas clearly lower PNC and F p are observed when Cluster 6 is observed in cold periods. On the contrary, PNC and F p of Clusters 3 and 4 present contrasting behaviour that is particularly evident in the case of warm weekends: Clusters 3 and 4 show higher PNC than the other clusters but not higher F p. These results suggest that the contribution of sources located out the flux footprints (therefore able to affect PNCs but not F p levels) is more relevant for the PNSDs of Clusters 3 and 4 than for those of Clusters 1, 2 and 6. This evidence further supports the association of Clusters 3 and 4 with more aged aerosol coming from distant sources whereas Clusters 1, 2 and 6 are more associated with fresh emissions from local sources such as road traffic. In the Urban sector, where Clusters 3 and 4 are more frequent, this behaviour is even more accentuated and it recurs in a different period. The case of cold workdays is particularly interesting, Cluster 3 appears to be characterised by significantly higher PNCs than Clusters 2 and 6, but similar F p levels characterise all the clusters. Due to the infrequency of Cluster 5 in the daytime, no information could be derived for this cluster.
Under strong stable atmospheric stratification and low turbulence conditions, particles may not be able to reach the measurement point but are stored in the layer between the ground and the measurement point (Finnigan, Citation2006). In this situation, the measured flux would be lower than the particle emissions causing differences in the behaviour of concentrations and fluxes. The effect of the storage term would be particularly high around the sunrise/sunset when the atmospheric stratification is changing. A rough estimate for the particle storage flux can be obtained by comparing particle concentrations before and after the morning transition (t). If we for example consider the Road 1 sector, where the largest difference in nocturnal (c
0) and morning peak (c
1) concentrations is observed (), we can estimate the storage flux (F
s,max) to be:3
This is an order of magnitude smaller than the measured particle flux in the Road 1 sector during the morning transition and therefore storage flux cannot explain the observed differences in the behaviour of concentrations and fluxes. In other sectors and during different times, the storage fluxes are expected to be smaller so the effect of storage flux on the observed differences can be neglected.
3.8. Particle number emission factors for a mixed vehicle fleet
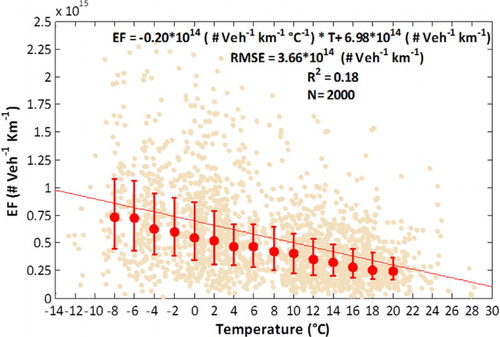
The most important particle source at the site is the local road traffic. Using the particle flux measurements we will be able to estimate emission factors for mixed fleet traffic as described in Section 2.3.2. In order to limit the influence of other particle sources than traffic, the analysis was restricted to the Road 1 sector where the fluxes are most affected by the emissions from the local road. Emission factors were calculated separately for cold and warm periods, resulting in a median EF of 6.03 (±0.19)·1014 # Veh−1 km−1 (based on 851 half-hour EF values) and 3.65 (±0.12)·1014 # Veh−1 km−1 (based on 1149 half-hour EF values), respectively. Thus, EFs are two times higher during cold than warm periods. In general, EF shows a clear dependency on air temperature (T) with higher and more disperse values at low temperatures (). The half-hour EF values show a linear increase with decreasing temperature following an equation: EF=−0.20·1014 # Veh−1 km−1°C−1 T+ 6.98·1014 # Veh−1 km−1 (R 2=0.18, RMSE=3.66·1013 # Veh−1 km−1). The increased particle number emissions at low temperatures have been associated with increased new particle formation in vehicle exhaust instead of increased primary vehicle emissions (Charron and Harrison, Citation2003; Olivares et al., Citation2007; Jamriska et al., Citation2008). Low temperatures enhance nucleation and condensation of emitted condensable compounds, and thus a greater number of particles can form and successively grow to a detectable size (Kittelson, Citation1998; Shi and Harrison, Citation1999). Inverse relationships between PNC and T have been consistently observed at roadside sites (Zhu et al., Citation2006; Wang et al., Citation2008). The tendency of higher nucleation in vehicle exhausts during the cold period is confirmed by the PNSDs, since higher frequencies of Clusters 1 and 2 during the cold period than the warm period are observed.
Fig. 10 The estimated 30-minute EF values (small light red dots) as a function of ambient temperature. The parameters of the linear fit of the 30-minute EFs (red line) are given in the legend. Red dots are median EFs calculated for 4° temperature bins with error bars reporting the interquartile ranges.
The estimated EFs appear slightly higher but in the same order of magnitude as those reported in previous studies (). Literature values vary in the range 1.4–7.8·1014 # Veh−1 km−1. It has to be considered that the comparability between different studies may be limited by different factors. The EFs are estimated using different methods and each of them has different assumptions and uncertainties. For the method applied in this study the largest uncertainties are related to the evaluation of the cross-wind integrated footprint functions and to the assumption that only vehicles on the main road affect F p in the Road 1 sector. Moreover, each study is representative for a particular vehicle fleet composition, traffic regime, meteorological condition, sampling methodology and instrumentation. For example, the traffic regime related to this study is affected by the presence of traffic lights, which could imply higher vehicle emissions. The same method was used by Järvi et al. (Citation2009b), but due to the different footprint models and shorter measurement period, the number of calculated points was less than 15. The EF estimating method presented here has been already applied to F p data measured at the same site during 2007–2008, as reported in Järvi et al. (Citation2009b). Although the EF estimation was based on a limited number of F p data, the values obtained correspond well with the results of this study. Crrently, only one other study has derived EF using F p measurement. In Mårtensson et al. (Citation2006), EF values of 1.4×·1014 # Veh−1 km−1 was derived from an F p parameterisation with traffic activity. Beside differences in the estimation method, other factors could contribute to the lower EF reported such as different particle size detection limits (d p>11 nm) and measurement height (about 100 m in Mårtensson et al., Citation2006). Despite these differences, the general agreement between the estimated EFs and literature values suggests the capability of the method to derive reliable EF from F p measurements. In particular, the method has the advantage of relying on in situ and long-term measurements allowing the estimation of actual EF for a mixed vehicle fleet in real-world conditions and the evaluation of the effect of ambient variables such as temperature.
Table 3. Comparison of mixed vehicle fleet emission factors reported in literature studies
4. Summary and conclusions
This study analysed total PNCs, particle number size distributions and vertical particle number fluxes measured at the semi-urban measurement station SMEAR III in Helsinki, Finland, from January 2008 to December 2010. A comprehensive analysis of the measured variables was performed in order to study local emission sources and their effect on particle concentrations and size distributions.
Cluster analysis showed that the particle size distributions are best described using six clusters, influenced by different sources and atmospheric processes, as observed in previous studies. The different wind direction occurrences of the six clusters allowed the identification of five wind direction sectors influenced by different particle sources and atmospheric processes. Consistently, PNCs and fluxes varied between the different sectors. The emissions from particle sources dominated the particle deposition in all sectors resulting in an upward net flux of particles.
Traffic emissions were identified as the most important source of particles by both concentrations and fluxes, since higher values were measured for sectors where a trafficked road passes near the measurement site compared with values for vegetated and residential sectors. Considering the differences in the flux and concentration source areas, the effect of local or distance sources on the measured PNC and size distributions was shown. In particular, the analysis highlighted a higher contribution of a local particle source to the measured PNC for the sectors where a trafficked road passed near the measurement site. For these sectors, the analysis showed that particle size distributions with a mode in the size range 20–40 nm were more affected by local traffic emissions, whereas the mode shifted towards larger sizes when the contribution of distant sources was more evident.
Particle number emission factors for a mixed vehicle fleet were estimated from the particle flux data and the footprint functions. Median particle number emission factors of 6.03 (±0.19)·1014 # Veh−1 km−1 and 3.65 (±0.12)·1014 # Veh−1 km−1 were estimated for cold (October–March) and warm (April–September) periods, respectively. The emission factor was shown to depend linearly on air temperature (T): EF=−0.20·1014 # Veh−1 km−1°C−1 T+6.98·1014 # Veh−1 km−1 (RMSE=3.66·1014 # Veh−1 km−1, R 2=0.18). The derived relationship could directly be applied to estimate mixed vehicle fleet emission factors at different air temperatures and therefore provide important information, for example, on air quality modelling. The EC technique demonstrated to be a useful method to study local particle sources in an urban environment. In particular, it allows long-term in situ investigations of local source emission strengths that account for real-world conditions giving the possibility to study the effect of meteorological conditions.
The comparative analysis of particle concentrations, size distributions and fluxes has provided information on the relationship between particle sources and UFP levels at a measurement site, which may constitute valuable input knowledge for air quality modelling and particle dispersion studies in urban environments.
Acknowledgements
This work was supported by the Academy of Finland (Project number 138328) and EU-funded project BRIDGE. The authors also thank Pasi Aalto, Üllar Rannik, and Timo Vesala.
Related Research Data
References
- Aalto P. P , Hämeri K , Becker E , Weber R , Salm J , co-authors . Physical characterization of aerosol particles during nucleation events. Tellus B. 2001; 53: 344–358.
- Aalto P. P , Hämeri K , Paatero P , Kulmala M , Forastiere F , co-authors . Aerosol number concentration measurements in five European cities using TSI-3022 condensation counter over three-year period during health effects of air pollution on susceptible subpopulations. J. Air Waste Manage. Assoc. 2005; 55(8): 1064–1076.
- Beddows D. C. S , Dall'Osto M , Harrison R. M . Cluster analysis of rural, urban, and curbside atmospheric particle size data. Environ. Sci. Tech. 2009; 43: 4694–4700.
- Birmili W , Alaviippola B , Hinneburg D , Knoth O , Tuch T , co-authors . Dispersion of traffic-related exhaust particles near the Berlin urban motorway – estimation of fleet emission factors. Atmos. Chem. Phys. 2009; 9: 2355–2374.
- Charron A , Birmili W , Harrison R. M . Fingerprinting particle origins according to their size distribution at a UK rural site. J. Geophys. Res. Atmos. 2008; 113(7): D07202.
- Charron A , Harrison R. M . Primary particle formation from vehicle emissions during exhaust dilution in the roadside atmosphere. Atmos. Environ. 2003; 37: 4109–4119.
- Contini D , Donateo A , Elefante C , Grasso F. M . Analysis of particles and carbon dioxide concentrations and fluxes in an urban area: correlation with traffic rate and local micrometeorology. Atmos. Environ. 2012; 46: 25–35.
- Dahlkotter F , Griessbaum F , Schmidt A , Klemm O . Direct measurement of CO2 and particle emissions from an urban area. Meteorologische Zeitschrift. 2010; 19: 565–575.
- Dall'Osto M , Monahan C , Greaney R , Beddows D. C. S , Harrison R. M , co-authors . A statistical analysis of North East Atlantic (submicron) aerosol size distributions. Atmos. Chem. Phys. 2011; 11: 12567–12578.
- Dorsey J , Nemitz E , Gallagher M , Fowler D , Williams P , co-authors . Direct measurements and parameterisation of aerosol flux, concentration and emission velocity above a city. Atmos. Environ. 2002; 36: 791–800.
- European Union directive 2008/50/EC of the European parliament and of the council of 21 May 2008 on ambient air quality and cleaner air for Europe, Official Journal of the European Union L 152/1, 11.6.2008..
- European Union directive 2008/1/EC of the European parliament and of the council of 15 January 2008 concerning integrated pollution prevention and control, Official Journal of the European Union L 24/8, 29.1.2008..
- Finnigan J . The storage term in eddy flux calculations. Agric. For. Meteorol. 2006; 136: 108–113.
- Franck U, Odeh S, Wiedensohler A, Wehner B, Herbarth O. The effect of particle size on cardiovascular disorders – the smaller the worse. Sci. Total Environ. 2011; 409: 4217–4221. [PubMed Abstract].
- Gómez-Moreno F. J , Pujadas M , Plaza J , Rodríguez-Maroto J. J , Martínez-Lozano P , Artíñano B . Influence of seasonal factors on the atmospheric particle number concentration and size distribution in Madrid. Atmos. Environ. 2011; 45: 3169–3180.
- González Y , Rodríguez S , Guerra García J. C , Trujillo J. L , García R . Ultrafine particles pollution in urban coastal air due to ship emissions. Atmos. Environ. 2011; 45: 4907–4914.
- Harrison R. M , Dall'Osto M , Beddows D. C. S , Thorpe A. J , Bloss W. J , co-authors, etal . Atmospheric chemistry and physics in the atmosphere of a developed megacity (London): an overview of the REPARTEE experiment and its conclusions. Atmos. Chem. Phys. 2012; 12: 3065–3114.
- Harrison R. N, Jones A. M. Multisite study of particle number concentrations in urban air. Environ. Sci. Technol. 2005; 39(16): 6063–6070. [PubMed Abstract].
- Hoek G, Boogaard H, Knol A, de Hartog J, Slottje P, co-authors. Concentration response functions for ultrafine particles and all-cause mortality and hospital admissions: results of a European expert panel elicitation. Environ. Sci. Technol. 2010; 44: 476–482. [PubMed Abstract].
- Hussein T , Hämeri K , Aalto P. P , Kulmala M . Modal structure and spatial-temporal variations of urban and suburban aerosols in Helsinki area. Atmos. Environ. 2005; 39: 1655–1668.
- Hussein T , Martikainen J , Junninen H , Soghaceva L , Wagner R , co-authors . Observation of regional new particle formation in the urban atmosphere. Tellus B. 2008; 60: 509–521.
- Hussein T , Mølgaard B , Hannuniemi H , Martikainen J , Järvi L , co-authors . Finger-printing the urban particle number size distribution in Helsinki – Finland. Accepted in Boreal Environ. Res. 2013
- Hussein T , Puustinen A , Aalto P. P , Mäkelä J. M , Hämeri K , co-authors . Urban aerosol number size distributions. Atmos. Chem. Phys. 2004; 4: 391–411.
- Jain A. K , Murty M. N , Flynn P. J . Data clustering: a review. ACM Computer Survey. 1999; 31: 264–323.
- Jamriska M , Morawska L , Mengersen K. L . The effect of temperature and humidity on size segregated traffic exhaust particle emissions. Atmos. Environ. 2008; 42: 2369–2382.
- Järvi L , Hannuniemi H , Hussein T , Junninen H , Aalto P. P , co-authors . The urban measurement station SMEAR III: continuous monitoring of air pollution and surface-atmosphere interactions in Helsinki, Finland. Boreal Environ. Res. 2009a; 14: 86–109.
- Järvi L , Nordbo A , Junninen H , Riikonen A , Moilanen J , co-authors . Seasonal and annual variation of carbon dioxide surface fluxes in Helsinki, Finland, in 2006–2010. Atmos. Chem Phys. 2012; 12: 8475–8489.
- Järvi L , Rannik Ü , Mammarella I , Sogachev A , Aalto P. P , co-authors . Annual particle flux observations over a heterogeneous urban area. Atmos. Chem. Phys. 2009b; 9: 7847–7856.
- Jonsson Å. M , Westerlund J , Hällquist M . Size-resolved particle emission factors for individual ships. Geophys. Res. Let. 2011; 38: L13809.
- Ketzel M , Wåhlin P , Berkowicz R , Palmgren F . Particle and trace gas emission factors under urban driving conditions in Copenhagen based on street and roof-level observations. Atmos. Environ. 2003; 37: 2735–2749.
- Ketzel M , Wåhlin P , Kristensson A , Swietlicki E , Berkowicz R , co-authors . Particle size distribution and particle mass measurements at urban, near-city and rural level in the Copenhagen area and Southern Sweden. Atmos. Chem. Phys. 2004; 4: 281–292.
- Kittelson D. B . Engines and nanoparticles: a review. J. Aerosol Sci. 1998; 29(5/6): 575–588.
- Korman R , Meixner F . An analytical footprint model for non-neutral stratification. Bound. Layer Meteorol. 2001; 99: 207–224.
- Kristensson A , Johansson C , Westerholm R , Swietlicki E , Gidhagen L , co-authors . Real-world traffic emission factors of gases and particles measured in a road tunnel in Stockholm, Sweden. Atmos. Environ. 2004; 38: 657–673.
- Kupiainen K , Pirjola L , Ritola R , Väkevä O , Viinanen J , co-authors . Street Dust Emissions in Finnish Cities– Summary of Results from 2006–2010. 2011. City of Helsinki Environment Centre 5/2011. Helsinki, Finland.
- Lonati G , Crippa M , Gianelle V , Van Dingenen R . Daily patterns of the multi-modal structure of the particle number size distribution in Milan, Italy. Atmos. Environ. 2011; 45: 2434–2442.
- MacQueen J. B . Some methods for classification and analysis of multivariate observations. Proceedings of 5th Berkeley Symposium on Mathematical Statistics and Probability. 1967; University of California Press: Berkeley. 281–297. 1.
- Malkki M , Lounasheimo J , Niemi J , Myllynen M , Loukkola K . Air Quality in the Helsinki Metropolitan Area in 2010 (in Finnish). 2011. Helsinki Region Environmental Services Authority, HSY publications 3/2011. Helsinki, Finland..
- Mårtensson E , Nilsson E , Buzorius G , Johansson C . Eddy covariance measurements and parameterisation of traffic related particle emissions in an urban environment. Atmos. Chem. Phys. 2006; 6: 769–785.
- Martin C. L , Longley I. D , Dorsey J. R , Thomas M. R , Gallagher M. W , co-authors . Ultrafine particle fluxes above four major European cities. Atmos. Environ. 2009; 43: 4714–4721.
- Morawska L , Jayaratne E. R , Mergersen K . Differences in airborne particle and gaseous concentrations in urban air between weekdays and weekends. Atmos. Environ. 2008; 36: 4375–4383.
- Mueller D , Uibel S , Takemura M , Klingelhoefer D , Groneberg D. A . Ships, ports and particulate air pollution – an analysis of recent studies. J. Occup. Med. & Tox. 2011; 6 31.
- Niemi J , Tervahattu H , Vehkamäki H , Martikainen J , Laakso L , co-authors . Characterization of aerosol particle episodes in Finland caused by wildfires in Eastern Europe. Atmos. Chem. Phys. 2005; 5: 2299–2310.
- Niemi J. V , Saarikoski S , Aurela M , Tervahattu H , Hillamo R , co-authors . Long-range transport episodes of fine particles in southern Finland during 1999–2007. Atmos. Environ. 2009; 43: 1255–1264.
- Nordbo A, Järvi L, Vesala T. Revised eddy covariance flux calculation methodologies – effect on urban energy balance. Tellus B. 2012; 64: 18184. Online at: http://dx.doi.org/10.3402/tellusb.v64i0.18184.
- Olivares G , Johansson C , Ström J , Hansson H. C . The role of ambient temperature for particle number concentrations in a street canyon. Atmos. Environ. 2007; 41: 2145–2155.
- Pey J , Querol X , Alastuey A , RodrIguez S , Putaud J. P , co-authors . Source apportionment of urban fine and ultrafine particle number concentration in a Western Mediterranean city. Atmos. Environ. 2009; 43: 4407–4415.
- Pohjola M. A , Pirjola L , Karppinen A , Härkönen J , Korhonen H , co-authors . Evaluation and modelling of the size fractionated aerosol particle number concentration measurements nearby a major road in Helsinki – part I: modelling results from the LIPIKA project. Atmos. Chem. Phys. 2007; 7: 4065–4080.
- Pope III C. A , Dockery D. W . Health effects of fine particulate air pollution: lines that connect. J. Air Waste Manage. Assoc. 2006; 56: 709–742.
- Reche C , Querol X , Alastuey A , Viana M , Pey J , co-authors . New considerations for PM, Black Carbon and particle number concentration for air quality monitoring across different European cities. Atmos. Chem. Phys. 2011; 11: 6207–6227.
- Saarikoski S , Timonen H , Saarnio K , Aurela M , Järvi L , co-authors . Sources of organic carbon in fine particulate matter in northern European urban air. Atmos. Chem. Phys. 2008; 8: 6281–6295.
- Saarnio K , Niemi J. V , Saarikoski S , Aurela M , Timonen H , co-authors . Using monosaccharide anhydrides to estimate the impact of wood combustion on fine particles in the Helsinki Metropolitan Area. Boreal Environ. Res. 2012; 17: 163–183.
- Salma I , Borsós T , Weidinger T , Aalto P. P , Hussein T , co-authors . Production, growth and properties of ultrafine atmospheric aerosol particles in an urban environment. Atmos. Chem. Phys. 2011; 11: 1339–1353.
- Schmidt A , Klemm O . Direct determination of highly size-resolved turbulent particle fluxes with the disjunct eddy covariance method and a 12-stage electrical low pressure impactor. Atmos. Chem. Phys. 2008; 8: 7405–7417.
- Shi P. J , Harrison R. M . Investigation of ultrafine particle formation during diesel exhaust dilution. Environ. Sci. Technol. 1999; 33: 3730–3736.
- Sioutas C, Delfino R. J, Singh M. Exposure assessment for atmospheric ultrafine particles (UFP) and implications in epidemiological research. Environ. Health Perspect. 2005; 113: 947–955. [PubMed Abstract] [PubMed CentralFull Text].
- Tuch T. M, Herbarth O, Franck U, Peters A, Wehner B, co-authors. Weak correlation of ultrafine aerosol particle concentrations <800 nm between two sites within one city. J. Expo. Sci. Environ. Epidemiol. 2006; 16: 486–490. [PubMed Abstract].
- Vesala T , Järvi L , Launiainen S , Sogachev A , Rannik Ü , co-authors . Surface-atmosphere interactions over complex urban terrain in Helsinki, Finland. Tellus B. 2008b; 60: 188–199.
- Vesala T , Kljun N , Rannik Ü , Rinne J , Sogachev A , co-authors . Flux and concentration footprint modelling: state of the art. Environ. Pollution. 2008a; 152: 653–666.
- Vogt M , Nilsson E. D , Ahlm L , Mårtensson E. M , Johansson C . The relationship between 0.25–2.5 µm aerosol and CO2 emissions over a city. Atmos. Chem. Phys. 2011; 11: 4851–4859.
- Wang F , Ketzel M , Ellermann T , Wåhlin P , Jensen S. S , co-authors . Particle number, particle mass and NOx emission factors at a highway and an urban street in Copenhagen. Atmos. Chem. Phys. 2010; 10: 2745–2764.
- Wang Y , Hopke P. K , Chalupa D. C , Utell M. J . Long-term study of urban ultrafine particles and other pollutants. Atmos. Environ. 2011; 45: 7672–7680.
- Wang Y , Zhu Y , Salinas R , Ramirez D , Karnae S , co-authors . Roadside measurements of ultrafine particles at a busy urban intersection. J. Air Waste Manage. Assoc. 2008; 58: 1449–1457.
- Wegner T , Hussein T , Hämeri K , Vesala T , Kulmala M , co-authors . Properties of aerosol signature size distributions in the urban environment as derived by cluster analysis. Atmos. Environ. 2012; 61: 350–360.
- Wehner B , Wiedensohler A . Long term measurements of submicrometer urban aerosols: statistical analysis for correlations with meteorological conditions and trace gases. Atmos. Chem. Phys. 2003; 3: 867–879.
- Young L.-H , Keeler G . Summertime ultrafine particle in urban and industrial air: Aitken and nucleation mode particle event. Aerosol Air Qual. Res. 2007; 7(3): 379–402.
- Zhu Y. F , Kuhn T , Mayo P , Hinds W. C . Comparison of daytime and night-time concentration profiles and size distributions of ultrafine particles near a major highway. Environ. Sci. Tech. 2006; 40: 2531–2536.