Abstract
An objective classification of radiation fog in distinct evolutionary stages during its life cycle based on reliable criteria is essential for various applications, for example for numerical fog modelling and fog forecasting. However, there have been – up to now – merely qualitative approaches for the distinction of different evolutionary stages in radiation fog. Measurements of the microphysical fog properties with an optical particle counter obtained from droplet measurement technologies together with recordings of the horizontal visibility (VIS) are statistically analyzed to determine individual evolutionary stages of radiation fog with consistent microphysical properties. The developed three-stage approach is based on a statistical change point analysis of the double sum curves of the VIS, the liquid water content, the droplet concentration and the mean radius of the drop size distributions. It could be shown that each of the three recorded radiation fog occurrences could be split into three consecutive phases from formation to dissipation, regardless whether the VIS or the microphysical properties were considered. Having featured consistent microphysical patterns, it could be assumed that the three separated phases of the single fog occurrence could be aggregated for radiation fog. Although this classification is statistically reliable, the dataset still has to be extended for a generalization concerning the separated evolutionary stages.
1. Introduction
The phenomenon of fog is referred to horizontal visibility (VIS) below 1 km (WMO, Citation1992). Due to low VIS during fog events they have a great impact on human life and on society with increasing air, marine and road traffic. Following Gultepe et al. (Citation2007, 2009) the total economic loss, related to fog, is comparable with that for tornadoes and even with that for hurricanes or winter storms in some situations.
Fog forms under specific weather situations and its evolution and structure are related to local conditions, such as terrain and ecological environment. Many factors, for example radiation cooling, air mass advection and precipitation, can affect the formation and the duration of fog. Based on primary factors that affect fog formation, maturation and dissipation, Gultepe et al. (Citation2007) classified fogs into radiation fog, high-inversion fog, advection–radiation fog, advection fog and steam fog.
The most studied fog type is that associated with radiative cooling. Radiation fog forms when ground-level temperatures decrease below dew point as a result of nocturnal long-wave emission of the earth's surface and turbulent fluxes. It usually forms near the surface under clear skies in stagnant air in association with anticyclonic conditions (Gultepe et al., Citation2007). However, the mechanisms of radiation fog formation, development and dissipation are very complex and have been extensively studied with a series of numerical simulations and comprehensive observational programs including in situ measurements (Meyer et al., Citation1986; Fitzjarrald and Lala, Citation1989; Fuzzi et al., Citation1992, Citation1998; Gultepe et al., Citation2007; Zhou and Ferrier, Citation2008; Liu et al., Citation2011; Dupont et al., Citation2012). Recently, field experiments have been conducted to investigate dynamic, thermodynamic, microphysical, and radiative processes in Beijing and Nanjing, China (Liu et al., Citation2011), in Canada (Gultepe et al., Citation2009), and in Paris, France (Haeffelin et al., Citation2010; Dupont et al., Citation2012).
The balance between radiative cooling and turbulent mixing seems to be a primary factor in the development of radiation fog (Roach et al., Citation1976; Nakanishi, Citation2000; Terradellas and Bergot, Citation2008). Beside radiative cooling as a main mechanism the upward soil heat flux, as well as the warming effects and moisture losses through dew deposition from turbulent mixing, strongly influence the formation, structure and life cycle of radiation fog (Lala et al., Citation1975; Pilié et al., Citation1975b; Brown and Roach, Citation1976; Roach et al., Citation1976; Findlater, Citation1985; Turton and Brown, Citation1987; Fitzjarrald and Lala, Citation1989; Bergot and Guédalia, Citation1994; Duynkerke, Citation1999).
As a result of the complex mechanisms radiation fog development and dissipation fog properties differ greatly, depending on the synoptic situation, the mode of formation and the geographic conditions. These diverse factors contribute to the present inability to forecast the occurrence and severity of radiation fog with an acceptable accuracy. Still lacking is a detailed understanding of the processes that control the evolution of radiation fog.
However, radiation fog shows a remarkable diurnal variation. It forms mostly at sunset or midnight, and lifts after sunrise or at noon. The development of radiation fog is often described as a typical life cycle regarding fog properties with consecutive evolutionary stages (e.g. Lala et al., Citation1982; Stewart and Essenwanger, Citation1982; Juisto and Lala, Citation1983). Variations in the microphysical character of radiation fog have been tied to various stages defining the life cycle of radiation fog. Gultepe et al. (Citation2007) separated the fog life cycle into three distinct development stages. The formation stage is characterized by an increase in the liquid water content (LWC), the droplet concentration (N t) and the mean droplet size (r mean). Gultepe et al. (Citation2007) stressed that during the mature stage LWC and N t stay nearly constant and r mean decreases gradually. When the fog dissipates all three microphysical parameters decrease. Pilié et al. (1972, 1975a, 1975b) distinguished four separate stages in the life cycle of fog by analyzing the VIS, N t, LWC and r mean. The prefog phase began when VIS <4 km and ended when VIS <1 km for the first time. The initiation phase lasted until the first minimum in VIS. N t and LWC increase to a maximum at the same time; r mean increases to near maximum between the first observable VIS decrease and the first minimum. During the following mature phase, VIS remains nearly constant. N t and LWC fluctuate synchronously with VIS; r mean gradually decreases after the maximum in the initiation phase and remains almost constant through the mature phase. In the dissipation phase, VIS gradually increases. N t and LWC decrease drastically. On average, r mean also decreases at the time of dissipation.
For a radiation fog event in Nanjing, Liu et al. (Citation2011) identified four development phases: formation, development, mature and dissipation phases, depending on microstructure and VIS.
Wendisch et al. (Citation1998) identified two characteristic phases for the observed fog events during the CHEMDROP experiment in the Po Valley (Northern Italy). The first ‘initial’ phase is characterized by a strong increase of the number of small droplets. During the second phase, which is called ‘mass transfer phase’ the water mass for the large drops increases drastically, whereas the small droplets remain nearly unchanged. Price (Citation2011) analyzed the droplet spectra for several fog events in Cardington, UK. In accordance to Wendisch et al. (Citation1998), he identified an initial phase with small drop sizes and a mature phase with the appearance of larger drop sizes.
The existing studies on radiation fog development accordingly indicate the existence of distinct evolutionary stages during the fog life cycle. However, they differ with respect to the number and characterization of the identified phases. This might be due to the differing conditions under which the fog events occurred. Another important aspect is the missing quantitative and consistent criteria that would allow a reproducible separation of the fog events into concurrent stages from the initiation to the dissipation together with the missing consistency in the analyzed parameters. An objective classification method by means of quantitative criteria can help to separate differing radiation fog events in a consistent manner.
The consistent recognition of distinct phases of fog evolution is important for the interpretation of governing physical processes. The microphysical characteristics associated with the identified phases can be used as verification criteria for numerical fog modelling and can help to improve the accuracy of fog forecasting. Currently, the existing microphysical model schemes do not account for the evolution of microphysical properties during the lifetime of radiation fog. In this context, the identified and characterized evolutionary stages can help to improve the microphysical parameterizations in the models.
The aim of this study is therefore to introduce a statistical method based on change point (CP) analysis of time series for the objective separation of radiation fog events into distinct life cycle phases. The classification is based on microphysical properties of three radiation fog occurrences during October and November 2011 as LWC, the total number of droplets per cm3 (i.e. N t) and the mean and mode radius (i.e. r mean and r c) as well as the prevailing VIS.
It is hypothesized that the measured time series of the microphysical parameters show a characteristic temporal course from the initiation to the dissipation, which can be separated into distinct development phases. It is further hypothesized that the statistical CP analysis of time series allows the objective and quantitative separation into distinct development phases and that there is an accordance between the separated phases of each fog event especially with respect to the microphysical characteristics.
The structure of this article is as follows. The measurement site and equipment together with the prevailing weather situation are introduced in Section 2. This is followed by a description of the developed statistical method to detect quantitatively definable evolutionary stages in the radiation fog life cycle. The results of the analysis are presented in Section 3. A discussion of the results, also with respect to existing results from the literature is given in Section 4. This article closes with a conclusion in Section 5.
2. Materials and methods
2.1. Measurement site and equipment
The field measurements were carried out in autumn 2011 at the Marburg Ground Truth and Profiling Station (50.53304°N/8.68535°E, 172 m a.s.l.). The measuring site is located in the flood plain of the Lückebach-creek. The rural valley is surrounded by small hills extending up to 250 m a.s.l. In consequence of the topographic position and the warm-moderate rain climate of the mid-latitudes the study area is known for its high fog frequency in autumn months (Schulze-Neuhoff, Citation1976; Bendix, Citation1998; Citation2002). The Marburg Ground Truth and Profiling Station encompasses the measuring instruments according to .
Table 1. Applied instruments on the Marburg Ground Truth and Profiling Station
The measured VIS at a 2 m height was the criterion for the occurrence of fog (<1 km) (WMO, Citation1992). Fog-specific drop size distributions cause extinction of visible light since the extinction coefficient of fog droplets is a function of LWC and N t. The reduction of light can be detected by optical measuring devices (Gultepe et al., Citation2006). The top height of fog was derived from radar reflectivity of a 94 GHz FMCW, PVM radar (Huggard et al., Citation2008; Bennett et al., Citation2009). In case of a lifting fog layer, the cloud base height was detected by a Ceilometer. The core instrument of the field measurements was an optical particle counter (OPC) from droplet measurement technologies (DMT). The device allowed a particle-by-particle measurement and detected drop size spectra within a range from 2 to 50 µm in 30 size bins and in a 1-second cycle (DMT, Citation2012). The microphysical parameters LWC, N t, r mean and r c were derived from the volume-corrected counts per cm3 of the individual 30 size bins. The fog microphysical measurements were conducted 2 m above ground.
For the analysis, the collected raw data from the meteorological and microphysical instruments were synchronized on a 1-minute time interval. The time series were reduced to the time range of the fog event when the VIS fell the first time below 1 km and finally exceeded 1 km in the dissipation phase.
2.2. Weather situation during the fog events
The three fog events analyzed in this article occurred from 26–27 October 2011, 31 October–1 November 2011 and 13–14 November 2011. The prevailing synoptic weather regimes over Europe and the North East Atlantic were recorded by the German Weather Service (DWD, Citation2011) referring to the classification of Hess and Brezowsky (Citation1977). The general weather situations are summarized in with respect to the general classification of James (Citation2007).
Fig. 1 Synoptic weather regimes during the three fog events referring to Hess and Brezowsky (Citation1977) and James (Citation2007) (DWD, Citation2011): (a) first fog event: 26–27 October 2011; (b) second fog event: 31 October 2011–1 November 2011; (c) third fog event: 13–14 November 2011. Left column: 500 hPa level, right column: surface pressure level.
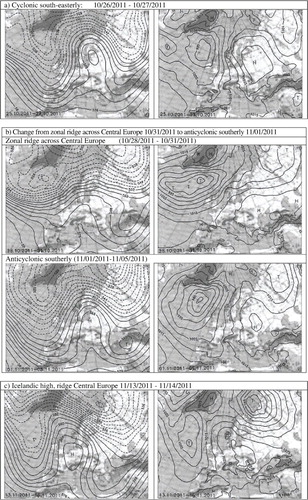
The first fog event occurred during a cyclonic weather situation, generally at south-easterly streamflow from 25 to 27 October 2011 but accompanied by a strong high-pressure area over Russia and Central Europe. Negative temperature and precipitation anomalies compared to the seasonal averages were recorded due to cold and dry maritime polar air mass intrusions to the study area.
The second fog event featured a transition in the general weather conditions from a zonal ridge type across Central Europe (28–31 October 2011) to an anticyclonic southerly (11 January 2011–11 May 2011) situation. During this process, a temporary ridge of high pressure between a high over the Azores and a Russian continental high disappeared and was replaced by a frontal zone, preliminary in the north-western part of the ridge. The result was a meridional streamflow transporting warmer and more humid air masses to Central Europe.
The general weather condition during the third fog event was characterized by an Icelandic high and a high-pressure ridge over Central Europe from 13 to 16 November 2011. Both temperature and precipitation were below average for the season.
2.3. Detection of the fog development stages
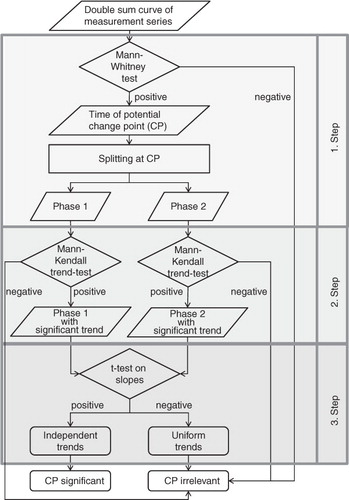
For the detection and the classification of the different fog evolutionary stages during its life cycle, a statistical method was developed that is based on double sum curve analysis as used for hydrological analyses of flood water flows (AK KLIWA, Citation2002). The analysis of double sum curves is a method for finding inhomogeneities in time series (Hansel and Schäfer, Citation1970). reveals the three steps that had to be undertaken for the detection of potential CPs within the times series of the microphysical parameters and VIS of the three recorded fog occurrences. A detailed explanation of the statistical approach is given in Appendix.
Fig. 2 Flowchart of the statistical approach for the detection and statistical proof of change point (CP) in double sum curves of measurement series.
3. Results
3.1. Detected life cycle phases
The results of the statistical analysis for the three fog events are summarized in Table and 3 . shows the potential CPs of Step 1 found for the analyzed parameters VIS, LWC, N t, r c and r mean for each fog event found by the Mann–Whitney homogeneity test.
Table 2. Found potential change points (CP) of the three fog events from the homogeneity test of Mann–Whitney for the cumulative sum of VIS, LWC, N t, r c and r mean
The calculated time of the CPs was the same for all five parameters. Therefore, contains only one value for each CP which is representative for the five measurement parameters. The two CPs of a double sum curve separate the time series of a fog event in three sub-time series.
The test statistics of the Mann–Kendall trend-tests were very low (<0.0001) for all identified phases and for each parameter (VIS, LWC, N
t, r
mean, r
c) revealing a very high statistical significance level (99.99%). Thus, H
0 [µ
x
(t)=const] can be denied in the benefit of H
A
, meaning that there is a uniformly increasing trend for each parameter during each identified phase of the three fog events.
The results from the two-sided t-test on the slopes of the parameters VIS, LWC, N t, r c and r mean for each identified evolutionary stage of the three fog events (Step 3) are shown in .
Table 3. Two-sided t-test on the slopes of the phases regarding the microphysical parameters and VIS from the three measured fog events
Apart from the low significance level obtained for the LWC in the first phase of the third fog event, all five parameters featured a high significance level of 99.99% for each evolutionary stage. Hence, H A (B x1t1≠B x2t2) can be accepted at the cost of H 0 (B x1t1=B x2t2), implying that there was always a significant change of the slopes at the CPs between the phases.
3.2. Description of the derived life cycle stages
The development of the microphysical and meteorological measurement parameters in terms of the identified phases of the three fog events will be described in detail for the first (26–27 October 2011) and second fog event (10 October 2011–1 November 2011). The characteristics of the third fog event (13–14 November 2011) are very similar to those of the first fog event. Therefore, the development of the microphysical and meteorological measurement parameters of the third fog event are not described in detail; but are given in the appropriate and .
Fig. 3 Measured data during third fog event: 13–14 November 2011. (a) Horizontal visibility (VIS); (b) microphysical properties: liquid water content (LWC), total number of droplets per cm3 (N t), mean droplet radius (r mean), modal droplet radius (r c); (c) meteorological properties: temperature (T), relative humidity (RH), wind speed; (d) cloud ceilings. The first and last vertical line represent the time when VIS is the first and last time below 1 km during the fog event. The other two vertical lines signify the break points determined by the statistical approach.
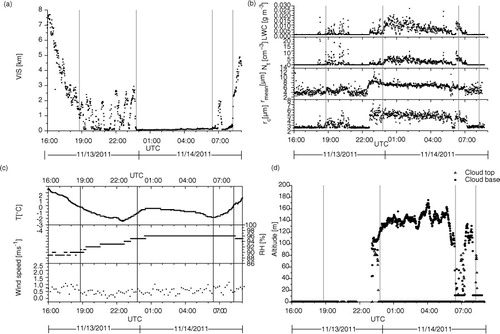
Table 4. Overview of the microphysical properties of the three fog measurements differentiated by evolutionary stages liquid water content (LWC), total amount of droplets N t, arithmetic mean of radius r mean, modal value of radius r c, minimum value of radius r min, maximum value of radius r max, range between minimum and maximum value within a drop size spectrum
3.2.1. First fog event (26–27 October 2011).
Before VIS dropped below <1 km for the first time at 19:21 local time (LT), more than 2 hours after sunset, it had decreased relatively continuously (a). Then it oscillated with wide fluctuations until the first CPs at 01:50 LT. The first evolutionary stage lasted over 50% of the whole life cycle. Hereafter, VIS remained constantly low around 0.2 km during the secondary evolutionary stage which lasted 33% of the whole fog life cycle. Not until the second CP at 06:00 LT during sunrise it exceeded 1 km. After having had a local maxima with >1 km, VIS dropped again below 1 km, before it finally rose >1 km at around 08:00 LT in the last phase. The dissipation stage persisted 16% of the whole fog event.
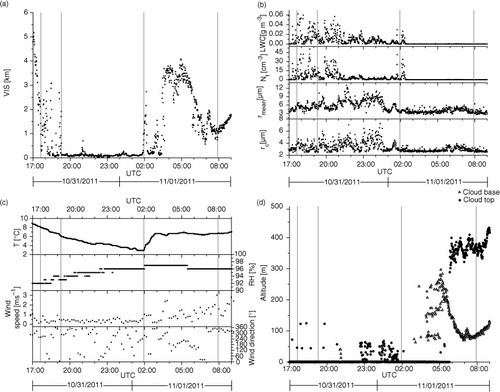
Fig. 4 Measured data during first fog event: 26–27 October 2011. (a) Horizontal visibility (VIS); (b) microphysical properties: liquid water content (LWC), total number of droplets per cm3 (N t), mean droplet radius (r mean), modal droplet radius (r c); (c) meteorological properties: temperature (T), relative humidity (RH), wind speed; (d) cloud ceilings. The first and last vertical line represent the time when VIS is the first and last time below 1 km during the fog event. The other two vertical lines signify the change point (CP) determined by the statistical approach.
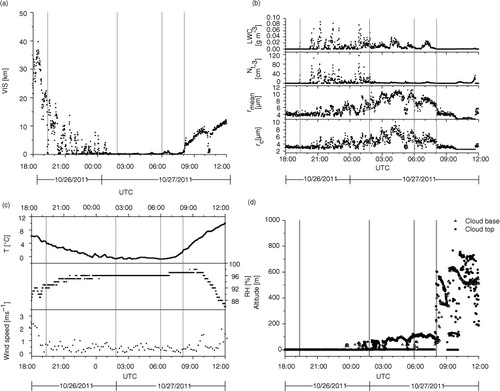
Initial measurable values of all microphysical parameters were recorded at the time when VIS became <1 km for the first time. Prior to the first CP, they strongly oscillated during the formation stage, whereby LWC and N t reached maximal values with 0.09 g m−3 or 116 cm−3. Both r mean and r c had a slight tendency to increasing values. In between the two CPs (mature phase) all microphysical parameters but N t continued fluctuating with r mean and r c reaching maximum values for the whole fog event with 11.2 µm and 10.3 µm. Meanwhile, N t decreased at first and stayed thereafter constant at a low level with 2.1 cm−3. During the last evolutionary phase (dissipation stage), between the second CP and the time when VIS became >1 km again, all microphysical parameters had local maxima. Subsequently their values decreased to a level of zero.
Temperatures steadily decreased from sunset to the first CP by more than 6 K, whereas relative humidity (RH) increased up to 96%. Within the two CPs, temperature as well as RH stayed on a constant low (T≈0°C) and high level (RH≈96%), respectively. After sunrise both meteorological parameters increased again, whereas RH featured a reversal of the trend at around 09:30 LT. Air pressure was almost constant around 1016 hPa during the whole fog event. Air speed during the fog occurrence (vv≈1 m s−1) was lower than before and after it (vv>2 m s−1). During the whole fog event, neither drizzle nor precipitation was recorded.
With the beginning of the formation stage a cloud top formed at a 50 m altitude that expanded up to 120 m with some interruptions. When VIS was <1 km for the last time at 08:05 LT, a formation of a solid cloud base could be observed. Thereafter both cloud base and cloud top rose simultaneously up to 750 m and 500 m respectively.
3.2.2. Second fog event (31 October 2011–1 November 2011).
After sunset at 16:04 LT, VIS has decreased continuously until it became <1 km for the first time at 17:40 LT (a). Then it oscillated with an amplitude of up to 3 km until the first CP at 19:17 LT. The formation of the fog lasted only 12% of the whole event. As far as the second CP at 01:57 LT VIS stayed then<1 km at a constant level of around 0.1 km. The second stage of the whole life cycle lasted 45%. More than 4 h before sunrise at 06:16 VIS increased >1 km at 01:57 LT during the second CP with VIS=4.1 km. Afterwards VIS decreased below 1 km, before it finally rose constantly above 1 km at 07:55 LT. The last phase persisted 42% of the whole fog occurrence.
Fig. 5 Measured data during second fog event: 31 October 2011–1 November 2011. (a) Horizontal visibility (VIS); (b) microphysical properties: liquid water content (LWC), total number of droplets per cm3 (N t), mean droplet radius (r mean), modal droplet radius (r c); (c) meteorological properties: temperature (T), relative humidity (RH), wind speed, wind direction; (d) cloud ceilings. The first and last vertical line represent the time when VIS is the first and last time below 1 km during the fog event. The other two vertical lines signify the break points determined by the statistical approach.
Unlike the previous fog event, initial measurable values of the microphysical parameters could be recorded even before VIS <1 km for the first time. Similarly to the first phase of the first fog event, the highest values of LWC (0.06 g m−3) and N t (51 cm−3) were also recorded during this phase of the second fog event. Not only in the first phase but also in the second evolutionary stage r mean and r c revealed fluctuations with an increasing tendencies from 5.3 µm to 6.5 µm, respectively from 3.4 µm to 3.7 µm. Their maximum values of the whole fog event were also recorded in this secondary evolutionary stage with 13.1 µm or 7.2 µm. At the same time, LWC and N t continued oscillating as well, though with a much smaller amplitude as in the beginning maximal values attained almost 0.06 g m−3 or 41 cm−3. During the last evolutionary stage, LWC and N t exhibited one last local maxima, followed by a sudden decrease to zero. In contrast, r mean and r c revealed coincidently fluctuations even though on a much lower level (3.9 µm or 2.9 µm).
While temperatures continued decreasing from sunset on (ΔT≈−6 K), RH increased from 92% up to 94% until the second CP at 01:57 LT. From then on, temperatures revealed a strong increase until the second CP (ΔT≈+4 K)and beyond. Meanwhile, RH initially increased slightly before it featured a steady reversal trend. Air pressure fluctuated around 1016 hPa during the whole fog event. Wind speed started on a low level (0.5 m s−1) in the beginning and remained low till the second CP. Subsequently, during the dissipation stage, wind speed rose permanently up to 3 m s−1. Furthermore, the main wind direction veered coincidently from northwest to southeast at the same time. During the whole fog event, neither drizzle nor precipitation was recorded.
During the first phase, a perforated cloud top formed at a height of 50 m which vanished before having reached the second CP. However, the cloud top signal reoccurred in the dissipation stage, accompanied by the formation of a stable cloud base at an altitude of 250 m. At the end of the fog event, the cloud ceilings enlarged vertically to 100 m and 450 m above the ground.
4. Discussion
The applied statistical based approach detected very significant CPs for all tested parameters in their double sum curves of the recorded three fog events. As the changes occurred at the same time for each parameter, they can be taken as feasible criteria for classification of radiation fog in three different phases.
In the context of existing classifications of different fog life cycle phases and considering the two identified CPs, together with the resulting three phases, the analyzed fog events can be classified into three phases. The first phase (formation stage) lasted from the time when VIS became <1 km for the first time until the first CP, the second phase (mature stage) in between the first and the second CP, and the last phase (dissipation stage) from the second CP till the time when VIS became >1 km.
In the following, the three evolutionary stages, derived from the performed CP analysis of the three analyzed radiation fog events will be compared with two existing fog models from the literature. Pilié's et al. (1972, 1975a, 1975b) model for the evolution of radiation fog (PFM) consists of four phases and Gultepe's et al. (Citation2007) fog model (GFM) distinguishes three evolutionary stages. These two models of fog development were chosen, because they provide quantitative criteria for each separated phase that could be compared with our results.
According to Gultepe et al. (Citation2007), the three stages of a fog life cycle can be characterized by the progress of their microphysical properties in detail. The formation stage shows gradually upward trends of LWC, N t and r mean. During mature fog LWC and N t stay on a nearly constant level while r mean decreases gradually. With the beginning of the dissipation stage all three parameters decrease again. If one expands the three-stage classification by another phase that takes place right before the actual fog event, one gets the PFM (Pilié et al., Citation1972, Citation1975a, Citation1975b). The so-called ground fog or prefog phase in the PFM starts when VIS <4 km and lasts until VIS <1 km for the first time. This mist consists of up to 200 drops per cm3 with a range between 1 and 10 µm and a mean from 2 to 4 µm. In the formation stage, VIS decreases until it reaches its first minimum – mostly after 12% of the whole life cycle. From then on, VIS increases till the end of the fog event. All three microphysical parameters (LWC, N t and r mean) increase during the formation stage whereas r mean already reaches its absolute maximum. The first minimal VIS is also the criterion for the transition to mature fog and the time of maximal values of LWC and N t. Furthermore, very small drops disappear shortly before this point and reappear later. During mature fog LWC and N t fluctuate synchronously with VIS whereby the latter either stays constant or subjects to large fluctuations; r mean stays constant once it has decreased gradually in the beginning of mature fog. The shift to the last phase, dissipation stage, occurs after 75% of the life cycle when all microphysical parameters decrease drastically with some exceptions for r mean.
VIS as a criterion for the differentiation between formation stage and mature fog is not suitable for the three measured fog events because very low values were spread over all three stages of evolution. Their absolute minima lay in the middle of the formation stage with 0.05667 km at 04:07 LT during the first fog event and with 0.02 km at 22:17 LT during the second fog event; the VIS-minimum of the third fog occurrence was situated earlier in the formation stage with 0.05333 km at 21:19 LT. Besides, VIS revealed large fluctuations in the formation and in the dissipation stage, which is different from the PFM. Also the time intervals of the classified formation stages did not coincide with Pilié's et al. (1972, 1975a, 1975b) declaration (25% of the total life cycle). During the first fog event the formation stage lasted longer than 50% of the whole fog event, while it lasted about 10% of the whole fog event during the second fog event and 37% of the third fog event. The increasing trend of all microphysical properties could be seen during the formation stages as in GFM and PFM, however, with larger fluctuations and prior maximum values of LWC (0.09 g m−3/0.06 g m−3) and N t (116 cm−3/51 cm−3/18 cm−3). Only the maximum LWC of the third fog event lay in the mature fog with 0.03 g m−3.
The mature fog episodes did not always exhibit constant values for LWC and N t, but rather unsteady values. Unlike the specification of GFM and PFM, r mean did not show a decreasing trend, but rather a constant or an increasing one. In return, high values of r mean at the end of the first fog event agreed with the exception for that phase of the PFM. Maximum r mean values of 11 µm were reached at the transition to the dissipation stage of the first fog event. In contrast, maximum r mean values of about 13 µm occurred in the middle of the mature fog stage during the second fog event and in the formation stage of the third fog event.
The dissipation stages set in after 85% (first fog event) and after 60% (second and third events) of the whole fog event. This corresponds well with the PFM which states the beginning of the dissipation stage after 75% of the whole fog event.
Even though the separation of the investigated fog events in three evolutionary stages seems to be appropriate, featuring the same main trends in the microphysics as the GFM and the PFM; Pilié's criteria (Pilié et al., Citation1972, Citation1975a Citation1975b) for stage classification as minimum VIS or maximum values of microphysical properties did not match with the statistical based CPs of the three observed fog events.
Another aspect that has to be clarified is the representation of the measured microphysical values of the three fog events. In a former study, Maier et al. (Citation2012) compiled published measurement values of LWC, N t and r c from different authors depending on the type and evolutionary stage of fog (). For a comparison with our measurements the extremes of LWC, N t and r c were aggregated for the whole dataset of all three fog events. Thereby, the phase-specific minimum as well as the phase-specific maximum of the microphysical parameters was selected and opposed with the phase-specific extreme values from Maier et al. (Citation2012). Additionally, the marginal values of the parameters were assembled without consideration of the evolutionary stage for the whole measured values from the three fog events. Considering the aggregated microphysical values from the three investigated fog events without a differentiation into evolutionary stages, they agree well with the values from other studies. According to Gultepe et al. (Citation2009) continental fog events feature a mean LWC of about 0.02–0.03 g m−3 and a mean N t of 90 cm−3. Compared to the measured values of LWC and N t during summery marine fog cases (Gultepe et al., Citation2009), the presented measurements for both microphysical properties feature mostly smaller values ().
Fig. 6 Horizontal visibility (VIS) as a function of (a) liquid water content (LWC) and (b) total number of droplets per cm3 for all three fog events.
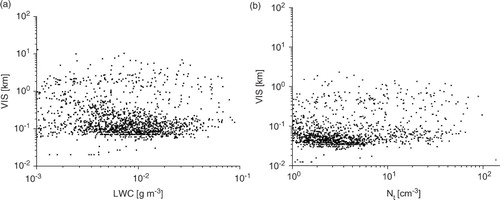
Table 5. Comparison of the measured microphysical parameters (LWC, N t, r c) with values from literature compiled in Maier et al. (Citation2012)
The differences of the microphysical properties can be ascribed to the different types of fog as well as the diverse location of the measurement sites. The Marburg Ground Truth and Profiling Station are located in a region featuring a warmer continental climate than in Canada where Gultepe et al. (Citation2009) accomplished their fog measurements under a colder maritime influence. Furthermore the used time intervals differ by a factor of 60 which results in further anomalies.
If the values are separated into the different evolutionary stages some differences become apparent in comparison with the parameter values from the literature. All maxima of measured LWC are lower than the LWC minima from the literature for all evolutionary stages. In return, all recorded maximal values of N t and r c are in the published ranges. Only maximal N t values during the dissipation stage and maximal r c values during the mature stage are slightly above the released figures. Regarding the fact that no clear criteria for the phase-specific classification were given in the literature, measured values of the microphysical properties of the three fog occurrences fit quite well with the known ones. Also one should note that the values from the literature are assembled from different, older instruments with different time resolutions, however, the compliances are quite good.
Whether the three evolutionary stages of the three measured fog events, found by the statistical approach, can be aggregated, will be discussed next. The longest phase was the mature stage with about half of the whole life cycles. However, there is no coincidence for the two other evolutionary stages. During the first and last fog events, the formation stage lasted about a third and the dissipation stage about 15% of the whole fog events. In contrast, the last phase of the second fog occurrence was over 40% of the fog duration and its formation stage only 12%. Overall, the separation of the evolutionary stages as a function of time has to be seen crucial.
Although the arithmetic mean of phase-specific LWC of the three fog events show a slight increase from formation to mature stage with a strong decrease to the dissipation stage, maximum values of LWC were found in the two initial phases for the first two fog events that decreased over the fog life cycle (). Averaged values of N t over the three phases decreased from formation (7.5 cm−3) over mature (3.3 cm−3) until dissipation stage (1.0 cm−3). Maximum values of droplets were always in the formation stage (115.7 cm3/50.7 cm−3/16.1 cm−3) and minimum peak values of N t in the dissipation stage (5.7 cm−3/33.8 cm−3/5.4 cm−3). The arithmetic means of the phase-specific r mean and r c of the three fog occurrences showed consistent tendencies. From the initial phase to mature stage r mean and r c averaged over all separated phases increased from 5.2 µm (3.6 µm) to 7.1 µm (4.7 µm) and decreased again to 4.9 µm (9.6 µm) during the dissipation stage and thereby below the values at the beginning of fog formation. Phase-specific arithmetic averaged values of r max show also uniform trends. reveals that there was an increase from formation (11.0 µm/16.1 µm/8.0 µm) to dissipation stage (17.1 µm/22.1 µm/13.9 µm) and then a decrease to dissipation stage (14.6 µm/4.7 µm/6.6 µm) for all three fog events. Regarding the phase-specific microphysical properties, the derived evolutionary stages by the developed statistical approach show good agreements.
For a more precise understanding of the development of radiation fog the meteorological processes have to be included which determine the microphysical parameters in a relevant manner and therewith also the formation of the three consecutive evolutionary stages. The dynamic basis of the three fog events from 26–27 October 2011 (cyclonic south-easterly), 31 October 2011–1 November 2011 (change from zonal ridge across Central Europe to anticyclonic southerly) and 13–14 November 2011 (anticyclonic southerly) were high-pressure (>1016 hPa) situations over the study site (). An increasing high RH>90%, low wind speeds <2 m s−1 (c, c, c) and a clear sky (d, d, d) predominated after sunset, shortly after 16:00 LT. Persistent radiative cooling of the surface resulted in constantly decreasing ground. First, small droplets formed when dew point had been reached and consequently VIS decreased. Small droplets evaporated and recondensed again. When wind speed continued decreasing down to 0.5 m s−1 the conditions for lasting drops were given, together with further radiative cooling and increasing humidity. VIS became below 1 km for the first time. Turbulent fluxes, indicated by fluctuating wind speeds, disturbed the growth process of the fog layers. Thereby, the up and down of the microphysical parameters as well as VIS can be explained. When temperatures reached even lower degrees, the dew point fell too, permitting a stable growth of drops. Maximum drop sizes and minimal VIS values were observable while the number of droplets decreased and stayed at a low constant level. The dispersal of the three fog occurrences came along with a change of temperature. As far as the second CPs, the temperatures had decreased to a (local) minimum level. From that time on, temperatures had a tendency to increase and RH ascended, slightly, once again. The different times of the second CPs are striking and thus, the beginning of the dissipation stages. The first and the third fog events featured it simultaneously with sunrise around 06:00 LT, while for the second fog event the dissipation stage began in the middle of the night at 01:57 LT. Because of increasing temperatures, turbulent fluxes increased as well by which vertical mixing was enhanced and droplets evaporated after having shrank to a critical size. Supporting measurements of radiation fluxes were not available. Comparable studies such as Gultepe et al. (Citation2009) showed that reduced incoming short-wave radiation fluxes (up to −300 W m−2) may result in temperature decreases of up to −9 K as a consequence of fog effects. The mixing and shifting of air masses could be seen in an increase from air speed during the end of the first fog event from around 0.5 m s−1 up to 2 m s−1 (c). Furthermore, the cloud ceilings from this event (d) indicate a take-off of the fog. At once, when a formation of the cloud base was recorded at 20:00 LT, the fog top shifted to a higher altitude. After three more hours, a stratus cloud with distinct cloud ceilings prevailed 500 m above the ground. However, the energy for droplet evaporation during the second fog event from 31 October 2011 to 1 November 2011 could not have come from solar insolation after sunrise. The nocturnal growth of wind speed from around 0.5 m s−1 up to 2 m s−1 had a different cause, namely a change of general weather conditions (Section 2.2, b). Overnight a zonal ridge across Central Europe was replaced by an anticyclonic southerly, accompanied by an inflow of warmer air masses from the south. These did not only originate with a sudden increase of wind speed from 0.5 to 2.5 m s−1, but also a change of wind direction from mainly northwest to southeast (c). Hence, ground temperatures rose suddenly after the second CP at 01:57 LT from ca. 3°C up to 7°C and stayed constantly at this level. Due to the inflow of warmer air masses over colder and moisture air masses, the dew point rose and fog droplets evaporated. As a result, the fog dissolved and VIS rose consequently. The humid air masses from the ground shifted upwards and recondensed at 06:00 LT at a height of about 100 m, from where they spread up to 400 m (d).
An additional analysis of the meteorological standard parameters exposed the presumable cause. Increasing temperatures as a principal source of fog dissipation originated for two occurrences from insolation with beginning of sunrise (26–27 October 2011 and 13–14 November 2011) and for one from a change of the principal weather conditions from zonal ridge across Central Europe to anticyclonic southerly (31 October 2011–1 November 2011) midway through the fog event. Thus, two differing mechanisms of fog dissipation proceeded which affected the evolution of microphysical and meteorological parameters. In total, the first time series of the three examples showed an increase of all three microphysical parameters with maximal values of N t and LWC. The second phase of the three fog events revealed a further growth of r mean reaching maximum values, whereas N t and LWC decreased and levelled off at a lower standard. The last phase could be described with an omnipresent downward tendency of all three microphysical parameters which subsequently reached zero, mostly attended by a last local maximum.
5. Summary and conclusion
The intention of this study was the development of an objective statistical method for the separation of fog events into individual life cycle phases. For this purpose, the statistical approach of double sum curves was applied to three fog events in autumn 2011 in central Germany. By use of the homogeneity test of Mann–Whitney, two potential CPs per double sum curves of measured time series of microphysical fog properties and VIS could be identified. The following trend-tests of Mann–Kendall and the two-sided t-tests on the slopes of the three phases per fog event provided the statistical significance of the CPs. As the CPs of the microphysical properties and the corresponding VIS coincided at the same points in time, the latter can be used as a reliable criterion for the separation of measurement series of LWC, N t and r mean in different evolutionary stages during the fog life cycle. With respect to the obtained results, it can be stated that an objective method with distinct criteria for the investigation and classification of radiation fog incorporating the different evolutionary stages could be derived. However, the analyses were limited to only three fog events. For more representative results, further fog events have to be analyzed with this method.
By comparing the three distinguishable phases, derived from the developed statistical approach with existing classifications of radiation fog, good agreements have been found with the GFM discriminating three stages and the PFM with four evolutionary stages. Their criteria for the separation of the evolutionary stages, as the predetermined points in time of VIS within the fog duration did not correspond with our findings. However, the general trends of the phase-specific microphysical properties are in good agreement with our results. Almost all measured values of N t and r mean lay in the published ranges of the three evolutionary stages, merely LWC was underestimated during the formation stage.
A comparison of the separated phases between the three fog events revealed that the characteristic microphysical properties in each phase correspond well between the three fog events.
It seems possible to characterize the evolutionary stage of the respective fog event by stage specifically averaged values of the measured microphysical parameters over all three fog events. However, for substantiated results in this direction, much more measurements and analyses of radiation fog events are needed. In this context, this method is a valuable method for the required statistical analyses.
Even though different mechanisms are responsible for the fog development, as seen by the two diverse synoptic situations responsible for fog dissipation (26–27 October 2011 vs. 31 October 2011– 1 November 2011) the applied statistical approach seems to work well. The differentiation between mature fog and dissipation stage at the second CPs fit well with the changing tendencies of the microphysical and meteorological parameters.
6. Acknowledgments
The authors thank the German Research Foundation DFG for funding the project (BE1780/14-1; TH1531/1-1). The work is also part of the COST action EG Climet. The authors are also thankful to Sebastian Achilles for his support during the measurements.
Related Research Data
References
- AK KLIWA. Long-run behaviour of flood flows in Baden-Württemberg and Bavaria. KLIWA-reports 2. 2002; Karlsruhe: Stork Druck. 1–98.
- Bendix J , Schenk W . Ein neuer Methodenverbund zur Erfassung der klimatologisch-lufthygienischen Situation von Nordrhein-Westfalen. Untersuchungen mit Hilfe boden- und satellitengestützter Fernerkundung und numerischer Modellierung. Bonner Geographische Abhandlungen 98. 1998; E-Ferger Verlag, Bonn, Germany. 1–183.
- Bendix J . A satellite-based climatology of fog and low-level stratus in Germany and adjacent areas. Atmos. Res. 2002; 64: 3–18.
- Bennett A. J , Gaffard C , Oakley T , Moyna B . Cloud radar – initial measurements from the 94 GHz FMCW cloud radar. Proceedings of the 8th International Symposium on Tropospheric Profiling. 2009; Delft. 1–8. 19–23 October.
- Bergot T , Guédalia D . Numerical forecasting of radiation fog. Part I. Numerical model and sensitivity tests. Mon. Weather. Rev. 1994; 122: 1218–1230.
- Brown R , Roach W. T . The physics of radiation fog. II. A numerical study. Q. J. Roy. Meteorol. Soc. 1976; 102: 335–354.
- DMT. Cloud Droplet Probe (CDP). Manual. DOC-0029. Rev N-3. 2012; Boulder, CO: DMT. 1–55.
- Dupont J. C , Haeffelin M , Protat A , Bouniol D , Boyouk N , co-authors . Stratus–fog formation and dissipation. A 6-day case study. Bound. Lay. Meteorol. 2012; 143: 207–225.
- Duynkerke P. G . Turbulence, radiation and fog in Dutch stable boundary layers. Bound. Lay. Meteorol. 1999; 90: 447–477.
- DWD. General weather situations of Europe. 2011. Online at: http://www.dwd.de/GWL. Last page view: 10/24/2012.
- Findlater J . Field investigations of radiation fog formation at outstations. Meteorol. Magaz. 1985; 114: 187–201.
- Fitzjarrald D. R , Lala G. G . Hudson Valley fog environments. J. Appl. Meteorol. 1989; 28: 1303–1328.
- Fuzzi S , Facchini M. C , Orsi G , Lind J. A , Wobrock W , co-authors . The Po Valley fog experiment 1989. An overview. Tellus. 1992; 44B: 448–468.
- Fuzzi S , Laj P , Ricci L , Orsi G , Heintzenberg J , co-authors . Overview of the Po Valley fog experiment 1994 (CHEMDROP). Contr. Atmos. Phys. 1998; 71: 3–19.
- Gultepe I , Müller M. D , Boybeyi Z . A new visibility parameterization for warm-fog applications in numerical weather prediction models. J. Appl. Meteorol. Clim. 2006; 45: 1469–1480.
- Gultepe I , Pearson G , Milbrandt J. A , Hansen B , Platnick S , co-authors . The fog remote sensing and modeling field project. Bull. Am. Meteorol. Soc. 2009; 90: 341–359.
- Gultepe I , Tardif R , Michaelides S. C , Cermak J , Bott A , co-authors . Fog research. A review of past achievements and future perspectives. Pure. Appl. Geophys. 2007; 164: 1121–1159.
- Haeffelin M , Bergot T , Elias T , Tardif R , Carrer D , co-authors . PARISFOG. Shedding new light on fog physical processes. Bull. Am. Meteorol. Soc. 2010; 91: 767–783.
- Hansel N , Schäfer U . The double sum analysis. Water management-water technology. 1970; 20: 145–149.
- Hess P , Brezowsky H . Catalog of the general weather situations of Europe (1881–1976). Reports of the German Weather Service. 1977; 113: 1–54.
- Huggard P. G , Oldfield M. L , Moyna B. P , Ellison B. N , Matheson D. N , co-authors . 94 GHz FMCW cloud radar. Proceedings of the SPIE symposium on millimetre wave and terahertz sensors and technology. 2008; Cardiff. 1–6. 15–18 September.
- James P. M . An objective classification method for Hess and Brezowsky Grosswetter-lagen over Europe. Theor. Appl. Climatol. 2007; 88: 17–42.
- Juisto J. E , Lala G. G . The fog project – 1982. Proceedings of 9th Conference on Aerospace and Aeronautical Meteorology. 1983; NE, AMS: Omaha. 95–98. 6–9 June.
- Kendall M. G , Stuart S , Kendall M G . Advanced theory of statistics. Part 1. Distribution theory. 1969; London: Griffin. 1–439.
- Lala G. G , Jiusto J. E , Meyer M. B , Komfein M . Mechanisms of radiation fog formation on four consecutive nights. Preprints of Conference on Cloud Physics. 1982; IL, AMS: Chicago. 9–11. 15–18 November.
- Lala G. G , Mandel E , Jiusto J. E . A numerical investigation of radiation fog variables. J. Atmos. Sci. 1975; 32: 720–728.
- Liu D , Yang J , Niu S , Li Z . On the evolution and structure of a radiation fog event in Nanjing. Adv. Atmos. Sci. 2011; 28: 223–237.
- Maier F , Thies B , Bendix J . Simulating Z–LWC relations in natural fogs with radiative transfer calculations for future application to a cloud radar profiler. Pure. Appl. Geophys. 2012; 169: 793–807.
- Mann H. B . Nonparametric tests against trend. Econometrica. 1945; 13: 245–259.
- Mann H. B , Whitney D. R . On a test of whether one of two random variables is stochastically larger than the other. Ann. Math. Stat. 1947; 18: 55–60.
- Meyer M. B , Lala G. G , Jiutso J. E . FOG-82. A cooperative field study of radiation fog. Bull. Am. Meteorol. Soc. 1986; 67: 825–832.
- Nakanishi M . Large-eddy simulation of radiation fog. Bound. Lay. Meteorol. 2000; 94: 461–493.
- Pettitt A. N . A non-parametric approach to the change-point problem. J. R. Stat. Soc. 1979; 28: 126–135.
- Pilié R , Eadie W , Mack E , Rogers C , Kocmond W . Project fog drops. Part 1. Investigations of warm fog properties. NASA Contractor Report. 1972; 1–149. No. 2078. Buffalo, New York: Cornell Aeronautical Laboratory, Inc..
- Pilié R. J , Mack E. J , Kocmond W. C , Eadie W. J , Rogers C. W . The life cycle of valley fog. Part II. Fog microphysics. J. Appl. Meteorol. 1975a; 14: 364–374.
- Pilié R. J , Mack E. J , Kocmond W. C , Rogers C. W , Eadie W. J . The life cycle of valley fog. Part I. Micrometeorological characteristics. J. Appl. Meteorol. 1975b; 14: 347–363.
- Price J . Radiation fog. Part I. Observations of stability and drop size distributions. Bound. Lay. Meteorol. 2011; 139: 167–191.
- Roach W. T , Brown R , Caughey R , Garlands J , Readings C. J . The physics of radiation fog. I. A field study. Q. J. Roy. Meteorol. Soc. 1976; 102: 313–333.
- Schönwiese C. D . Applied statistics for meteorologists and earth scientists. 2006; Bornträger, Berlin. 1–302.
- Schulze-Neuhoff H . Detailed analysis of fog based on additional 420 weather stations. Meteorol. Rundsch. 1976; 29: 75–84.
- Stewart D. A , Essenwanger O. M . A survey of fog and related optical propagation characteristics. Rev. Geophys. 1982; 20: 481–495.
- Terradellas E , Bergot T . Comparison between two single-column models designed for short-term fog and low-clouds forecasting. Fisica de la Tierra. 2008; 19: 189–203.
- Turton J. D , Brown R . A comparison of a numerical model of radiation fog with detailed observations. Q. J. Roy. Meteorol. Soc. 1987; 113: 37–54.
- Wendisch M , Mertes S , Heintzenberg J , Wiedensohler A , Schell D , co-authors . Drop size distribution and LWC in Po Valley Fog. Contr. Atmos. Phys. 1998; 71: 87–100.
- WMO. International Meteorological Vocabulary. 1992; WMO: Geneva. 1–276. Vol. 182.
- WMO. Technical Document 1186. The WCDMP ‘guidelines’ series. 2003; WMO: Geneva. 1–50.
- Zhou B. B , Ferrier B. S . Asymptotic analysis of equilibrium in radiation fog. J. Appl. Meteorol. 2008; 47: 1704–1722.
7. Appendix
For the discrimination of fog life cycle phases CPs in time series (t) of microphysical parameters and VIS (x) were used. In more detail, the cumulative sum of the latter (x t ) until time step t was plotted as a function of the cumulative sum of time (1≤t≤T; with T end time of time series). On condition that the time series was homogeneous, it revealed a unique slope, meaning a constant arithmetic average all along the double sum curve. In case of inhomogeneities in a time series, a change of slope in the double sum curve could be observed. Consequently, its double sum curve was split in separate curve segments x 1(t 1) to x n (t n ) with diverging slopes and arithmetic means for each segment derived. In three consecutive tests, CPs in the double sum curves could be found and their statistical reliability be tested.
A.1. Step: identifying potential CPs with the homogeneity test of Mann–Whitney
For finding CPs in the calculated double sum curves of the microphysical parameters and VIS the non-parametric test of Mann–Whitney (Mann and Whitney, Citation1947), later modified by Pettitt (Citation1979), was used as suggested by the WMO (Citation2003). The rank-test yielded the most possible points in time within time series where changes occurred. However, no information about the significance of the CPs can be derived with this procedure. The test statistic (U
t,T
) is defined asA.1
andA.2
The most possible CP t
CP is the point where U
t,T
becomes maximum.A.3
The derived CP split the double sum curve segment in two different trend curves defined byA.4
Their slopes B
x1t1 and B
x2t2
A.5
and intercepts A
x1t1 and A
x2t2
A.6
were calculated by linear regression (Schönwiese, Citation2006) whereby s xt was the covariance of the time and the measured quantities, s t 2 was the variance of the time and n was the number of time steps.
If a CP was found, the result of Step 1 is the segmentation of the double sum curve in two curve segments separated by aCP. It should be noted that the double sum analysis is conducted several times for every curve segment derived from a previous analysis step.
A.2. Step: Mann–Kendall trend-test
Once the potential CPs were determined, the separated two curve segments had to be tested for homogenous (and significant) trends in a second step to warrant that the found segments were consistent. For this, the non-parametric trend-test according to Mann (Citation1945) and Kendall (Kendall and Stuart, Citation1969) was utilized. The Mann–Kendall test statistic isA.7
where i, j are successive points in time.
If the number of considered time steps n>10, Q could be considered as standard normal distributed with an arithmetic mean of zero and a variance ofA.8
Consequently, the standard normal distributed test statistic isA.9
that could be used for a two-sided test on significance with H 0 (µ x (t)=const) and H A (µ x (t) decreases or increases with time). Thus, the split time series was determined which featured homogenous trends.
A.3. Step: two-sided t-test for compatibility of the slopes of the evolutionary stages
As mentioned above, the homogeneity test of Mann–Whitney only provided possible positions of CPs in the measurement series of the examined parameters. However, it could not give evidence of its statistical significance. In order to test if a CP split a double sum curve at the right place in two significantly different curve segments, the consistency of their slopes had to be tested with H
0 (B
x1t1=B
x2t2) and H
A
(B
x1t1≠B
x2t2). Thereby different slopes represented different mean values in both curve segments. A change of the slope at the CP in the double sum curve was validated by a two-sided t-test on the slopes of the two curve segments with the following test statistic (Schönwiese, Citation2006)A.10
withA.11
and being the residual variances and n
1, n
2 representing the number of time steps in the time series before or after the CP. The corresponding degrees of freedom was given by
A.12
Provided that a point in time within the double sum curve of a measurement series passed all three listed tests, it was regarded as a statistically significant CP.