Abstract
The effects of aerosol on cloud droplet effective radius (R eff), cloud optical thickness and cloud droplet number concentration (N d) are analysed both from long-term direct ground-based in situ measurements conducted at the Puijo measurement station in Eastern Finland and from the Moderate Resolution Imaging Spectroradiometer (MODIS) instrument onboard the Terra and Aqua satellites. The mean in situ N d during the period of study was 217 cm−3, while the MODIS-based N d was 171 cm−3. The absolute values, and the dependence of both N d observations on the measured aerosol number concentration in the accumulation mode (N acc), are quite similar. In both data sets N d is clearly dependent on N acc, for N acc values lower than approximately 450 cm−3. Also, the values of the aerosol–cloud-interaction parameter [ACI=(1/3)*d ln(N d)/d ln(N acc)] are quite similar for N acc<400 cm−3 with values of 0.16 and 0.14 from in situ and MODIS measurements, respectively. With higher N acc (>450 cm−3) N d increases only slowly. Similarly, the effect of aerosol on MODIS-retrieved R eff is visible only at low N acc values. In a sub set of data, the cloud and aerosol properties were measured simultaneously. For that data the comparison between MODIS-derived N d and directly measured N d, or the cloud droplet number concentration estimated from N acc values (N d,p), shows a correlation, which is greatly improved after careful screening using a ceilometer to make sure that only single cloud layers existed. This suggests that such determination of the number of cloud layers is very important when trying to match ground-based measurements to MODIS measurements.
1. Introduction
Atmospheric aerosols can have important direct radiative impacts, and indirect impacts through their effect on cloud microphysical properties. The total effect of aerosol particles on the global radiation budget is negative (IPCC, Citation2007), and thus they are partly counteracting the warming effect caused by the increased concentrations of greenhouse gases. However, due to highly varying concentrations and composition of aerosols, and feedbacks from the climate system onto aerosols and clouds, the total effect on the global radiation budget is not well known. Aerosols can affect the number concentration of cloud droplets (N d) and thereby the impact that clouds have on radiative transfer in the atmosphere. However, this interaction is complex and it produces the largest single uncertainty in the estimates of Earth's radiation budget (IPCC, Citation2007). The interaction between aerosol and cloud, and cloud formation is not a trivial process; it depends on many factors including local weather parameters along with the chemical, optical and dynamical properties of aerosol and cloud (McFiggans et al., Citation2006; Romakkaniemi et al., Citation2006; Reutter et al., Citation2009).
Cloud droplet number concentration during the formation of cloud droplets is determined by the aerosol size distribution and chemical composition, the amount of condensable gases, the temperature and the updraft velocity of the air parcel entering the cloud (McFiggans et al., Citation2006). The first two define how many particles can maximally act as cloud condensation nuclei (CCN) at some supersaturation, and the last two depend on the local meteorology. Theoretically, an increase in the aerosol concentration should lead to an increase in N d, which has been observed in several direct measurements of aerosol–cloud interactions (ACI) (e.g. Snider et al., Citation2003; Komppula et al., Citation2005; Meskhidze et al., Citation2005; Portin et al., Citation2009). If N d increases throughout a cloud whilst holding the liquid water path (LWP) constant, the effective radius R eff of cloud droplets decreases, and this increases cloud optical thickness (COT) and cloud albedo (Twomey, Citation1977). This effect has been termed the first aerosol indirect effect. Furthermore, changes in N d affect also drizzle formation so that increased N d suppresses rain formation efficiency and ultimately enhances cloud fraction (Albrecht, Citation1989). This process has been termed the second indirect effect. However, due to the complexity of the processes of cloud and drizzle formation, it is not always trivial to observe these different effects as there are several feedbacks involved in the cloud systems (Stevens and Feingold, Citation2009).
Beyond direct in situ measurements, it is also possible to use remote sensing tools, such as satellite instruments (e.g. Nakajima et al., Citation2001) or ground-based instruments as deployed in the Atmospheric Radiation Measurement (ARM) programme (e.g. Dong et al., Citation2008), to study the aerosol effect on clouds. The difficulty with estimating ACI remotely by satellite is a lack of coincident information of both the cloud and the aerosol residing below the cloud. Thus, some studies have used ground-based data for aerosol properties and satellite data for cloud properties (e.g. Boers et al., Citation2006; Lihavainen et al., Citation2010; Janssen et al., 2011), and in some cases satellite retrievals have been validated with airborne measurements (e.g. Schüller et al., Citation2003; Painemal and Zuidema, Citation2011). Quite often different measurement methods give different cloud responses to aerosol perturbation and several reasons have been proposed for this difference (Lihavainen et al., Citation2010; McComiskey and Feingold, Citation2012).
In this article, we focus on ACIs observed both in situ and remotely. We use the measurement data from Puijo station in Finland together with cloud retrievals from the Moderate Resolution Imaging Spectroradiometer (MODIS) instruments onboard the Aqua and Terra satellites to assess the effect of aerosol concentration on N
d, COT and R
eff. The relation between accumulation mode particle concentration (N
acc) from ground-based measurements and COT and R
eff, from MODIS is studied to see how aerosol affects the optical and microphysical properties of low clouds. We also compare N
d and the aerosol–cloud interaction (ACI) (Feingold et al., Citation2001; McComiskey et al., Citation2009; Lihavainen et al., Citation2010) parameter values derived from satellite data to those from direct measurements. ACI parameters are a commonly used set of metrics that associate changes in N
d, R
eff and COT to changes in aerosol burden, for example, N
acc or aerosol optical thickness. Here, we focus on the ACI that pertains to N
d. A significant amount of work has already been done regarding ACIs over ocean – for example, the VOCALS-Rex campaign (Wood et al., Citation2011) – but to our knowledge this is the first time that long-term ground-based aerosol and cloud droplet measurements have been compared to satellite retrievals for continental clouds.
2. Investigation site and data sets
2.1. Puijo measurement station
The measurement station at Puijo (62°54′34′′N, 27°39′19′′E) is on top of an observation tower located near the city of Kuopio. The measurements are carried out at a height of 306 m above sea level and 224 m above the surrounding lake level. The regional terrain consists mainly of lakes, small hills, forests, urban areas and rural areas. Overall, the surroundings of the measurement station are quite homogeneous with regard to aerosol sources, with only a few point sources of aerosol emissions. Since 2005/06, the station has been instrumented for continuous measurements of aerosols, cloud droplets, weather parameters and trace gases (Leskinen et al., Citation2009; Portin et al., Citation2009). Below, we give a brief description of the instruments used in our study, also listed in .
Table 1. Instruments used in these studies
The aerosol size distribution is measured with a twin Differential Mobility Particle Sizer (DMPS) system which has a measurement range from 7 to 800 nm in diameter. The device is operated with two different inlets, which allows interstitial particles and those inside cloud droplets to be distinguished. For the direct measurements of cloud droplet number concentration and their size distribution a Cloud Droplet Probe (CDP, Droplet Measurement Technologies) is used. The device has a measurement range of 3–50 µm in diameter. In the present work, we have used one-hour-averaged data for N acc and N d for a large area (1°×1°) analysis, and 5 minutes N d averages for a smaller area (5×5 km) analysis. In the latter, the shorter averaging time is used to match the satellite observation time as well as possible. In the comparison of cloud properties to aerosol data, a one-hour averaging time is used to get reliable statistics from the aerosol measurements as the DMPS system used takes 12 minutes for a single distribution scan. These data are compared with 1°×1° satellite data since data at this resolution are readily available as MODIS-level three data. The elevation of cloud layers is detected with a Ceilometer (Vaisala CT25 K) located at the Savilahti research station less than 2 km from Puijo and 219 m below the Puijo station measurement level.
Cloud events, defined as when the station is surrounded by clouds with high enough liquid water content (LWC>0.02 gm−3) for at least an hour, occur most frequently at Puijo in October when the top of the Puijo tower is inside cloud on more than 40% of days. Since June 2006, there have been 450 cloud events with a total 3000 hours of data. This data set was screened to remove rain events, discontinuous clouds, icing conditions and warm days (which cause an overheating of the CDP). After careful screening we are finally left with 414 cloud hours with reliable CDP data.
In an earlier study, Portin et al. (Citation2009) analysed the dependence of N
d on aerosol properties for the same region. They showed that, in the cloud typical to Puijo station, N
d is dependent on N
acc, which they defined to be particles larger than 100 nm in diameter. It was found that a proxy cloud droplet number concentration (N
d,p) that matched the observed N
d well can be calculated with the following relation:1
Here the constants a and b were obtained by data fitting, with values of 30.13 and 0.36 respectively [these are updated values based on a larger data set than the one used by Portin et al. (Citation2009)]. Using this equation we can estimate the droplet concentration of the clouds above the tower by assuming that the relation is representative for all boundary layer clouds observed close to the station.
2.2. Satellite data
We use collection 5.1 data from MODIS instruments onboard both the Aqua and Terra polar synchronous orbiting satellites. The primary quantities of interest were R eff and COT (MODIS ATBDT – cloud products; King et al., Citation1997; Platnick et al., Citation2003). We also used MODIS cloud-top temperature and cloud-top pressure data to ensure that the analysed clouds were low-level clouds. Further details on the data selection and filtering are provided in Section 3.
From the measured parameters, R
eff and COT it is possible to estimate N
d as well as LWP (e.g. Wood and Hartmann, Citation2006; Bennartz, Citation2007) using2
and3
In this study all the quantities are averages over cloudy pixels only and therefore cloud fraction (C
F) is 1. In eq. (2) k is the cube of the ratio between the volume mean radius (R
v) and the effective radius of droplets () with a given constant value of 0.67 (Martin et al., Citation1994) in our study, Q is the scattering efficiency whose value is approximately 2, and ρ
w is the density of water. For this calculation, it is assumed that LWC increases linearly with height from cloud base to cloud top (i.e. that the clouds are adiabatic). C
w is the ‘condensation rate’ for such a moist adiabatic ascent given by
4
Here q
v and q
L are the water vapour and liquid mixing ratios; L
v is latent heat of condensation of water; C
p is the specific heat capacity of dry air at constant pressure; and Γ
d (=g/C
p, where g is the gravitational acceleration) and Γ
m are the dry and moist adiabatic lapse rates, respectively. C
w depends mainly on temperature (T), although there is also some weak pressure (P) dependence. This equation can be derived through consideration of the conservation of moist static energy during moist adiabatic ascent, that is,5
Here R a is the specific gas constant for dry air (=287.04 J kg−1 K−1). Then eq. (4) above can be obtained by dividing by dz, inserting the hydrostatic equation and recognising that the temperature change dT/dz will be the moist adiabatic lapse rate (Γ m).
3. Cloud event selection
For the comparison of ground-based measurements and MODIS data, it is crucial that only a single layer of cloud exists. For some of our comparison single-layered cloud events were chosen using data from the Vaisala CT25 K Ceilometer and/or by limiting the MODIS-retrieved cloud-top pressure and temperature values. Using meteorological data from Puijo station and cloud-phase information from MODIS, we limited our study to non-precipitating low-level liquid clouds. A limit of satellite-derived R eff (3 µm ≤R eff≤30 µm) is also applied to make the selection of liquid-only cloud more reliable (Nakajima and King, Citation1990).
After screening out the possible ice phase and rain clouds, we further divided the satellite data used in this study into three categories:
For category I events the Puijo station (where the CDP instrument was located) was determined to be inside cloud by requiring that the LWC measured from the CDP was greater than 0.02 g m−3 for at least an hour and the visibility during that hour was less than 200 m. MODIS Level 2 collection 5.1 data were taken from the LAADS WEB website for both Aqua and Terra overpasses that occurred within the time window of a 5-minute averaged CDP data point. N d was calculated using eq. (2) for the 25 1×1 km pixels centred on the measurement station to give a value averaged over 5×5 km. To avoid rain contamination, the maximum allowed rain intensity was limited to 0.2 mm hour−1. To help ensure that the cloud over the 5×5 km region was as close to plane parallel as possible it was required that at least 90% of the 25 pixels were designated as cloudy, clear or undetermined by the MODIS phase algorithm and did not suffer from sunglint. All of these pixels were then required to be assigned liquid cloud status, ensuring that at least 90% of the 5×5 km region was liquid cloud. In order for the data point to be used, it was required that at least 90% of the pixels that remained after the screening had successful R eff and COT retrievals and had cloud water path quality assurance flags of ‘very good confidence’ (the highest possible). The minimum cloud-top temperature within the 5×5 km area was also limited to be above 273°K to ensure that no ice could be present in the cloud. R eff retrievals made using the 2.1-µm band are used here for consistency with the Level-3 retrievals. However, using the 3.7-µm band retrievals produced similar results, perhaps due to the efforts to only include clouds that were homogeneous in terms of cloud fraction. Category I data is used for the direct comparison of cloud number concentration obtained from the in situ CDP measurements and from MODIS retrievals. Thirteen events were available for this comparison. Five-minute averages of N d data from the CDP were used and were matched closely to the MODIS overpass time in order to account for the likelihood of the rapid time evolution of the cloud fields and to help prevent spatial variability and local effects from biasing the comparison. 5×5 km data points with a MODIS N d standard deviation greater than 150 cm−3 were also removed.
Category II events consist of cloud layers with base height less than 800 m above Savilahti station (likely boundary layer cloud). The maximum rain intensity (obtained from the weather station) is limited to 0.2 mm hour−1 and cloud-top temperature (from MODIS) was limited to more than 265 K. The same limit for cloud-top temperature was used in the International Cloud Climatology Project (ISCCP) classification for low-level cloud (Cairns, Citation1995). In this category, the cloud was directly above Puijo in the boundary layer, and thus we assume that the aerosol measured at Puijo represents well the aerosol at cloud base. Thus we calculate N d,p from the DMPS N acc value using eq. (1). For comparison, MODIS 5×5 km Level 2 collection 5.1 data were used to calculate a MODIS N d in the same manner as for category I. The difference here is that the lifting of the restriction that the Puijo station is inside cloud allows more data points to be considered. In this category, 62 events were available for analysis over the observation period (2006–2011).
Category III consists of cloud layers with cloud-top temperature and pressure more than 265 K and 780 hPa, respectively. In this category, the region is cloudy, but we do not know whether there was cloud directly above the Puijo station. Nevertheless, we assume that the one-hour-averaged N acc that approximately corresponds to the times of the local MODIS (Aqua and Terra) overpasses is representative of the regional boundary layer aerosol over the observational region. We calculate N d,p using eq. (1). This was compared to N d values calculated using the mean R eff and COT from MODIS (Aqua and Terra) 1°×1° Level 3 collection 5.1 data, which was taken from the GES DISC Giovanni website (http://disc.sci.gsfc.nasa.gov/giovanni/). A total of 1058 MODIS overpasses were recorded since 2000, out of which 481 remained with coincident N acc data over the period of 2006–2011.
4. Results
The satellite-derived R eff and COT from the category III data have average values of 11.6±2.9 µm and 13.2±8 µm, respectively, for the observation period 2006–2011. These values are comparable to those presented by Janssen et al. (2011) derived over a 2°×2° area above the Hyytiälä measurement station 200 km southwest of Puijo station. Similar results can be expected because both areas are quite comparable in terms of aerosol sources. The average N d calculated from eq. (2) is 171 cm−3. This value is higher than the range 40–100 cm−3 obtained by Janssen et al. (2011) and at the upper end of the range 45.2 cm−3 (clean pixels) – 132 cm−3 (polluted pixels) obtained by Sporre et al. (Citation2011) for a cleaner area. One possible reason for the difference is the different method used to derive N d, as Janssen et al. (2011) used models from Boers et al. (Citation2006). We also tested the method used in Sporre et al. (Citation2011) obtaining an average N d of 156 cm−3. For comparison, the average N d from the CDP data is 217 cm−3, which is quite close to the MODIS-measured N d.
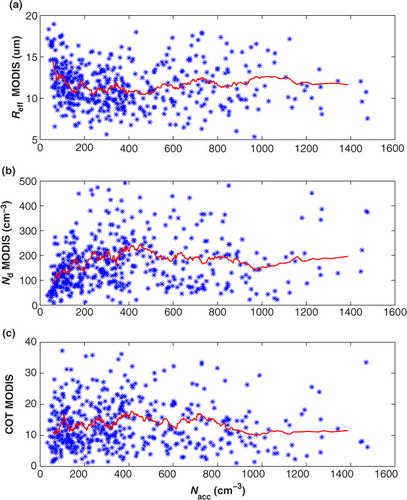
To study the dependence of N d on aerosol particles we have analysed the number concentration (N acc) of particles larger than 100 nm in diameter at the Puijo measurement station. We also tested different minimum sizes between 80 and 150 nm for the definition of N acc particles, and found that the following results are insensitive to these choices. In we compare N acc to MODIS-retrieved R eff, COT and N d for the category III data. The line indicates a running mean of 30 data points to make trends more readable for eye. We can see that at low values of N acc both R eff and N d are clearly dependent on N acc. At high values this is not the case. The calculated Spearman correlation between MODIS-retrieved N d and N acc for values less than 400 cm−3 is 0.38, and the ACI parameter is 0.14 when calculated from the linear fit between N acc values of 70 cm−3 and 400 cm−3. For larger N acc, there is no correlation and the average N d remains almost constant at around 215 cm−3. For COT, we found no dependence on N acc, which is interesting given the observed dependence of N d on N acc since it would be expected that for a fixed adiabatic cloud thickness (H) COT would increase proportionally with N d 1/3. However, COT is also proportional to H 5/3 in such an adiabatic cloud – that is, a cloud with the same assumptions as those used in deriving eqs. (2) and (3) – and thus is much more sensitive to changes in H than to changes in N d. Such changes in H are likely to occur due to the influence of local meteorological changes, thus making it more difficult to see the effect of N d and aerosol on COT in the rather noisy data.
Fig. 1 The effect of accumulation mode particle number concentration on effective radii, (a), cloud droplet number concentration (b) and cloud optical thickness (COT) (c) retrieved from Moderate Resolution Imaging Spectroradiometer (MODIS) during 2006–2011. Red lines are the 30-point running mean. Our category III data are used here.
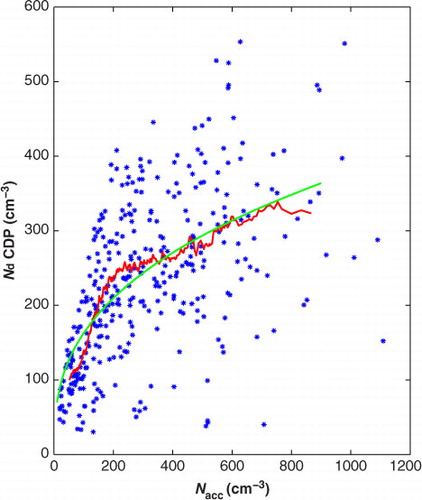
Similarly to , in we show how the in situ measured N d from the CDP depends on the N acc. In this case, the Spearman correlation is 0.63 for N acc less than 400 cm−3. As expected, the correlation is higher in direct measurements as the cloud droplets and aerosols are measured in the same place. The ACI value calculated from these data was 0.16 (and 0.12 using eq. (1) with fitted parameters) on average for N acc lower than 400 cm−3. Both ACI values are very similar to those reported by Garrett et al. (Citation2004) who documented ACI values in the range of 0.13–0.19 using ground-based measurements of low-level liquid clouds observed near Barrow Alaska. Lihavainen et al. (Citation2010) reported measurements conducted in a cleaner area in Northern Finland, where ACI values of 0.2 to 0.3 were obtained from ground-based measurements and approximately 0.1 from satellite measurements.
Fig. 2 Cloud droplet number concentration as a function of accumulation mode aerosol number concentration from Puijo station between 2006 and 2011. The red line is a 30-point running mean and the green line is a fit based on eq. (1).
Both data sets show that N d is only weakly, or not at all dependent on N acc at high aerosol loadings. The reason for this finding is the complex dynamics of cloud formation. In the type of clouds observed at Puijo, the updraft velocities are quite low, and in such conditions N d is typically only weakly dependent on aerosol particle concentration above some threshold concentration (Reutter et al., Citation2009; Romakkaniemi et al., Citation2012). When comparing the in situ and MODIS data sets, we can see some differences. For example, for the in situ measurements the running mean of N d is still increasing at high aerosol loading, but this is not the case in the MODIS-derived N d. This might be because for the in situ measurements there are no small N d values with high aerosol loading, but in MODIS-derived data such data points do exist. As we are correlating local aerosol concentrations with cloud properties determined from a larger area, it is always possible that some local source might have increased the measured aerosol concentration above that of the observational area, or that some local aerosol are not effective as CCN.
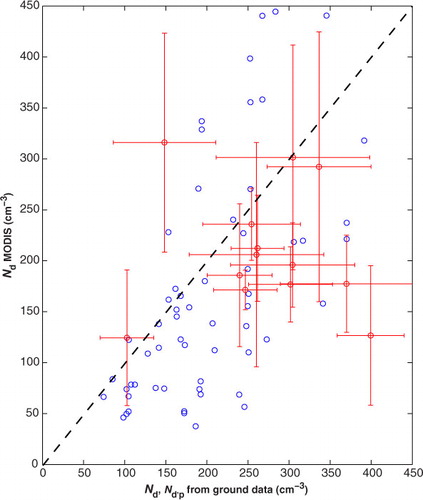
In we show N d retrieved from MODIS as a function of that directly measured in the cloud (category I, red circles) or estimated from aerosol measurements at Puijo station (category II, blue circles). In the case of direct measurements we have also included the standard deviation of the observed N d over the 5×5 km area. It can be seen that the in situ CDP and MODIS N d values are slightly anti-correlated, with a correlation coefficient of −0.07 (but with 95% confidence limits ranging from −0.6 to +0.5) and an RMSE value of 118.9 cm−3. There is a tendency for the MODIS N d values to be clustered around the same value, whereas corresponding CDP N d values can reach somewhat higher values. The mean value from the in situ measurements (271 cm−3) is higher than the MODIS-retrieved one (209 cm−3). Here, we also tested different spatial averaging from MODIS and temporal averaging from CDP measurements, but the agreement between retrievals was not improved.
Fig. 3 Moderate Resolution Imaging Spectroradiometer (MODIS)-retrieved N d for categories I and II versus N d or N d,p from Puijo station, as measured from the Cloud Droplet Probe (CDP) (red, N d) and estimated from eq. 1 (blue, N d,p), respectively. The vertical bars for the category I MODIS data show the standard deviations over the 5×5 km areas combined with the Moderate Resolution Imaging Spectroradiometer (MODIS) measurement error. The horizontal bars show the CDP standard deviation over the 5-minute averaging period.
However, given the low number of data points the correlation could easily have occurred by chance. Indeed the 95% confidence limits of the correlation coefficient cover a very wide range suggesting that this is a strong possibility. When the data were further filtered to remove multiple-layer cloud using ceilometer, much better agreement was found (r=0.44 with upper and lower 95% confidence limits of −0.47 and 0.9, respectively). However, only seven data points remained making firm conclusions difficult.
When category II data, where the in situ N d is estimated (N d,p) from the measured N acc using eq. (1) and thus the restriction that the Puijo station is in cloud is lifted, are compared to MODIS-derived N d, the correlation is also good. But again only when the data are filtered using the ceilometer data to make sure single boundary layer cloud (cloud base height less than 800 m) existed, although there are still some points that are far from the one-to-one line. The RMSE and correlation coefficient values in this case are 99.6 cm−3 and 0.65 (the 95% confidence limits are 0.47 and 0.78), respectively. The results from the category I and category II data suggest that the height of the cloud under consideration and whether it is within the boundary layer, which is likely well mixed, is very important for matching ground measurements to satellite measurements. Additionally, the good match between MODIS and the N d,p suggests that the MODIS retrievals themselves are not be the sole cause of the CDP discrepancy.
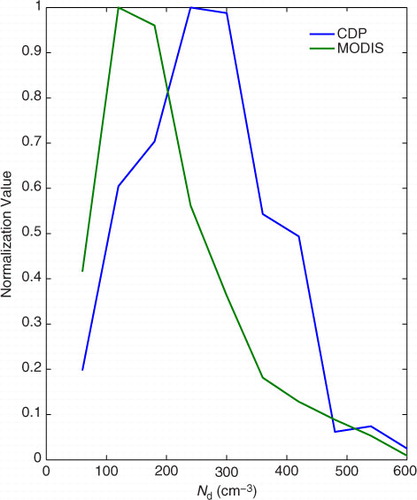
To further analyse the differences in cloud droplet number concentrations derived from different measurements the frequency distributions for N d are shown in . Here we use data from satellite and in situ measurements from the months when the CDP was operating. Thus the distributions presented include all the data from the previous figures, and also non-coincident data from the same time period (2006–2011). It can be seen that the MODIS-derived N d is peaked at smaller values with a median of 148 cm−3. The in situ measurement gives a slightly broader distribution of N d values with a median of 216 cm−3.
Fig. 4 Probability distributions of cloud droplet number concentrations from in situ Cloud Droplet Probe (CDP) measurements and from Moderate Resolution Imaging Spectroradiometer (MODIS) for the time 2006–2011. Both coincident and non-coincident CDP measurements and MODIS data are used here. Blue line denotes CDP and green line denotes MODIS.
Our in situ measurements of cloud droplet number concentration are in good agreement with several other measurements conducted in continental stratus clouds (e.g. Leaitch et al., Citation1992; Dong et al., Citation2005; Komppula et al., Citation2005). The mean MODIS-retrieved N d in this study is in reasonable agreement with direct measurements and most likely the N d retrieval method used in Janssen et al. (2011) gave too low values. However, as can be seen from eqs. (2) and (3), there are several assumptions that need to be made to calculate N d using MODIS-retrieved COT and R eff. The calculated N d is more sensitive to R eff than to COT and Painemal and Zuidema (Citation2011) concluded that the MODIS-retrieved R eff systematically exceeded the in situ measured value by 15–20%. As the power of R eff in eq. (2) is −2.5, the decrease of R eff by 15–20% (when taken alone) would increase retrieved N d by a factor of 1.5–1.75 and bring the median MODIS value from into good agreement with that from the in situ data. However, Painemal and Zuidema (Citation2011) also found that, for their assumptions of k=0.8 and of adiabatic clouds in the calculation of N d, the overestimate of R eff by MODIS was compensated by an underestimate of the k factor (the actual value observed was ~0.88) and the observation that the clouds were fairly sub-abiabatic. They found a measured effective C w of 0.7 times the adiabatic C w value. However, whether the parameters observed by Painemal and Zuidema (Citation2011) in the South-East Pacific are relevant to the Puijo region is an open question.
Thus, there are potentially large uncertainties in the estimate of N d, which may explain some of the differences between the in situ and MODIS N d seen here. However, it is likely that constant systematic biases in the parameters just mentioned would lead to a constant relative difference between the N d values. This suggests that non-systematic biases were occurring in either of these parameters, the MODIS measurements or the in situ CDP measurements (or a combination). Another possible reason for discrepancy is the assumption that N d is constant throughout the cloud, which is implicit in the N d calculation and is also necessary to make sure that the tower observed value is not different from that higher up in the cloud. Aircraft measurements have suggested that this is generally the case in clouds with bases above ground level (Martin et al., Citation1994; Miles et al., Citation2000; Wood, Citation2005), although this has not been well tested for clouds near the ground. An alternative explanation is that MODIS is more likely to sample higher clouds than the surface-based CDP and thus it is possible that N d at such elevated levels is lower than N d near the surface due to a lower aerosol concentration.
5. Conclusions
We have compared in situ measured cloud microphysical properties to those retrieved from the MODIS instruments onboard the Aqua and Terra satellites. We have used ground-based measurements from the Puijo measurement station to study the dependence of cloud droplet number concentration (N d) and cloud droplet effective radius (R eff) on the number concentration of aerosol particles in the accumulation mode (N acc). As far as we know, this is the first time that N d analysed from long-term ground-based in situ measurements have been compared to satellite observations. We have found that in situ measurements showed a clear correlation between N d and N acc for N acc concentrations less than 400 cm−3. A similar but weaker correlation was seen from the remote sensing data. The ACI value (0.16) from in situ measurements was almost similar the ACI value (0.14) calculated from the MODIS-retrieved N d. This is valid for N d values lower than 250 cm−3 and N acc<400 cm−3. Above this value N d increased only slightly (in situ measurements), or levelled off at around 215 cm−3 (MODIS). Mean (median) N d from in situ measurements was a factor of 1.2 (1.4) higher than the MODIS-derived value. However, due to several uncertainties in the method used to calculate N d it is difficult to say if this difference was caused by, for example, a systematic error in the retrieval of R eff.
As shown, our N d values are clearly higher than, for example, those measured in the study of Janssen et al. (2011), even though the study areas partly overlap. This suggests that the satellite-retrieved N d is strongly dependent on the retrieval method. This must be taken into account for example when MODIS-retrieved N d is used for model validation purposes.
The results presented above initially showed fairly poor agreement between the in situ CDP N d and that measured from satellite. However, when the data were filtered using ceilometer data to make sure that the clouds were within the boundary layer and that only a single layer of cloud existed, the agreement was much improved. Unfortunately, the amount of data for the direct comparison was very low, and so it is difficult to draw some conclusion. Good agreement was obtained when the satellite data was compared to an N d,p value calculated using the aerosol measurements, but again only if the data were first filtered using ceilometer measurements. This suggests that such height determination is very important when trying to match ground-based measurements to satellite measurements.
6. Acknowledgments
This work was supported by Maj and Tor Nessling Foundation, Academy of Finland (through the Centre of Excellence programme, project no 1118615), and by the strategic funding of the University of Eastern Finland. Analysis and visualisations used in this study were produced with MODIS level 2 and level 3 atmosphere data taken from LAADS WEB (Goddard Space Flight Centre) and Giovanni online data system, developed and maintained by the NASA GES DISC.
Related Research Data
References
- Albrecht B. A . Aerosols, cloud microphysics, and fractional cloudiness. Science. 1989; 245: 1227–1230.
- Bennartz R . Global assessment of marine boundary layer cloud droplet number concentration from satellite. J. Geophys. Res. 2007; 112: 02201.
- Boers R , Acarreta J. R , Gras J. L . Satellite monitoring of the first indirect aerosol effect: retrieval of the droplet concentration of water clouds. J. Geophys. Res. 2006; 111: 22208.
- Cairns B. C . Diurnal variations of cloud from ISCCP data. Atmos. Res. 1995; 37: 133–246.
- Dong X , Minnis P , Xi B . A climatology of midlatitude continental clouds from the ARM SGP Central Facility: part I: low-level cloud macrophysical, microphysical, and radiative properties. J. Clim. 2005; 18: 1391.
- Dong X , Minnis P , Xi B , Sun-Mack S , Chen Y . Comparison of CERESMODIS stratus cloud properties with ground-based measurements at the DOE ARM Southern Great Plains site. J. Geophys. Res. 2008; 113: 03204.
- Feingold G , Remer L. A , Ramaprasad J , Kaufman Y. J . Analysis of smoke impact on clouds in Brazilian biomass burning regions: an extension of Twomey's approach. J. Geophys. Res. 2001; 106: 22907.
- Garrett T. J , Zhao C , Dong X , Mace G. G , Hobbs P. V . Effects of varying aerosol regimes on low-level Arctic stratus. Geophys. Res. Lett. 2004; 31: 17105.
- International Panel on Climate Change (IPCC Report). Solomon S , Qin D , Manning M , Chen Z , Marquis M , co-authors . Climate change (2007), the physical science basis. Contribution of working Group I to the Fourth Assessment Report of the Intergovernmental Panel on Climate Change.
- King M. D, Tsay S, Platnick S. E, Wang M, Liou K. Cloud retrieval algorithms for MODIS: optical thickness, effective particle radius and thermodynamic phase, MODIS Algorithm Theoretical Basis Document (ATBD-MOD-05). 1997; NASA. Online at: http://modis-atmos.gsfc.nasa.gov/_docs/atbd_mod05.pdf (Accessed Aug 2012).
- Komppula M , Lihavainen H , Kerminen V.-M , Kulmala M , Viisanen Y . Measurements of cloud droplet activation of aerosol particles at a clean subarctic background site. J. Geophys. Res. 2005; 110: 06204.
- Leaitch W. R , Isaac G. A , Strapp J. W , Banic C. M , Wiebe H. A . The relationship between cloud droplet number concentrations and anthropogenic pollution: observations and climatic implications. J. Geophys. Res. 1992; 97: 2463–2474.
- Leskinen A , Portin H , Komppula M , Miettinen P , Arola A , co-authors . Overview of the research activities and results at the Puijo semi-urban measurement station. Boreal Environ. Res. 2009; 14: 576–590.
- Lihavainen H , Kerminen V.-M , Remer L. A . Aerosol–cloud interaction determined both in situ and satellite data over a northern high-latitude site. Atmos. Chem. Phys. 2010; 10: 10987–10995.
- Martin G. M , Johnson D. W , Spice A . The measurement and parameterization of effective radius of droplets in the warm stratocumulus clouds. J. Atmos. Sci. 1994; 51: 1823–1842.
- McComiskey A , Feingold G . The scale problem in quantifying aerosol indirect effects. Atmos. Chem. Phys. 2012; 12: 1031–1049.
- McComiskey A , Feingold G , Frisch A. S , Turner D. D , Miller M. A , co-authors . An assessment of aerosol–cloud interaction in marine stratus clouds based on surface remote sensing. J. Geophys. Res. 2009; 114: D09203.
- McFiggans G , Artaxo P , Baltensperger U , Coe H , Facchini M. C , co-authors . The effect of physical and chemical aerosol properties on warm cloud droplet activation. Atmos. Chem. Phys. 2006; 6: 2593–2649.
- Meskhidze N , Nenes A , Conant W. C , Seinfeld J. H . Evaluation of a new cloud droplet activation parameterization with in situ data from crystal-face and cstripe. J. Geophys. Res. 2005; 110: 16202.
- Miles N. L , Verlinde J , Clothiaux E. E . Cloud droplet size distributions in low-level stratiform clouds. J. Atmos. Sci. 2000; 57: 295–311.
- Nakajima T. Y , Higurashi A , Kawamoto K , Penner J. E . A possible correlation between satellite-derived cloud and aerosol microphysical parameters. Geophys. Res. Lett. 2001; 28(7): 1171–1174.
- Nakajima T. Y , King M. D . Determination of the optical thickness and effective particle radius of clouds from reflected solar radiation measurements, Part I: theory. J. Atmos. Sci. 1990; 47: 1878–1893.
- Painemal D , Zuidema P . Assessment of MODIS cloud effective radius and optical thickness retrievals over the Southeast Pacific with VOCALS-REx in situ measurements. J. Geophys. Res. 2011; 116: 24206.
- Platnick S , King M. D , Ackerman S. A , Menzel W. P , Baum B. A , co-authors . The MODIS cloud products: algorithms and examples from Terra. IEEE Trans. Geosci. Remote Sens. 2003; 41(2): 459.
- Portin J. H , Komppula M , Leskinen A. P , Romakkaniemi S , Laaksonen A , co-authors . Overview of the aerosol-cloud interaction at the Puijo semi-urban measurement station. Boreal Environ. Res. 2009; 14: 641–653.
- Reutter P , Su H , Trentmann J , Simmel M , Rose D , co-authors . Aerosol- and updraft-limited regimes of cloud droplet formation: influence of particle number, size and hygroscopicity on the activation of cloud condensation nuclei (CCN). Atmos. Chem. Phys. 2009; 9: 7067–7080.
- Romakkaniemi S , Arola A , Kokkola H , Birmili W , Tuch T. M , co-authors . Effect of aerosol size distribution changes on AOD, CCN and cloud droplet number concentration: case studies from Erfurt and Melpitz, Germany. J. Geophys. Res. 2012; 117: D07202.
- Romakkaniemi S , Kokkola H , Lehtinen K. E. J , Laaksonen A . The influence of nitric acid on the cloud processing of aerosol particles. Atmos. Chem. Phys. 2006; 6: 1627.
- Schüller L , Brenguier J. L , Pawlowska H . Retrieval of microphysical, geometrical, and radiative properties of marine stratocumulus from remote sensing. J. Geophys. Res. 2003; 108: 8631.
- Snider J. R , Guibert S , Brenguier J.-L , Putaud J.-P . Aerosol activation in marine stratocumulus clouds: 2. Köhler and parcel theory closure studies. J. Geophys. Res. 2003; 108: 15.
- Sporre M , Glantz P , Tunved P , Swietlicki E , Kulmala M , co-authors . A study of the indirect aerosol effect on subarctic marine liquid low-level clouds using MODIS cloud data and ground-based aerosol measurements. Atmos. Res. 2011; 116: 56–66.
- Stevens B , Feingold G . Untangling aerosol effects on clouds and precipitation in a buffered system. Nature. 2009; 461: 607–613.
- Twomey S . The influence of pollution on the shortwave albedo of clouds. J. Atmos. Sci. 1977; 34: 1149–1152.
- Wood R . Drizzle in stratiform boundary layer clouds. Part I: vertical and horizontal structure. J. Atmos. Sci. 2005; 62: 3011–3033.
- Wood R , Hartmann D. L . Spatial variability of liquid water path in marine low cloud: the importance of mesoscale cellular convection. J. Clim. 2006; 19: 1748–1764.
- Wood R , Mechoso C. R , Bretherton C. S , Weller R. A , Huebert B , co-authors . The VAMOS Ocean-Cloud Atmosphere-Land Study Regional Experiment (VOCALS-REx): goals, platforms, and field operations. Atmos. Chem. Phys. 2011; 11: 627.