Abstract
Due to its significant ecological and climate consequences, atmospheric nitrogen (N) deposition is a growing global concern, especially in the severely N-polluted regions such as the Pearl River Delta (PRD) region of southern China. One-year measurements of reactive N species, including ammonium nitrogen (-N), nitrate nitrogen (
-N) and total organic nitrogen (ON) in dry and wet deposition, were conducted using an automated wet–dry sampler incorporated with a DDAS (dry deposition on aqueous surface) sampling device at Dinghushan (DHS), a natural forest site in the northwest of PRD and at Hengmen (HM), an estuary site in the south of PRD during 2006–2007. Total deposition fluxes of N at DHS and HM were up to 48.2 and 37.8 kg ha−1 yr−1, respectively, with most of the deposition occurring in the rainy season. Wet deposition was the dominant form, contributing 65–70% to the total deposition.
-N was the largest contributor to the total N deposition at DHS (47%) due to significant influence of agriculture emissions. ON was the most important N component at HM (41%), which is probably attributed to the marine sources. However,
-N deposition is increasing rapidly recently and is expected to be more important in the near future. The current N deposition level in PRD is much higher than those in Europe and North America. Great challenges exist in reducing reactive N emission in this region. Thus, a scenario of rising N deposition in PRD in the near future cannot be ruled out. The environmental consequences due to elevated N deposition should therefore be paid more attention in the future.
1. Introduction
Global emission of reactive nitrogen (N) has been substantially accelerated by growing application of N fertilizers in agriculture, increasing combustion of fossil fuels in industry and transportation and other human activities (Galloway et al., Citation2008). The global reactive N creation rate was estimated to be 187 Tg N yr−1 in 2005, approximately 11-fold increase above pre-industrial levels, and is expected to reach as high as to 270 Tg N yr−1 in 2050 (Galloway et al., Citation2004). The emitted reactive N was ultimately removed from the atmosphere via dry or wet deposition, providing significant N inputs to terrestrial and aquatic ecosystems. Wet deposition is usually efficient, but dry deposition can also be significant since the process occurs all the time. For example, earlier studies suggested that N dry deposition contributed 16–79% to the total wet+dry deposition at various locations in China (Fan et al., Citation2009; Chen et al., Citation2011; Pan et al., Citation2012; Shen et al., Citation2013), 25–58% in the United States (Munger et al., Citation1998; Sparks et al., Citation2008; Beem et al., Citation2010) and 10–50% in Canada (Zhang et al., Citation2009).
As a key limiting nutrient, reactive N provided by the atmospheric deposition can be assimilated by plants in both terrestrial and aquatic ecosystems that may stimulate primary production in the biosphere if the load is not too high (Horii et al., Citation2005; Galloway et al., Citation2008). However, when the N input exceeds critical loads, many unwanted consequences may happen, such as eutrophication and N saturation, soil acidification, loss of biodiversity and damage to forests (Horii et al., Citation2005; Guo et al., Citation2010; Liu et al., Citation2011; Greaver et al., Citation2012). The impact of N deposition on the composition and function of terrestrial and aquatic ecosystems is closely connected with other biogeochemical element cycles (e.g., carbon, water) that can affect global climate change (Gruber and Galloway, Citation2008).
During the past two decades, reactive N emission has increased dramatically in densely populated areas of tropical and subtropical Asia due to expansion in industry, transportation, agriculture and animal husbandry (Liu et al., Citation2013). One area of particular concern is the Pearl River Delta (PRD) region of southern China due to its soaring emission of air pollutants accompanied with the deterioration of atmospheric environment (Wang et al., Citation2005; Chan and Yao, Citation2008).
This paper presents measurements on atmospheric dry and wet deposition of reactive N at two N-sensitive ecosystems in the PRD region. The objectives of this study were: (1) to examine the deposition of ,
and ON at one rural forest site and one suburban estuary site in PRD in the context of its amount, seasonal distribution and total deposition budget; (2) to compare the observations with published data for PRD, other Chinese rapid-urbanised regions and areas in other countries; and (3) to discuss the future trend of N deposition in PRD.
2. Methodology
2.1. Description of the study region and sampling sites
The PRD region is adjacent to the South China Sea with 11 major cities (i.e., Guangzhou, Foshan, Dongguan, Shenzhen, Zhongshan, Zhuhai, Jiangmen, Huizhou, Zhaoqing, Hong Kong and Macau, see in ) lying at both sides of the Pearl River Estuary. It has experienced remarkable economic development and urbanisation during the past two decades and has become one of China's main industrial centres as well as a megacity cluster. This region covers 4.17×10⁴ km2, or 0.43% of the country, but hosted more than 4.8% of the population and contributed ~14.8% of the gross domestic product (GDP) in 2010 (China Statistical Yearbook, Citation2011; Guangdong Statistical Yearbook, Citation1991–2011). It is subject to a typical East Asian monsoon climate. In hot and humid summer, southwesterly wind from the sea prevails and brings abundant precipitation, while in relatively cool and dry winter, northeasterly wind from the mainland dominates and brings little precipitation. The mean annual temperature from 1981 to 2010 recorded at Wushan meteorological station in Guangzhou city was 22.4°C, and the mean annual relative humidity was 75%. The annual precipitation varied significantly year after year, ranging from 1240 to 2679 mm with a mean value of 1801 mm.
Fig. 1 Locations of the sampling sites (triangle symbols). The circle symbols indicate the locations of large point sources of NOx emission (>1000 ton yr−1).
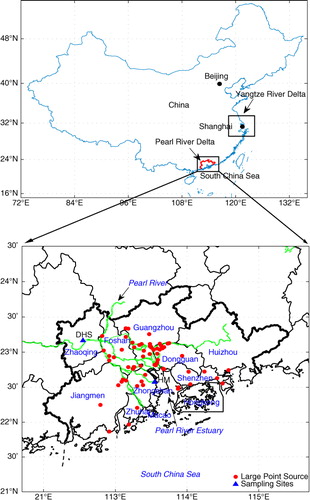
Dinghushan (DHS) site (112°32′57″ E, 23°09′59″ N) is located at Dinghushan biosphere reserve in the northwest of PRD. Sampling was carried out on the roof of a building (~10 m above ground) belonging to Dinghushan Forest Ecosystem Research Station at the foothill of the reserve. This site is 15 km northeast of a relatively small size city, Zhaoqing (330 thousand inhabitants), about 80 km west of the metropolitan Guangzhou (10 million inhabitants), and 180 km northwest of Hong Kong (7 million inhabitants). Within 50 km of the DHS site, regional average NH3 and NOx emission fluxes were about 5 and 12 ton km−2 yr−1, respectively (Zheng et al., Citation2009; Zheng et al., Citation2012). Locations of large point sources for NOx in PRD (NOx emission>1000 ton yr−1) are shown in and the nearest large point source to DHS was ~30 km away. A state highway (G321) passes ~2 km to the southeast and lots of irrigated paddy fields are distributed ~3 km away to the east. The reserve occupies an area of 11.3 km2 with three dominant vegetation types: the 400-year-old monsoon evergreen broadleaf forest located in the well-protected core areas, the young pine forest originating from the 1930s clear-cut and subsequent pine plantation, and the pine–broadleaf mixed forest originating from pine forest and created by natural successional processes (Zhou et al., Citation2007). Annual mean temperature and accumulated precipitation at DHS during the study period were 22.8°C and 1373 mm, respectively.
Hengmen (HM) site (113°32′53″ E, 22°34′29″ N) is located by the Pearl River Estuary in the south of PRD. Sampling was carried out at the meteorological observation plot near the Pearl River in Hengmen hydrometric station operated by Hydrological Bureau of Guangdong Province. This site is 17 km east of a medium size city, Zhongshan (3 million inhabitants), about 70 km south of the metropolitan Guangzhou, and 60 km west of Hong Kong. Within 50 km of the HM site, regional average NH3 and NOx emission fluxes were about 3 and 37 ton km−2 yr−1, respectively (Zheng et al., Citation2009; Zheng et al., Citation2012). The nearest large point source of NOx emission to HM was ~20 km away. Occasionally cargo vessels passed through the river as a cargo port (Zhongshan Port) lies 7 km to the west. The Pearl River Estuary covers a water area of about 1180 km2 and is the second largest estuary in China. Over recent years, harmful algal blooms occurred frequently in the Pearl River Estuary due to accelerated nutrient inputs from various sources (Hu and Li, Citation2009). Annual mean temperature and accumulated precipitation at HM during the study period were 23.0°C and 1429 mm, respectively.
2.2. Sampling and analytical method
Wet and dry atmospheric depositions were collected by an automated wet–dry sampler incorporated with a DDAS (dry deposition on aqueous surface) sampling device (Fan et al., Citation2010). The sampler consisted of two petri dishes (22 cm inner diameter, 11.5 cm height), equipped with a movable polyethylene cover that alternately covers the dry or wet sampler port as regulated by a rain sensor. The rain sensor was examined regularly for the capability of triggering the cover. The dish for dry deposition was filled with ultrapure water and examined if refill was needed on a daily basis to keep the water depth at a level of about 2.5 cm. The same type of sampler is also often used by other researchers (e.g., Zobrist et al., Citation1993; Balestrini et al., Citation2000; Morselli et al., Citation2008).
Sampling of atmospheric wet and dry deposition was operated from Jan 2007 to Dec 2007 at DHS and from Nov 2006 to Oct 2007 at HM. Wet samples were collected on a daily basis and dry samples were recovered biweekly or monthly. In total, 56 wet samples and 19 dry samples were collected at DHS, and 36 wet samples and 15 dry samples were collected at HM during the study period. The prolonged drought occurred at DHS in Nov 2007 and at HM in Jan 2007, with the result that no viable rain samples were collected for analysis due to the very tiny rain volumes obtained.
On the day after collection, water samples were placed in 50 ml plastic bottles that were soaked in 25% hydrochloric acid solution all night and washed with deionised water repeatedly until no N species was detected in the rinse water and were then stored in a refrigerator (under 4°C) immediately for later analysis in Guangdong Provincial Key Laboratory of Environmental Pollution Control and Remediation Technology at Sun Yat-sen University. The sampling dishes were washed with soap and water and rinsed with deionised water after each water sample collection. At the beginning of each month, the dishes were also cleaned by soaking them in 25% hydrochloric acid solution, similar to the method used for cleaning the sample bottles.
The concentrations of ammonium (), nitrate (
) and total nitrogen (TN) were measured in the water samples.
was detected by Nessler's reagent spectrophotometry using an ultraviolet–visible spectrophotometer (752N, Shanghai Instrument Co., China).
was measured using an ion chromatography system (Model 882, Metrohm, Switzerland) equipped with a Metrosep A Supp5 4.0 mm analytical column. The three eluents were deionised water, 0.0032 M Na2CO3 mixed with 0.0010 M NaHCO3 and 0.0500 M H2SO4. TN was determined using alkaline persulfate oxidation to
followed by UV spectrophotometric determination (752N, Shanghai Instrument Co., China). Total organic nitrogen (ON) was then calculated as the difference between TN and the sum of inorganic nitrogen (i.e.,
and
). It should be noted that while samples collected were checked carefully for any visible particulate matter and a few samples (mainly dry samples) were discarded because of visible evidence of contamination (e.g., by leaf and bird waste), samples were not routinely filtrated prior to analysis. Thus, our ON measurements may include some insoluble N compounds and should be slightly higher than dissolved organic nitrogen (DON) based on filtered samples. Minimum detection levels (MDLs) are 0.02 mg l−1 for
concentrations, 0.01 mg l−1 for
concentrations and 0.05 mg l−1 for TN concentrations. Field blank samples were collected by soaking the sampling dishes in deionised water (Millipore, USA) followed by collecting the rinse water in the same way as for normal sampling. The N species were undetectable in the field blanks.
3. Results and discussion
3.1. Dry and wet deposition fluxes
During the study period, DHS received 33.6 kg ha−1 yr−1 wet deposition flux of TN, with an additional contribution of 14.6 kg ha−1 yr−1 from dry deposition (). This N input is much higher than the calculated critical load of nutrient N for the broadleaf and coniferous forests of PRD (25.8 kg ha−1 yr−1) over which the ecosystems are at risk of eutrophication (Zhang and Xie, Citation2010). HM had a smaller TN input from wet deposition (24.4 kg ha−1 yr−1)and dry deposition (13.4 kg ha−1 yr−1) than DHS.
Table 1 Deposition fluxes of reactive nitrogen at DHS during Jan 2007–Dec 2007 and at HM during Nov 2006–Oct 2007a
On an annual basis, wet deposition was the dominant form of TN deposition with a contribution of 70% at DHS and 65% at HM, respectively (). Larssen et al. (Citation2011) measured inorganic N deposition in precipitation and throughfall at a natural forest site in Guangzhou, which indicated that wet deposition accounted for about three quarters of the inorganic N deposition flux in throughfall. However, the throughfall technique is suggested to underestimate the total atmospheric deposition of N in forests due to N uptake in the canopy surface (Larssen et al., Citation2011). Theoretically, DDAS might overestimate dry deposition for very soluble gaseous species (e.g., NH3), but likely underestimate not-so-soluble but reactive gaseous species (e.g., NO2) and particulate matters due to the much smaller surface area of DDAS compared to the original forest leaves (i.e., leaf area index is usually >1). Besides, DDAS excludes any dry deposition amount that happened during wet periods, thus further underestimating the dry deposition amount. Dry deposition to a forest in PRD estimated by different techniques such as a DDAS method, a throughfall technique and an inferential method need to be compared in any future work.
Monthly wet deposition fluxes of TN ranged from 0.92 to 5.8 kg ha−1 month−1 at DHS and 0.34–6.8 kg ha−1 month−1 at HM, respectively (). The seasonal variation of wet deposition fluxes mainly mirrored the seasonal patterns of rainfall amount, suggesting the importance of precipitation variation in regulating the seasonal patterns of wet deposition. During the study period, 84–92% of the precipitation fell in the rainy season (April–September) with 65–88% of the TN wet deposition ().
Fig. 2 Monthly deposition fluxes of ammonium nitrogen (-N), nitrate nitrogen (
-N) and organic nitrogen (ON): (a) rainfall and wet deposition at DHS; (b) rainfall and wet deposition at HM; (c) dry deposition at DHS; (d) dry deposition at HM.
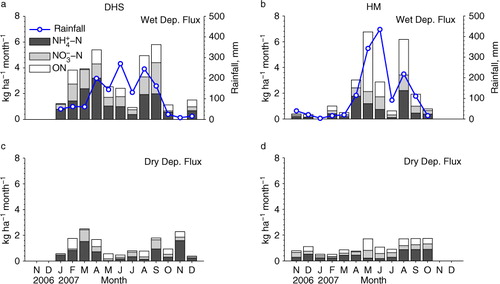
Monthly dry deposition fluxes of TN ranged from 0.39 to 2.5 kg ha−1 month−1 at DHS and 0.50–1.7 kg ha−1 month−1 at HM, respectively (). Dry deposition fluxes in the rainy season were also generally higher than those in the dry season (with the exception of -N at DHS) (), which is probably because the stronger wind and turbulence in the rainy season result in a larger dry deposition velocity to the DDAS sampler (Shahin et al., Citation1999). As DHS is surrounded by the irrigated paddy fields several kilometres away, the intensive fertilizer used in spring could be a large source of NH3 emission, thus contributing to the higher dry deposition of
-N in the dry season.
The contribution of each N species to total dry+wet deposition followed the order: -N (47%)>
-N (29%)>ON (24%) at DHS, and ON (41%)>
-N (35%)>
-N (24%) at HM, respectively. Both sites had higher reduced inorganic N (
-N) than oxidised inorganic N (
-N), typically by a factor of 1.5, and the deposition fluxes of inorganic N at DHS were much larger than those at HM (). However, ON flux at HM was considerably higher than that at DHS and accounted for a larger fraction of TN. Zhang et al. (Citation2008) measured DON in precipitation at 15 sites across China and also found that both the concentration and fraction of DON were relatively high in the coastal area, which is probably attributed to the marine sources.
In the PRD region which is characterised by high densities of population and industry, -N in precipitation is expected mainly from NH3 volatising from excrements of human/animals and N fertilizer applied in agriculture (Zheng et al., Citation2012) and the main source of
-N in precipitation is generally considered to be NOx emitted from transportation, power plant and industry (Zheng et al., Citation2009). The sources of atmospheric ON in PRD are still not very clear (Fang et al., Citation2008; Li et al., Citation2012). A recent survey at 32 Chinese sites (but no sites in PRD) on ON wet deposition suggested atmospheric ON compounds have substantial anthropogenic sources from agriculture and industry through the correlation analysis (Zhang et al., Citation2012), while reviews of worldwide data (Neff et al., Citation2002; Cape et al., Citation2011; Cornell, Citation2011) suggest atmospheric ON has diverse sources including both anthropogenic and natural origins. Based on the daily wet deposition data, significant correlations were found between ON and
-N (r=0.49, p<0.01, n=56) and between ON and
-N (r=0.41, p<0.01, n=56) at DHS. In contrast, ON was not significantly correlated with either
-N (r=0.13, p=0.45, n=36) or
-N (r=0.22, p=0.19, n=36) at HM. These indicate that atmospheric ON may have common sources with
-N and
-N at DHS, but very different sources at HM. HM had a relatively high deposition of ON in the rainy season. The ratio of ON wet (or dry) deposition between the rainy season and the dry season is 10.9 (or 1.8), higher than the value of 5–6 (or 1.1–1.6) for
-N and
-N (). Measurements by Huang et al. (Citation2004) showed that the abundance of phytoplankton in rainy season was about 4.5 times that in dry season in the Pearl River Estuary. The monthly dry and wet deposition flux of ON at HM both reached the highest level in May 2007 when a severe algal bloom occurred in the south area of Pearl River Estuary (Wei et al., Citation2012). As marine biological activities (e.g., algal blooms, bacteria and protein degradation) could be significant sources of ON compounds such as amines and amino acids (Neff et al., Citation2002; Cape et al., Citation2011), the enhanced ON deposition in the rainy season at HM may be attributed to the abundant marine sources. Based on these results, we speculate that reduced ON compounds from intensive agricultural/animal husbandry activities and oxidised ON from atmospheric reactions of hydrocarbons with NOx may be important contributors to ON deposition around the inland area of PRD like DHS, while some natural processes (e.g., marine biological activities) may dominantly contribute to ON deposition around the estuary and adjacent coastal area of PRD like HM.
3.2. Comparison with published data in PRD, other Chinese rapid-urbanised regions and areas in other countries
Wet depositions of reactive N in this study were first compared with other studies in PRD as listed in . Deposition fluxes of inorganic N (-N and
-N) at DHS in this study are within the ranges of previous reports for 2004–2006 at the same sampling site (Fang et al., Citation2008, Citation2009a
Citation2009b) while ON deposition flux in this study were much lower than the previous report for 2005 (Fang et al., Citation2008), which may be due to the large year-to-year variation as can be seen at other sites (e.g., Zhang et al., Citation2008, Citation2012). Deposition flux of inorganic N at HM in this study were closely comparable with reports for sites in Shenzhen and Zhuhai (Huang X. F. et al., Citation2010; Huang et al., Citation2012; Network Center for EANET, Citation2001–2011) which are located near the estuary as well, but much lower than those for some urban sites in Guangzhou (Cao et al., Citation2009; Huang D. Y. et al., Citation2010; Li et al., Citation2012). Much fewer measurements of ON in precipitation are available in PRD. Fang et al. (Citation2008) reported the highest ON deposition flux (17.8 kg ha−1 yr−1) at DHS in 2005, followed by the result at HM in this study (11.4 kg ha−1 yr−1). Li et al. (Citation2012) measured ON in precipitation in urban Guangzhou and found the deposition flux were 8.1–8.4 kg ha−1 yr−1, very close to our results at DHS in 2007 (8.0 kg ha−1 yr−1).
Table 2 Wet deposition fluxes of reactive nitrogen among cities in the Pearl River Delta region, Southern China
Using the data listed in , we derived the maps of wet deposition of reactive N for PRD to gain a better insight of its regional variation (). There were significant spatial variations of N wet deposition for PRD. Depositions of -N and
-N were relatively high in the north inland of PRD, generally with deposition flux of >10 kg ha−1 yr−1. The south part of PRD close to the estuary had comparatively low depositions of
-N and
-N, with deposition flux of 4–10 kg ha−1 yr−1, which could be explained by the larger portion of clean air mass from the sea received by that region.
Fig. 3 Spatial distribution of wet deposition flux of (a) ammonium nitrogen (-N), (b) nitrate nitrogen (
-N), (c) organic nitrogen (ON) and (d) total nitrogen (TN) in the Pearl River Delta region (kg ha−1 yr−1). References for data sources are listed in . The arithmetic mean flux is displayed if data of multiple years are available for the same site.
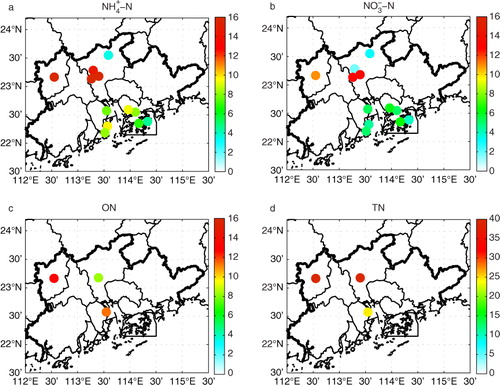
-N in precipitation was generally greater than
-N throughout PRD (), indicating that NH3 from agriculture and excrement from human/animals is still more important than NOx from transportation and industry to inorganic N in precipitation at the regional scale. It is also worth noting that a rapid decrease of the
-N/
-N ratio was observed in PRD. Xu et al. (Citation2001) reported the
-N/
-N ratio of 8.9 at Longdong of Guangzhou in 1998, then it decreased to 1.2 around 2005 (Huang D. Y. et al., Citation2010), and even reached below 1.0 in 2008 (Li et al., Citation2012). Huang et al. (Citation2012) also found an increasing trend for
-N in precipitation while finding a decreasing trend for
-N at an urban site of Shenzhen during 1986–2006. The rapid decrease of the
-N/
-N ratio was also observed in the other urbanised regions of China (Zhao et al., Citation2009; Liu et al., Citation2013). These results suggest that NOx has been increasingly important in wet deposition of inorganic N in PRD and may become a dominant portion in the near future, especially for urban areas.
The ON measurements (Fang et al., Citation2008; Li et al., Citation2012; this study) indicate previously ignored significant wet deposition of ON in PRD, consistent with the findings in a nationwide survey on ON in precipitation by Zhang et al. (Citation2012). The contribution of ON to TN varies largely throughout PRD and according to the land-use type, a decreasing order was found as estuary (47%)>forest (24–36%)>urban (17–21%).
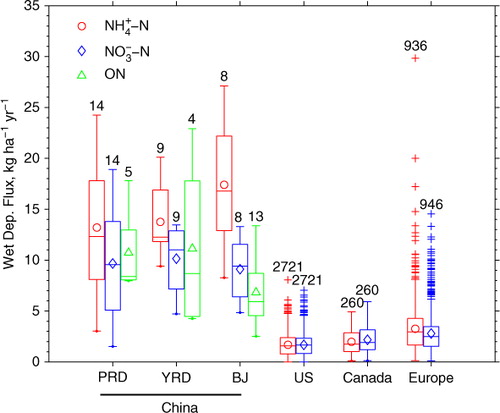
Besides PRD, Yangtze River Delta (YRD) and Beijing (BJ) are the other two rapid-urbanised regions in China, which are all characterised by rapidly increasing economy accompanied with deteriorating air quality (Chan and Yao, Citation2008). The data of reactive N in precipitation for PRD was then compared with the data for YRD and BJ, as shown in . The median wet deposition flux of -N in PRD during 2000–2010 was close to that in YRD (12.3 kg ha−1 yr−1) while lower than that in BJ (16.8 kg ha−1 yr−1). YRD had slightly higher
-N wet deposition (11.0 kg ha−1 yr−1) than PRD (9.6 kg ha−1 yr−1) and BJ (9.4 kg ha−1 yr−1). The ON deposition level in PRD (8.4 kg ha−1 yr−1) was closely comparable with YRD (8.7 kg ha−1 yr−1) and higher than that in BJ (5.9 kg ha−1 yr−1).
-N is the dominant form of reactive N in wet deposition in BJ while
-N and ON are very comparable with
-N in PRD and YRD.
Monitoring results from some major international networks () show that wet deposition fluxes of -N and
-N in the United States, Canada and Europe during 2000–2010 were relatively low, with median values ranging from 1.6 to 3.0 kg ha−1 yr−1. The wet deposition fluxes of inorganic N from PRD, YRD and BJ of China were 4–8 times those in US, Canada and Europe. ON in precipitation was not measured at the above international networks. Zhang et al. (Citation2012) compared the data of ON deposition from 32 sites in China with those for other sites around the world and found the ON wet deposition in China were about four times of those observed elsewhere. These results indicate that China has become a high spot for N deposition globally.
Fig. 4 Comparison of wet deposition fluxes of ammonium nitrogen (-N), nitrate nitrogen (
-N) and organic nitrogen (ON) during 2000–2010 from the Pearl River Delta (PRD) sites with observations in Yangtze River Delta (YRD) of China, Beijing (BJ) of China, United States (US), Canada and Europe. In each box, the central mark is the median, the edges of the box are the 25th (q1) and 75th (q3) percentiles, the whiskers extend to the most extreme data points not considered outliers and points are drawn as outliers (symbol ‘+’) if they are larger than q3+1.5 (q3–q1) or smaller than q1–1.5 (q3–q1). The open cycles, diamond and triangle inside the boxes are the mean values. The number above each box-whisker is the number of samples. lists the data for PRD; data for YRD were from Zhang et al. (Citation2007), Huang et al. (Citation2008), Zhao et al. (Citation2009), Xu et al. (Citation2011), Yang et al. (Citation2010), Zhang et al. (Citation2008), Zhang et al. (Citation2012) and Wang et al. (Citation2004); data for BJ were from Tang et al. (Citation2005), Yang et al. (Citation2012), Xu and Han (Citation2009), Zhang et al. (Citation2008) and Zhang et al. (Citation2012); US data are from NADP network available on the web at http://nadp.isws.illinois.edu/nadpdata/multsite.asp?state=ALL; Canada data are from CAPMoN network available on the web at http://www.on.ec.gc.ca/capmon/login/login.aspx; Europe data are from EMEP network available on the web at http://www.nilu.no/projects/ccc/emepdata.html.
Dry deposition is difficult to estimate and measurements are scarce in PRD. Wai et al. (Citation2010) reported dry deposition of -N and
-N measured at two Hong Kong Environmental Protection Department (EPD) sites (Central Western and Kwun Tong). The weekly dry deposition samples were collected by an automated wet–dry sampler using a solid polyethylene as the surrogate surface. The dry deposition fluxes of
-N and
-N were 0.5 and 1.9 kg ha−1 yr−1 in Hong Kong during 1999–2000, much smaller than the DDAS measurements in this study (4.6–7.3 kg ha−1 yr−1 for
-N and 3.4–3.6 kg ha−1 yr−1 for
-N, as seen in ). This large difference was mainly attributed to the properties of the surrogate surface. Wai et al. (Citation2010) also compared the daily dry deposition measurements using a solid polystyrene surface and a water surface at an urban site in Hong Kong for about six months and found that the dry deposition fluxes of
-N and
-N collected by water surface were about 14 and seven times those collected by the solid polystyrene surface, respectively. If applying these ratios to the Hong Kong EPD measurements (Wai et al., Citation2010), we find that Hong Kong had a closely comparable dry deposition flux of
-N, but a much higher dry deposition flux of
-N than DHS and HM in this study.
presents the comparison of the annual dry deposition fluxes of reactive N in this study with the other sites in China and the other countries. As the sampling method plays an important role in determining the dry deposition fluxes, we selected the results also using the DDAS sampling device from the literature. Chen et al. (Citation2006) measured dry depositions at 10 sites in the southeast China coastal area and found the fluxes of -N,
-N, with ON ranging from 0.9 to 3.0, 0.8–1.8 and 1.0–3.5 kg ha−1 yr−1, respectively, much lower than our results. The dry deposition of N in Europe reported by Zobrist et al. (Citation1993), Morselli et al. (Citation2008) and Balestrini et al. (Citation2000) were 2.5–4.9 kg ha−1 yr−1 for
-N and 1.3–3.6 kg ha−1 yr−1 for
-N, respectively, generally lower than the results in this study, especially for
-N.
Table 3 Annual dry deposition fluxes of reactive nitrogen (kg ha−1 yr−1) collected by the DDAS (dry deposition on aqueous surface) sampling device for different sites
3.3. Discussion on the projection of future N deposition in PRD
Pollutants exhausted from sources will undergo chemical transformation and long-range transport before they deposit onto the surface, leading to potential non-linearity in emission-deposition relationship. Fowler et al. (Citation2007) examined the long-term trends in reactive N emission and deposition in Europe. In that study, Europe was separated into the source region where emission exceeded deposition and the receptor region where deposition exceeded emission. They found that the changes of emission and deposition in the source region were close to linear while non-linearity was larger for the receptor region as in that region local emissions were often limited and the deposition was very sensitive to changes in emissions upwind. As the PRD region is among the areas with the highest emission density in China (Streets et al., Citation2003; Zheng et al., Citation2009), we speculated that deposition–emission relationship in PRD would behave more likely a source region in which the deposition is dominantly influenced by the local emission, rather than the long-range transport from outside. Therefore, the deposition trend could be predicted from that of the emissions with a satisfied confidence.
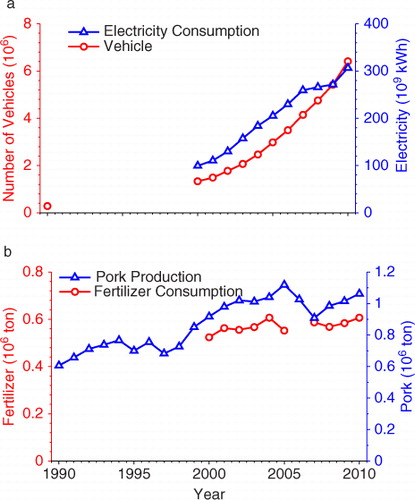
In the past two decades, the anthropogenic N emissions have increased steadily in PRD, which can be inferred by the trends of anthropogenic activities as shown in . The number of civil vehicles and electricity consumption, which are most important sources of NOx emission, increased much faster than pork production and consumption of chemical fertilizers, which mainly results in NH3 volatilisation.
Fig. 5 Number of civil vehicles, electricity consumption, chemical fertilizers consumption in effective weight and pork production in PRD excluding Hong Kong and Macao from 1990 to 2010 (Guangdong Statistical Yearbook, 1991–2011).
Large uncertainties exist when projecting the N emissions into the future. A recent study by Xing et al. (Citation2011) revealed that under a business-as-usual scenario, the NOx and NH3 emission in PRD in 2020 will increase 62 and 26%, respectively, compared with those in 2005, which is equivalent to an increase rate of 3.27 and 1.55% per year. The future policy, including the energy strategy and emission control strategy, will influence the emissions greatly. To reduce NOx emissions and consequent impacts on human health and natural ecosystems, the Chinese government has planned to cut the NOx emissions for some designated ‘Focus Areas’ of China which include PRD in its 12th Five-Year Plan (2011–2015) by 13%, relative to the 2010 level. Low-NOx combustion technologies or flue gas de-NOx technologies are required for the coal-fired power plants and cement plants to achieve a removal efficiency of 60% at least. Application of Euro-v to vehicles during the 12th Five-Year Plan period is also put on the agenda. However, challenges must be expected if the proper control measures are not fully implemented or the measures are not sufficient to compensate for the rapid increase of activities in transportation or industry. Based on the report of Ministry of Environmental Protection of China (MEP), the national NOx emissions in 2011 increased by 5.73% against the 2010 level (MEP, 2012), failing to achieve the reduction goal. NH3 is not a regulated pollutant under the National Ambient Air Quality Standards of China and its emission control has so far received little attention in China (Xing et al., Citation2011). NH3 emission is mainly controlled by the development of agriculture and animal husbandry. In PRD, urbanisation and industrialisation have already occurred dramatically and the trend likely continues, resulting in a significant conversion of cultivated lands to factory buildings or urban areas (Wang et al., Citation2009a, Citation2009b). Some highly industrialised cities such as Guangzhou, Shenzhen, Foshan and Dongguan have showed a decreasing trend both in the conversion of cultivated land and the consumption of chemical fertilizers (figure not shown). Animal husbandry expanded at some degree in some cities of PRD due to increasing life standard and demand for meat, while in some other cities such as Dongguan and Shenzhen, animal farms have been shut down in order to reduce the pollutants discharged into the surface water. A decline in wet deposition of has been observed at some sites in PRD (e.g., Huang et al., Citation2012). It can be expected that the NH3 emission from agriculture and animal husbandry will moderately stabilise in PRD or even with certain decreases in some industrialised cities (e.g., Guangzhou, Shenzhen, Foshan, Dongguan) in the near future.
Thus, a large threat due to reactive N emissions is posed to N deposition in the PRD region. And the cumulative effects of long-term enhanced N deposition should be paid much attention, especially for the terrestrial and aquatic ecosystems in the future.
4. Conclusions and summaries
This study presents that the total dry+wet depositions of reactive N at DHS and HM were up to 48.2 and 37.8 kg ha−1 yr−1, respectively, with most loading received during the rainy season when most growing of aquatic and terrestrial ecosystems occurred. Wet deposition was the main form of the total deposition (65–70%). There is a prominent difference between DHS (a forest site) and HM (an estuary site) regarding the chemical composition of N deposition. -N was the largest contributor to the total N deposition at DHS (47%) due to significant influence of agriculture emissions, while ON was the most important N component at HM, making up 41% of the total deposited N. The importance of
-N deposition is expected to increase due to the rapid rising of NOx emission in the PRD region. ON deposition was critical in assessing N dynamics in PRD and it may come from various sources. It seems that the atmospheric ON at DHS was mainly produced through the anthropogenic processes, such as agricultural/animal husbandry and photochemical reactions, while the atmospheric ON at HM possibly came from marine sources in a large part. Measurement of ON speciation is needed to better understand their sources in PRD.
N deposition in this study is within the range of previous reports in PRD. Data from previous reports and this study shows that the north inland region of PRD generally had much higher N wet deposition than the south part which is close to the estuary. Furthermore, literature review presents that PRD, YRD and BJ, the three largest mega cities or city clusters in China, currently all encountered very high levels of atmospheric N wet deposition, which were 4–8 times of those in North America and Europe. N dry deposition in this study is also relatively high, compared with the previous reports at other sites in China and Europe.
Considerable uncertainty remains regarding the projections of the future emission and deposition as the estimates are necessarily based on many uncertain assumptions, such as the economic development, energy strategy and emission control policy in the future. Despite the uncertainties in the estimates, it is clear that PRD will continue receiving very high loading of reactive N from the atmosphere, which has probably far exceeded the critical load for the ecosystems. Region-wide assessment of the accumulated effects of elevated N deposition on ecosystems and identification of vulnerable regions are urgently needed in PRD and other Chinese urbanised regions.
Acknowledgements
We thank Dr. Fuqing Zhang for helpful comments on the manuscript. This work was jointly supported by the following grants: the Natural Science Foundation of China (Grant Nos. 41275018, U0833001, 41275100), National Key Technologies R&D Program in the 12th Five year Plan of China (2012BAH32B03), the National Program on Key Basic Research Project of China (973) (Grant No. 2010CB428504) and the Fundamental Research Funds for the Central Universities.
Related Research Data
References
- Aas W , Shao M , Jin L , Larssen T , Zhao D , co-authors . Air concentrations and wet deposition of major inorganic ions at five non-urban sites in China, 2001–2003. Atmos. Environ. 2007; 41: 1706–1716.
- Ayers G. P , Yeung K. K . Acid deposition in Hong Kong. Atmos. Environ. 1996; 30: 1581–1587.
- Balestrini R , Galli L , Tartari G . Wet and dry atmospheric deposition at prealpine and alpine sites in northern Italy. Atmos. Environ. 2000; 34: 1455–1470.
- Beem K. B , Raja S , Schwandner F. M , Taylor C , Lee T , co-authors . Deposition of reactive nitrogen during the rocky mountain airborne nitrogen and sulfur (RoMANS) study. Environ. Pollut. 2010; 158: 862–872.
- Cao Y , Wang S , Zhang G , Luo J , Lu S . Chemical characteristics of wet precipitation at an urban site of Guangzhou, South China. Atmos. Res. 2009; 94: 462–469.
- Cape J. N , Cornell S. E , Jickells T. D , Nemitz E . Organic nitrogen in the atmosphere – where does it come from? A review of sources and methods. Atmos. Res. 2011; 102: 30–48.
- Chan C. K , Yao X. H . Air pollution in mega cities in China. Atmos. Environ. 2008; 42: 1–42.
- Chen N. W , Hong H. S , Huang Q. J , Wu J. Z . Atmospheric nitrogen deposition and its long-term dynamics in a southeast China coastal area. J. Environ. Manage. 2011; 92: 1663–1667.
- Chen N.-W , Hong H.-S , Xiao J , Zhang L.-P , Wang J.-P . Dry deposition of atmospheric nitrogen to Jiulong River watershed in southeast China. Acta Ecologica Sinica. 2006; 26(8): 2602–2607. (in Chinese with English abstract).
- China Statistical Yearbook. National Bureau of Statistics of China. 2011; Beijing: China Statistics Press.
- Cornell S. E . Atmospheric nitrogen deposition: revisiting the question of the importance of the organic component. Environ. Pollut. 2011; 159: 2214–2222.
- Fan J. L , Hu Z. Y , Wang T. J , Zhou J , Wu C. Y. H , co-authors . Atmospheric inorganic nitrogen deposition to a typical red soil forestland in southeastern China. Environ. Monit. Assess. 2009; 159(1–4): 241–253.
- Fan M. L , Wang X. M , Wang Q , Lin W. S , Jing H . Atmospheric deposition of nitrogen and phosphorus into the Hengmen of Pearl River Estuary. J. of Trop. Oceanogr. 2010; 29(1): 51–56. (in Chinese with English abstract).
- Fang Y. T , Gundersen P , Mo J. M , Zhu W. X . Input and output of dissolved organic and inorganic nitrogen in subtropical forests of South China under high air pollution. Biogeosciences. 2008; 5: 339–352.
- Fang Y. T , Gundersen P , Mo J. M , Zhu W. X . Nitrogen leaching in response to increased nitrogen inputs in subtropical monsoon forests in southern China. Forest. Ecol. Manag. 2009a; 257: 332–342.
- Fang Y. T , Yoh M , Mo J. M , Gundersen P , Zhou G. Y . Response of nitrogen leaching to nitrogen deposition in disturbed and mature forests of southern China. Pedosphere. 2009b; 19(1): 111–120.
- Fowler D , Smith R. I , Muller J , Cape J. N , Sutton M , co-authors . Long term trends in sulphur and nitrogen deposition in Europe and the cause of non-linearities. Water, Air, and Soil Pollut.: Focus. 2007; 7: 41–47.
- Galloway J. N , Dentener F. J , Capone D. G , Boyer E. W , Howarth R. W , co-authors . Nitrogen cycles: past, present, and future. Biogeochemistry. 2004; 70: 153–226.
- Galloway J. N , Townsend A. R , Erisman J. W , Bekunda M , Cai Z. C , co-authors . Transformation of the nitrogen cycle: recent trends, questions, and potential solutions. Science. 2008; 320: 889–892.
- Greaver T. L , Sullivan T. J , Herrick J. D , Barber M. C , Baron J. S , co-authors . Ecological effects of nitrogen and sulfur air pollution in the US: what do we know?. Front. Ecol. Environ. 2012; 10: 365–372.
- Gruber N , Galloway J. N . An earth-system perspective of the global nitrogen cycle. Nature. 2008; 451: 293–296.
- Guangdong Statistical Yearbook. 1991–2011. Bureau of Statistics of Guangdong Province. Beijing: China Statistics Press.
- Guo J. H , Liu X. J , Zhang Y , Shen J. L , Han W. X , co-authors . Significant acidification in major Chinese croplands. Science. 2010; 327: 1008–1010.
- Horii C. V , Munger J. W , Wofsy S. C , Zahniser M , Nelson D , co-authors . Atmospheric reactive nitrogen concentration and flux budgets at a Northeastern U.S. forest site. Agr. Forest. Meteorol. 2005; 133: 210–225.
- Hu J. T , Li S. Y . Modeling the mass fluxes and transformations of nutrients in the Pearl River Delta, China. J. Marine Syst. 2009; 78(1): 146–167.
- Huang D. Y , Xu Y. G , Zhou B , Zhang H. H , Lan J. B . Wet deposition of nitrogen and sulfur in Guangzhou, a subtropical area in South China. Environ. Monit. Assess. 2010; 171: 429–439.
- Huang K , Zhuang G , Xu C , Wang Y , Tang A . The chemistry of the severe acidic precipitation in Shanghai, China. Atmos. Res. 2008; 89: 149–160.
- Huang L , Jian W , Song X , Huang X , Liu S , co-authors . Species diversity and distribution for phytoplankton of the Pearl River estuary during rainy and dry seasons. Mar. Pollut. Bull. 2004; 49: 588–596.
- Huang X. F , Li X , He L.-Y , Feng N , Hu M , co-authors . 5-Year study of rainwater chemistry in a coastal mega-city in South China. Atmos. Res. 2010; 97: 185–193.
- Huang Y. L , Lu X. X , Chen K . Wet atmospheric deposition of nitrogen: 20 years measurement in Shenzhen City, China. Environ. Monit. Assess. 2012
- Larssen T , Duan L , Mulder J . Deposition and leaching of sulfur, nitrogen and calcium in four forested catchments in China: implications for acidification. Environ. Sci. Technol. 2011; 45: 1192–1198.
- Li J , Fang Y. T , Yoh M , Wang X. M , Wu Z. Y , co-authors . Organic nitrogen deposition in precipitation in metropolitan Guangzhou city of southern China. Atmos. Res. 2012; 113: 57–67.
- Liu X. J , Duan L , Mo J. M , Du E. Z , Shen J. L , co-authors . Nitrogen deposition and its ecological impact in China: an overview. Environ. Pollut. 2011; 159: 2251–2264.
- Liu X. J , Zhang Y , Han W. X , Tang A. H , Shen J. L , co-authors . Enhanced nitrogen deposition over China. Nature. 2013; 494: 459–462.
- MEP. Report on the State of the Environment in China 2011. 2012. Online at: http://jcs.mep.gov.cn/hjzl/zkgb/2011zkgb/201206/t20120606_231039.htm .
- Morselli L , Bernardi E , Vassura I , Passarini F , Tesini E . Chemical composition of wet and dry atmospheric depositions in an urban environment: local, regional and long-range influences. J. Atmos. Chem. 2008; 59: 151–170.
- Munger J. W , Fan S.-M , Bakwin P. S , Goulden M. L , Goltstein A. H , co-authors . Regional budgets for nitrogen oxides from continental sources: variations of rates for oxidation and deposition with season and distance from source regions. J. Geophys. Res. 1998; 103: 8355–8368.
- Neff J. C , Holland E. A , Dentener F. J , McDowell W. H , Russell K. M . The origin, composition and rates of organic nitrogen deposition: a missing piece of the nitrogen cycles?. Biogeochemistry. 2002; 57/58: 99–136.
- Network Center for EANET. Data Report on the Acid Deposition in the East Asian Region 2000–2010. 2001–2011. Online at: http://www.eanet.cc/product/index.html .
- Pan Y. P , Wang Y. S , Tang G. Q , Wu D . Wet and dry deposition of atmospheric nitrogen at ten sites in Northern China. Atmos. Chem. Phys. 2012; 12: 6515–6535.
- Shahin U. M , Zhu X , Holsen T. M . Dry deposition of reduced and reactive nitrogen: a surrogate surface approach. Environ. Sci. Technol. 1999; 33: 2113–2117.
- Shen J. L , Li Y , Liu X. J , Luo X. S , Tang H , co-authors . Atmospheric dry and wet nitrogen deposition on three contrasting land use types of an agricultural catchment in subtropical central China. Atmos. Environ. 2013; 67: 415–424.
- Sparks J. P , Walker J , Turnipseed A , Guenther A . Dry nitrogen deposition estimates over a forest experiencing free air CO2 enrichment. Global Change Biol. 2008; 14
- Streets D. G , Bond T. C , Carmichael G. R , Fernandes S. D , Fu Q , co-authors . A year-2000 inventory of gaseous and primary aerosol emissions in Asia to support TRACE-P modeling and analysis. J. Geophys. Res. 2003; 108(D21): 8809.
- Tang A , Zhuang G , Wang Y , Sun Y , Yuan H , co-authors . The chemistry of precipitation and its relation to aerosol in Beijing. Atmos. Environ. 2005; 39: 3397–3406.
- Tanner P. A . Analysis of Hong Kong daily bulk and wet deposition data from 1994 to 1995. Atmos. Environ. 1999; 33: 1757–1766.
- Tanner P. A , Wong A. Y. S . Soluble trace metals and major ionic species in the bulk deposition and atmosphere of Hong Kong. Water, Air, Soil Pollut. 2000; 122: 261–273.
- Wai K. M , Leung K. Y , Tanner P. A . Observational and modeling study of dry deposition on surrogate surfaces in a South China city: implication of removal of atmospheric crustal particles. Environ. Monit. Assess. 2010; 164: 143–152.
- Wai K. M , Tanner P. A , Tam C. W. F . 2-year study of chemical composition of bulk deposition in a South China coastal city: comparison with East Asian cities. Environ. Sci. Technol. 2005; 39: 6542–6547.
- Wang X. M , Carmichael G , Chen D. L , Tang Y. H , Wang T. J . Impacts of different emission sources on air quality during March 2001 in the Pearl River Delta (PRD) region. Atmos. Environ. 2005; 39: 5227–5241.
- Wang X. M , Chen F , Wu Z. Y , Zhang M. G , Tewari M , co-authors . Impacts of weather conditions modified by urban expansion on surface ozone: comparison between the Pearl River Delta and Yangtze River Delta regions. Adv. Atmos. Sci. 2009a; 26(5): 962–972.
- Wang X. M , Wu Z. Y , Liang G. X . WRF/CHEM modeling of impacts of weather conditions modified by urban expansion on secondary organic aerosol formation over Pearl River Delta. Particuology. 2009b; 7(5): 384–391.
- Wang X. Z , Zhu J. G , Gao R , Hosen Y . Dynamics and ecological significance of nitrogen wet deposition in Taihu Lake region-taking Changshu Agroecological Experiment station as an example. Chinese J. of Appl. Ecol. 2004; 15: 1616–1620. (in Chinese with English abstract).
- Wei G. Q , Wang H , Cai W. X , Yi B . 10-year retrospective analysis on the harmful algal blooms in the Pearl River Estuary. Marine Sci. Bull. 2012; 31(4): 466–474. (in Chinese with English abstract).
- Xing J , Wang S. X , Chatani S , Zhang C. Y , Wei W , co-authors . Projections of air pollutant emissions and its impacts on regional air quality in China in 2020. Atmos. Chem. Phys. 2011; 11: 3119–3136.
- Xu H , Bi X.-H , Feng Y.-C , Lin F.-M , Jiao L , co-authors . Chemical composition of precipitation and its sources in Hangzhou, China. Environ. Monit. Assess. 2011; 183: 581–592.
- Xu Y. G , Zhou G. Y , Wu Z. M , Luo T. S , He Z. C . Chemical composition of precipitation, throughfall and soil solutions at two forested sites in Guangzhou, South China. Water, Air, and Soil Pollut. 2001; 130: 1079–1084.
- Xu Z. F , Han G. L . Chemical and strontium isotope characterization of rainwater in Beijing, China. Atmos. Environ. 2009; 43: 1954–1961.
- Yang F , Tan J , Shi Z. B , Cai Y , He K , co-authors . Five-year record of atmospheric precipitation chemistry in urban Beijing, China. Atmos. Chem. Phys. 2012; 12: 2025–2035.
- Yang R , Hayashi K , Zhu B , Li F. Y , Yan X. Y . Atmospheric NH3 and NO2 concentration and nitrogen deposition in an agricultural catchment of Eastern China. Sci. Total Environ. 2010; 408: 4624–4632.
- Zhang L , Vet R , O'Brien J. M , Mihele C , Liang Z , co-authors . Dry deposition of individual nitrogen species at eight Canadian rural sites. J. Geophys. Res. 2009; 114: D02301.
- Zhang M. Y , Wang S. J , Wu F. C , Yuang X. H , Zhang Y . Chemical compositions of wet precipitation and anthropogenic influences at a developing urban site in southeastern China. Atmos. Res. 2007; 84: 311–322.
- Zhang Y , Song L , Liu X. J , Li W. Q , Lü S. H , co-authors . Atmospheric organic nitrogen deposition in China. Atmos. Environ. 2012; 46: 195–204.
- Zhang Y , Zheng L. X , Liu X. J , Jickells T , Cape J. N , co-authors . Evidence for organic N deposition and its anthropogenic sources in China. Atmos. Environ. 2008; 42: 1035–1041.
- Zhang Y. H , Xie S. D . Choice of control of sulfur and/or nitrogen deposition based on critical loads. Chinese Sci. Bull. 2010; 55: 493–498.
- Zhao X , Yan X. Y , Xiong Z. Q , Xie Y. X , Xing G. X , co-authors . Spatial and temporal variation of inorganic nitrogen wet deposition to the Yangtze River Delta Region, China. Water Air Soil Pollut. 2009; 203: 277–289.
- Zheng J. Y , Yin S. S , Kang D. W , Che W. W , Zhong L. J . Development and uncertainty analysis of a high-resolution NH3 emissions inventory and its implications with precipitation over the Pearl River Delta region, China. Atmos. Chem. Phys. 2012; 12: 7041–7058.
- Zheng J. Y , Zhang L. J , Che W. W , Zheng Z. Y , Yin S. S . A highly resolved temporal and spatial air pollutant emission inventory for the Pearl River Delta region, China and its uncertainty assessment. Atmos. Environ. 2009; 43: 5112–5122.
- Zhou G , Guan L , Wei X , Zhang D , Zhang Q , co-authors . Litterfall production along successional and altitudinal gradients of subtropical monsoon evergreen broadleaved forests in Guangdong, China. Plant Ecol. 2007; 188: 77–89.
- Zobrist J , Wersin P , Jaques C , Sigg L , Stumm W . Dry deposition measurements using water as a receptor: a chemical approach. Water, Air, and Soil Pollut. 1993; 71: 111–130.