
Abstract
Biomass burning produces aerosols and air pollutants during springtime in Southeast Asia. At the Lulin Atmospheric Background Station (LABS) (elevation 2862 m) in central Taiwan, the concentrations of carbon monoxide (CO), ozone (O3) and particulate matter with a diameter less than 10 µm (PM10) were found to be 135–200 ppb, 40–56 ppb and 13–26 µg/m3, respectively, in the springtime (February–April) between 2006 and 2009, which are 2–3 times higher than those in other seasons. Simulation results indicate that higher concentrations during springtime are related to biomass-burning plumes transported from the Indochinese peninsula of Southeast Asia. The spatial distribution of high aerosol optical depth (AOD) was identified by satellite measurement and Aerosol Robotic Network (AERONET) ground observation, and could be reasonably captured by the WRF-Chem model during the study period of 15–18 March 2008. Simulated AOD reached as high as 0.8–1.2 in Indochina situated between 10–22°N and 95–107°E. According to the simulation results, 34% of the AOD was attributed to organic carbon over Indochina, while the contribution of black carbon to AOD was about 4%. During the study period, biomass-burning aerosols over Indochina have a net negative effect (−26.85 W·m−2) at ground surface, a positive effect (22.11 W·m−2) in the atmosphere and a negative forcing (−4.74 W·m−2) at the top of atmosphere. Under the influence of biomass-burning aerosol plume transported by strong wind, there is a NE−SW zone stretching from southern China to Taiwan with reduction in shortwave radiation of about 20 W·m−2 at ground surface. Such significant reduction in radiation attributed to biomass-burning aerosols and their impact on the regional climate in East Asia merit attention.
1. Introduction
Biomass burning produces aerosols and air pollutants in the atmosphere. The burning of agricultural waste or forest wild fires under specific weather conditions contributes a significant amount of air pollutants within a short period of time. During springtime (February–April), fire hotspots dot all over the Indochinese peninsula, which comprises countries including Thailand, Laos, Cambodia, Myanmar, Vietnam, and the mainland territory of Malaysia (Christopher et al., Citation1996; Dwyer et al., Citation1998; Lin et al., Citation2009). Depending on the weather conditions, products of biomass burning have significant impacts not only on local but also on regional air quality, biogeochemical cycles, climate and the hydrological cycle (Crutzen and Andreae, Citation1990; Ramanathan et al., Citation2001, Citation2007; Ramanathan and Crutzen, Citation2003; Jaffe et al., Citation2004; Tian et al., Citation2009; Grell et al., Citation2011; Fu et al., Citation2012; Lin et al., Citation2013; Reid et al., Citation2013; Yen et al., Citation2013).
Biomass burning in Indochina has been found to have a significant effect on the ozone concentration in Hong Kong (Andreae et al., Citation1988; Liu et al., Citation1999; Chan et al., Citation2003) and Taiwan (Lin et al., Citation2009, Citation2010). Furthermore, the biomass-burning aerosols over the Indian Ocean and Asia are one of the critical sources for the formation of atmospheric brown cloud in South Asia (Ramanathan and Crutzen, Citation2003; Ramanathan et al., Citation2007). However, there are still uncertainties when estimating the radiative effects of aerosols (IPCC, 2007). Certain components of aerosols, such as black carbon (BC), have been identified to contribute significantly to global warming, while sulphate has a cooling effect (Ramanathan et al., Citation2007; Zhao et al., Citation2013). In addition, the uncertainty of net radiative forcing (RF) remains large due to the mixing states and compositions of aerosols; thus, assessing RF and its impact on the climate remains a challenging issue (IPCC, 2007).
A previous study (Lin et al., Citation2009) has already identified that both thermal effect and dynamic forcing resulting from mountain lee-side effect play important roles in enhancing the upward motion of biomass-burning products. Thus, aerosols and pollutants could be uplifted to above 3 km and transported by strong westerly winds downwind to Taiwan and even the entire East Asia. With biomass-burning fires occurring in spring, its impact on the air quality and the regional climate are the major concerns to the countries affected. Recent advent of satellite monitoring systems, such as the Along-Track Scanning Radiometer (ATSR) (Kasischke et al., Citation2003), Advanced Very High Resolution Radiometer (AVHRR) (Ichoku et al., Citation2003), and Moderate Resolution Imaging Spectroradiometer (MODIS) (Giglio et al., Citation2006a, Giglio et al., Citation2006b; van der Werf et al., Citation2006; Boschetti et al., Citation2008), has provided useful information for identifying fire events and the duration of burning. However, the information provided by satellites is still limited, especially in terms of the critical information on composition of aerosols. Thus, numerical modelling remains the effective approach to estimating the impact of individual aerosol species on the RF and the climate.
The remainder of this paper is organised as follows. Section 2 presents the evidence of biomass burning in Indochina and the properties of aerosol optical depth (AOD), followed by case studies using observation data from an ozonesonde, satellites, Aerosol Robotic Network (AERONET, http://aeronet.gsfc.nasa.gov/), and measurements obtained at the air quality background station in Section 3. Then, both long-range transport of biomass-burning products and RF calculated by the Weather Research and Forecasting (WRF) (Skamarock et al., Citation2008) model coupled with chemistry (WRF-Chem; Ver.3.2.1) (Grell et al., Citation2005) are described and discussed in Sections 4 and 5, respectively. Conclusions of this study are given in Section 6.
2. Data sources and observations
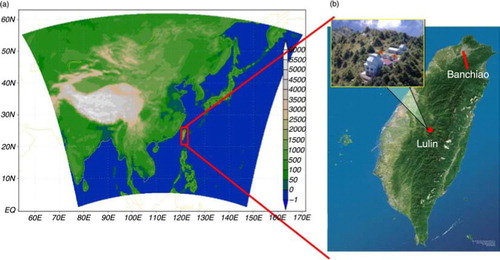
Previous studies (Lin et al., Citation2009, Citation2010) have indicated that the long-range transport of biomass-burning products to Taiwan is mostly at the elevation of 2000–4000 m. To evaluate the amount of pollutants transported from Indochina, a high-altitude sampling site, the Lulin Atmospheric Background Station (LABS) (http://lulin.tw/index_en.htm) located at Lulin Mountain (23.47°N, 120.87°E; 2862 m above mean sea level), central Taiwan (a and b), was selected for this study. Measurements of hourly particulate matter with a diameter less than 10 µm (PM10), carbon monoxide (CO), ozone (O3) and meteorological parameters such as air temperature and wind field were analysed in this study. Moreover, observation of ozone sounding launched at Taipei on 18 March, 2008 was employed to assess the amount of biomass-burning products transported. Furthermore, the observations of AERONET over Southeast Asia and satellite data such as MODIS and Measurement of Pollutants in the Troposphere (MOPITT) were also analysed to evaluate the model performance.
Fig. 1 (a) Simulation domain and location of Taiwan (red box) in East Asia, and (b) location of Lulin Atmospheric Background Station (23.47°N, 120.87°E, elevation 2862 m).
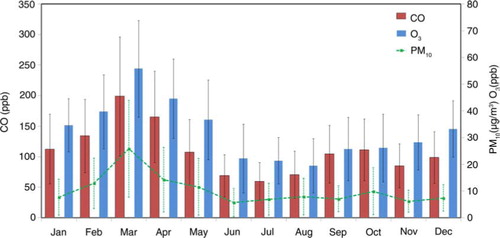
shows the average monthly concentrations of CO, O3 and PM10 observed at the LABS between 2006 and 2009. As can be seen, CO concentration ranges between 135 and 200 ppb during springtime (February–April) but is mostly less than 110 ppb in other seasons; and O3 concentration ranges between 40 and 56 ppb during springtime but between 20 and 35 ppb in other seasons. The monthly variation for PM10 concentration shows the same trend as that for CO and O3, i.e., with the highest PM10 concentration of 13–26 µg/m3 during springtime. Concentrations of air pollutants at the LABS during the biomass-burning season (spring) is estimated to be 2–3 times higher than those in other seasons, especially for PM10 concentration, which can reach 3–5 times higher in spring than in other seasons.
Fig. 2 Average monthly concentrations of CO (red bar), O3 (blue bar) and PM10 (green dashed line) at LABS between 2006 and 2009.
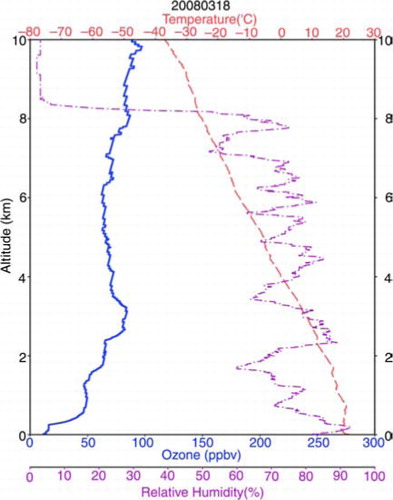
To study the impact of biomass burning in Indochina on Taiwan which is located in the downwind area, a high-ozone episode on 18 March, 2008 in northern Taiwan (Banchiao station, 121.43°E, 24.98°N, b) was selected to identify the transport of ozone. As seen in the vertical profile shown in , the ozone sounding in the troposphere lower than 1.6 km was less than 50 ppb. However, there was a distinct ozone peak of 80 ppb with high relative humidity (> 90%) around 3 km. This finding is consistent with previously reported results (Lin et al., 2010) that ozone concentrations in the lower troposphere between 2 and 5 km over northern Taiwan ranged from 70 to 80 ppb in spring in the years 2004–2005. In general, the average relative humidity is lower than 60% for the altitude between 2 and 4 km (Lin et al., 2010) in spring. In fact, the atmospheric condition below 2 km is usually dry due to the dominant continental outflow in this season. The peak ozone concentration around 3 km with high relative humidity implied that the air masses came mainly from the lower troposphere (Liu et al., 1999; Chan et al., 2003; Lin et al., 2009, 2010).
Fig. 3 Vertical profile of ozone, relative humidity and temperature over northern Taiwan (Banchiao station, 121.4°E, 24.98°N) at 00 UTC (08:00 LST) on 18 March 2008.
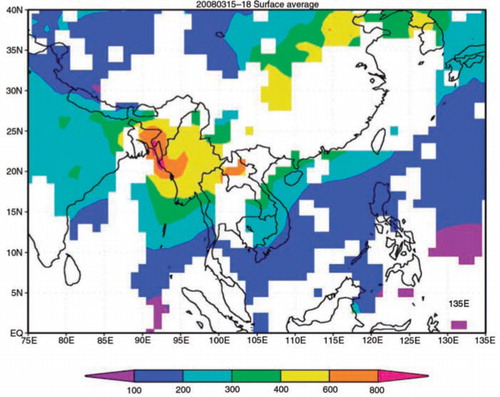
a–c shows the observed hourly CO, O3 and PM10 concentrations at LABS from 15 to 18 March, 2008. As can be seen, on the day when the high-ozone episode occurred, 18 March, 2008, the hourly CO, O3, and PM10 concentrations observed are 200–280 ppb, 55–80 ppb, and 30–55 µg/m3, respectively. While the concentration of CO and O3 are close to their monthly mean recorded in March (135–200 and 40–56 ppb, respectively), the concentration of PM10 exceeds the monthly mean in March (13–26 µg/m3) by more than two times. depicts the average CO concentrations at 1000 hPa deduced from the MOPITT satellite data between 15 and 18 March, 2008. As can be seen, satellite data for most of the areas in East Asia, including Taiwan, were missing. Nevertheless, average CO concentrations as high as 400–600 ppb were detected near surface (1000 hPa) in Indochina between 17–25°N and 95–105°E.
Fig. 4 Observed and simulated hourly (a) PM10 and PM2.5, (b) O3, (c) CO concentrations at LABS between 15 and 18 March 2008. Obs: observation; Ctrl: control run; bbmCO*2: CO concentration with doubled biomass-burning emission; anthCO*2: CO concentration with doubled anthropogenic emission; and Fd9: simulation starting from 9 March.
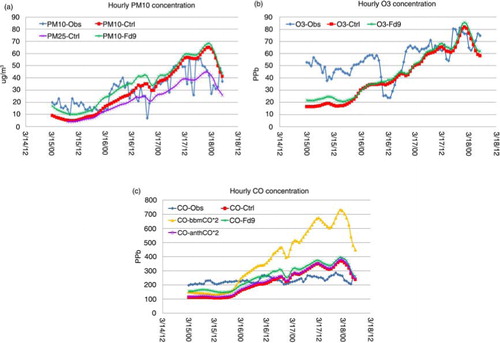
Fig. 5 Average CO concentrations at 1000 hPa obtained from MOPITT satellite between 15 and 18 March, 2008. Unit: ppb.
In the following sections, the linkage between biomass burning in Indochina and downwind Taiwan is identified and evaluated using the air mass trajectory model and air pollutant transport processes simulated by WRF-Chem.
3. Trajectory and WRF-Chem models
To trace the origins of air masses that accounted for the high-ozone episode on 18 March, 2008, and to examine how air mass trajectories could affect the ozone concentration profiles in northern Taiwan, the Hybrid Single-Particle Lagrangian-Integrated Trajectory (HYSPLIT) model (Draxler and Hess, Citation1998) was employed. Furthermore, the WRF (Skamarock et al., Citation2008) model coupled with chemistry (WRF-Chem; Ver. 3.2.1) (Grell et al., Citation2005) was utilised to study the long-range transport of air masses associated with biomass burning in Indochina. The meteorological initial and boundary conditions for WRF-Chem were obtained from National Centers for Environmental Prediction Final (NCEP-FNL) Operation Global Analysis data sets at 6-hour intervals. The Mellor Yamada Janijc (MYJ) planetary boundary layer scheme was selected for this study. The horizontal resolution for the simulations performed is 27 km and the grid box has 301×240 points in the east–west and north−south directions. There are 35 vertical levels with the lowest level at an elevation of about 20 m. To ensure that the meteorological fields are well simulated, the four-dimensional data assimilation (FDDA) scheme was activated using the NCEP-FNL analysis data.
The cloud microphysics used in this simulation by WRF-Chem was the Morrison double moment scheme (Morrison et al., Citation2005). The rapid radiative transfer model (RRTMG) (Zhao et al., Citation2011) was used for both longwave (LW) and shortwave (SW) radiation schemes. The land surface scheme applied was Noah. The Regional Acid Deposition Model 2 (RADM2) was adopted for the chemistry mechanism (Stockwell et al., Citation1990). The Modal Aerosol Dynamics Model for Europe (MADE) coupled with the Secondary Organic Aerosol Model (SORGAM) (MADE/SORGAM) was the aerosol scheme (Ackermann et al., Citation1998; Schell et al., Citation2001). The MADE/SORGAM uses the modal approach with three lognormal modes (Aikten, accumulation and coarse modes) to represent aerosol size distribution. Anthropogenic emissions, such as NOx, CO, SO2, non-methane volatile organic compounds (NMVOC), sulphate, nitrate, PM10 and PM2.5, were adopted from the most recent inventory in Asia in the year 2006 according to Zhang et al. (Citation2009)(http://mic.greenresource.cn/static/). The Fire Inventory from NCAR (FINN1, http://bai.acd.ucar.edu/Data/fire/) (Wiedinmyer et al., Citation2011) was employed to examine biomass-burning emission. The FINNv1 (version 1.0) provides daily, 1-km resolution, global estimates of the trace gas and particle emissions from open burning of biomass, which includes wildfire, agricultural fires, and prescribed burning and does not include biofuel use and trash burning (Wiedinmyer et al., Citation2011). The dust emission scheme adopted from the Goddard Chemistry Aerosol Radiation and Transport (GOCART) model was coupled with the MADE/SORGAM aerosol scheme (Zhao et al., 2010) and used in this study.
Aerosol optical properties such as extinction, single-scattering albedo, and asymmetry factor for scattering were computed as a function of wavelength and three-dimensional position. A detailed description on the computation of aerosol optical properties using WRF-Chem can be found in Fast et al. (Citation2006) and CitationBarnard et al. (2010). Aerosol species in this study are assumed to be internally mixed within each mode. Therefore, the optical depth and direct radiative forcing (DRF) of individual aerosol species can only be diagnosed. According to the methodology proposed by CitationZhao et al. (2013), calculation of aerosol optical properties and RF is performed multiple times with the mass of one aerosol species and also its associated water aerosol mass removed from the calculation each time. After this diagnostic iteration procedure, then withdraw an aerosol component from the aerosol mixture and then calculate the RF as the difference between radiative fluxes with and without that aerosol component.
In this study, the simulation covered a period of 8 d starting from 11 March, with a 4-d run for spin up between 11 and 14 March.
4. Simulation results and discussion
4.1. Model evaluation
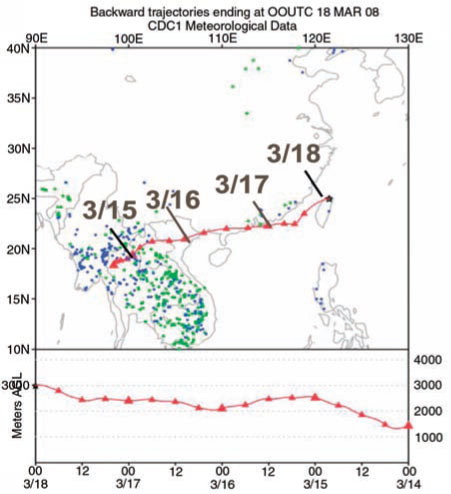
shows the 4-d backward trajectory analysed using HYSPLIT model at an altitude of 3 km in northern Taiwan for the high-ozone episode of 18 March 2008. As can be seen, the air masses in northern Taiwan on 18 March originated from the major biomass-burning regions in Indochina and southern China, where burning occurred some days ago at an elevation lower than the trajectory layer. The fire hotspots derived from MODIS satellite observations () from 15 (green dots) to 16 (blue dots) March indicate numerous fires occurring all over Indochina.
Fig. 6 Backward trajectory analysis results obtained using HYSPLIT model starting at 00:00 UTC (08:00LST) on 18 March 2008 at altitude 3000 m at Banchiao station in northern Taiwan. Distribution of active fires detected by MODIS from 15 (green dots) to 16 (blue dots) March 2008.
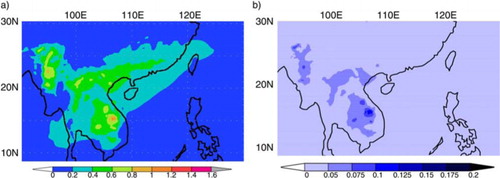
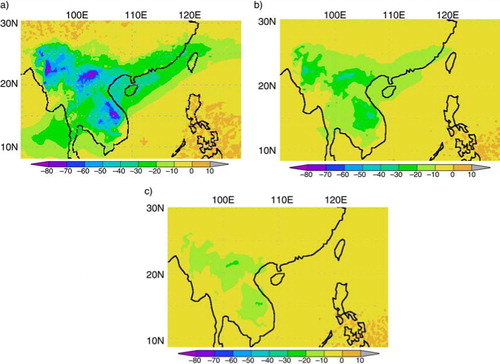
To further evaluate the performance of WRF-Chem in modelling transport of biomass-burning aerosols in Indochina, comparison was made between the WRF-Chem-simulated and observed AOD from 15 to 18 March, 2008. shows the AOD at 550 nm deduced from the MOIDS satellite data, and simulated with and without biomass-burning emission from 15 to 18 March, 2008. As seen in a, the AOD at 550 nm observed by the MODIS satellite is around 1.0 in central and northern Indochina, the coastal area of south China and Taiwan Strait. On the other hand, the simulated AOD for the same period of time ranges between 0.6 and 1.2 over northern Indochina, southern China, Hong Kong and Taiwan, with particularly high values of 1.6 over the Yangtze River Delta, as shown in b. However, simulation conducted without biomass-burning emission shows that most areas in Indochina had AOD less than 0.2, as seen in c. Hence, comparing the simulated results with and without biomass-burning emission reveals that biomass burning over Indochina contributed significantly to the AOD over Southeast Asia.
Fig. 7 Average aerosol optical depth (AOD) at 550 nm (a) deduced from the MOIDS satellite data, simulated (b) with and (c) without biomass-burning emission from 15 to 18 March, 2008.
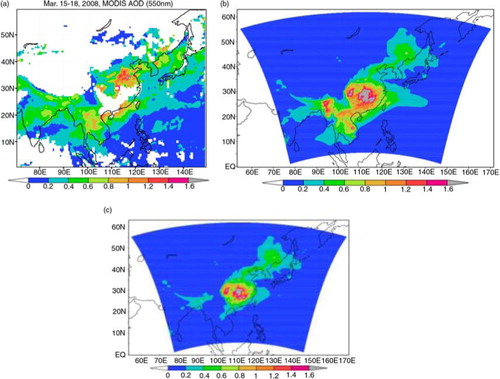
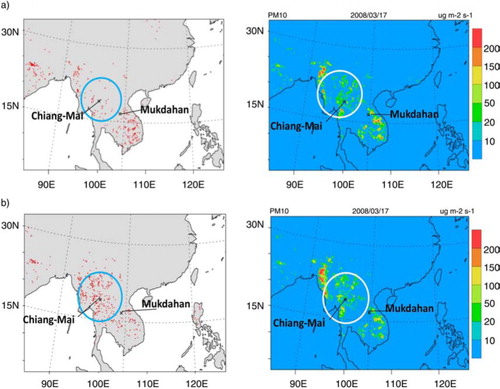
It is important to note that the simulated AOD (b) is higher than the MODIS-observed values (a) at some locations over Indochina. Martonchik et al. (Citation2004) had pointed out the uncertainties of AOD values deduced from satellite observations. In addition, there are lots of studies discussing the uncertainties of MODIS when using Aerosol Robotic Network (AERONET) data for different purposes (Holben et al., Citation1998; Dubovik et al., Citation2000, Citation2002). All the AOD retrievals are of quality level 2, and the uncertainty of AOD measurements is about±0.01 (Holben et al., Citation2001). In this study, the AERONET 550 nm AOD was interpolated from the AOD measured at 675 nm and 440 nm. For example, the uncertainty can be±0.05 in MODIS AOD measurement over land (Chu et al., Citation2002; Remer et al., Citation2005). Tripathi et al. (Citation2005) suggested that the absolute difference between MODIS and AERONET is found to be low (0.12±0.11) during the non-dust-loading season but much higher (0.4±0.2) during dust-loading seasons over India. In regard to this, ground AERONET observations at 550 nm were employed for further comparisons. shows the average AOD at 550 nm observed by AERONET and simulated using WRF-Chem with and without biomass-burning emission at various ground stations in Indochina, Hong Kong and Taiwan. As can be seen, the AOD at Bac Lieu station, Vietnam, which is situated at the southern tip of Indochina, was less than 0.4 during the study period. Comparatively, the stations located in the northern part of Indochina had higher AOD recorded. For example, on 18 March, the AERONET-measured AOD was 0.5 at Silkpauorn University station, as high as 1.0 at Mukdahan station and reached around 1.2 at Chiang Mai station. These three stations are all in Thailand, and the further north the station is located, the higher the AOD was recorded. Such northward trend of increase in AERONET-measured AOD can be attributed to the concentration of fire hotspots in the north of Indochina.
Fig. 8 Average AOD at 550 nm observed by AERONET and simulated using WRF-Chem with and without biomass-burning emission (Sim-bb and Sim-nobb) and simulation started from 09 March (Sim-Fd9) at various ground stations from 15 to 18 March, 2008.
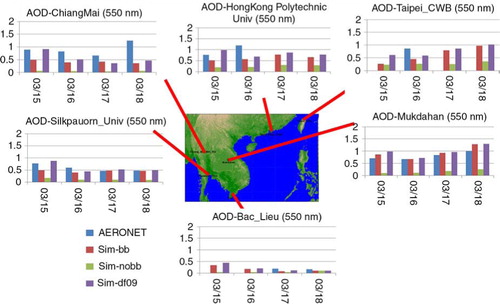
Similarly, the AOD simulated by WRF-Chem with biomass-burning emission show the same pattern of higher AOD at stations in northern Indochina. However, among the three stations in Thailand, the AERONET-measured and WRF-Chem-simulated AOD are similar at Silkpauorn University station, while differences are observed at the other two stations. At Chiang Mai station, the simulated AOD is much lower than the AERONET-measured AOD; while at Mukdahan station, the reverse is observed, with simulated AOD exceeding the AERONET-measured AOD. Such discrepancy might be due to underestimation of biomass-burning emission around Chiang Mai. We discuss this further in Section 6.
For Polytechnic University station in Hong Kong and Central Weather Bureau station in Taipei, both located at the downwind of Indochina, the AOD recorded on 16 March (data on 17–18 March not available) was around 1.2 and 0.8, respectively. Hence, the spatial distribution of high AOD covered not only Indochina but also distant downwind areas such as Hong Kong and Taiwan.
Of note is that the simulated AOD with biomass-burning emission at all stations are markedly higher than those simulated without biomass-burning emission (), highlighting the significant contribution of biomass-burning pollutants to AOD.
Comparison between observed and simulated hourly PM10, PM2.5, O3 and CO, concentrations at the LABS between 15 and 18 March, 2008 can be seen in . The modelling results shown are obtained at 700 hPa because the LABS is situated at an elevation around 3000 m. As seen in , the control run of simulated PM10 (PM10-Ctrl) and O3 (O3-Ctrl) show trends similar to the observed findings though the concentrations during 15–16 March tend to be underestimated. Of note is that the CO variation has a maximum discrepancy about 100 ppb during the study period except for 16 March. Possible reasons for such discrepancy will be discussed in Section 4.3. Moreover, it was found that PM2.5 dominated the PM10 concentration, accounting for 70–80% of total PM10 concentration during 15–18 March, 2008. Biomass-burning aerosols were predominantly fine particles (PM2.5), which constitute a high proportion of PM10 concentration. The PM2.5/PM10 ratio at Xiamen Bay in China (Li et al., Citation2013), Thailand (Oanh et al., Citation2011), Korea (Ryu et al., Citation2007), and central Taiwan (Cheng et al., Citation2009) were found to be as high as 90, 79, 90 and 80%, respectively. Note that these findings are close to the simulated results in this study.
4.2. Simulation of biomass-burning aerosol transport
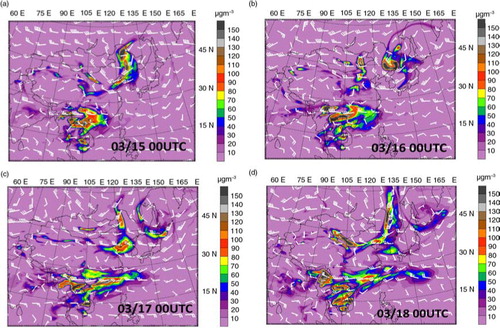
depicts the simulated spatial distribution of PM10 concentration and wind field at 700 hPa (around 3000 m). As can be seen, easterly wind blows in the south of 15°N; while a westerly flow prevails in the north of 15°N. There were a strong wind zone (wind speed≥10 ms−1) at 700 hPa just south of the Tibetan plateau and a trough over Indochina, which enhanced the upward motion of particles and favoured the transport of pollutants by strong wind (Lin et al., Citation2009). Over the areas with a high density of biomass-burning fire hotspots in north Indochina, the PM10 concentration exceeded 150 µgm−3 between 15 and 16 March (a and b, respectively). Driven by the strong wind, the transport of biomass-burning plume with high PM10 concentration shifted from a north−south to an east−west direction on 16 and 17 March (b and c, respectively). The simulation shows a high PM10 concentration zone (≥40 µgm−3) of 4000 km long and 300–500 km wide stretching from Indochina, through southern China and Taiwan to south of Japan (c and d, respectively). The modelled results successfully reproduced the strong westerly flow pattern necessary (Lin et al., Citation2009) for long-range transport of biomass-burning pollutants from Indochina to Taiwan.
Fig. 9 Simulated distributions of PM10 concentration and wind field at 700 hPa at 00 UTC on (a) 15, (b) 16, (c) 17, and (d) 18 March 2008. A full (half) wind barb indicates 5 ms−1 (2.5 ms−1).
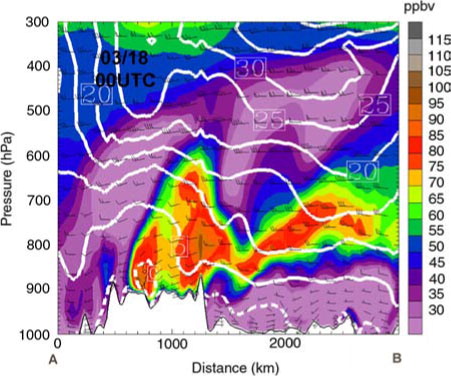
To further illustrate the mechanism that dominates the vertical transport of biomass-burning plumes over Indochina, the concentrations of PM10 and O3 are presented on a cross-section along the line AB marked in a. a also shows the geographic location and relief of Asia. As seen in the cross-section of AB, the wind speed contours (≥10 ms−1) from 500 hPa down to 900 hPa show a wind trough on the lee side of the mountain. This lee-side trough which lasted from 16 to 18 March induced a significant upward motion and carried air mass with PM10 concentration≥40 µgm−3 to a high elevation around 600 hPa (b and c). Biomass-burning plumes with high PM10 concentration were transported by strong wind (≥10 ms−1) and propagated to the downwind areas. The cross-section between 900 and 600 hPa on 17–18 March had PM10 concentration ≥40 µgm−3 (d–f). Other pollutants were also found to be transported in similar pathways. shows the vertical distribution of O3 concentration in the morning of 18 March, the day when the ozone sounding was launched in Taiwan (). As can be seen, O3 concentration reached 65–70 ppb at an altitude around 3000 m (700 hPa).
Fig. 10 (a) Geographic location and relief of Asia. (b) Vertical distribution of PM10 concentration and wind field in cross-section of AB at (b) 00 UTC 16 (c) 12 UTC 16 (d) 00 UTC 17 (e) 12 UTC 17 and (f) 00 UTC 18 March, 2008. The solid contours are the westerly wind speed shown at 5 ms−1 interval. The dashed line represents 0 ms−1.
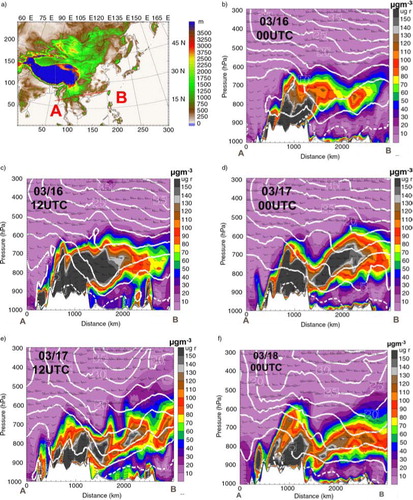
Fig. 11 Vertical distribution of O3 concentration and wind field in cross-section of AB at 00 UTC 18 March 2008.
4.3. Sensitivity study
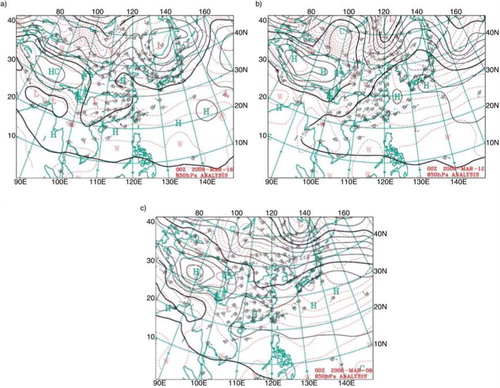
Except for CO, the present simulation in general can capture well the variations of PM10 and O3 during 17–18 March, but the simulated results for 15–16 March show underestimation. Can such discrepancy between observation and simulation for 15–16 March be attributed to the initial atmospheric condition or emissions? According to the backward trajectories, the air mass transport from Indochina to Taiwan took about 2 d (). Thus, peak air pollutant levels was observed at Lulin Mountain on 17–18 March, right after the air mass passed over Indochina on 15–16 March. Similarly, the lowest PM10 concentration was recorded at Lulin Mountain on 15–16 March, following the passing of air mass over Indochina on 13–14 March. Previous research (Lin et al., Citation2009) already pointed out the significant long-range transport of biomass-burning products at 3000 m elevation from Indochina to Taiwan (over a distance around 2000–3000 km), which is strongly related not only to thermal but also dynamic processes. In particular, the presence of a lee-side trough provided the extra upward motion to lift the air pollutants to above 3000 m (Lin et al., Citation2009). a shows clearly the presence of a lee-side trough on 16 March while the weather condition before that is dominated by a high pressure system, as seen in b. This is one of the reasons accounting for the peak PM10 concentration at Lulin Mountain station on 17–18 March. Moreover, during the spin-up period (11–14 March), the weather condition was relatively stable under the influence of the high pressure system (b), which did not favour the transport of biomass-burning products over a long distance.
Fig. 12 Weather charts from Central Weather Bureau of Taiwan for geographic height of 850 hPa at 0000 UTC on (a) 16, (b) 12, and (c) 9 March.
An extended spin-up period starting from 9 March (2 d longer than the original design) (c) was adopted to identify the impact of initial atmospheric condition. The CO concentration level thus simulated (CO-Fd9, blue line in a) was closer to that observed at the LABS on 15–16 March. However, CO concentration showed insignificant change on 17–18 March. Other sensitivity tests were conducted for CO concentration with doubled biomass-burning emission and anthropogenic emission. Compared with the control run (CO-Ctrl, red line in a), these two simulations showed limited improvements. The test run of CO concentration with doubled biomass-burning emission (CO-bbmCO*2, green line in a) shows a direct impact on the CO concentration during 17–18 March, a two-fold increase compared with the control run. However, the test run with doubled anthropogenic emission (CO-anthCO*2, yellow line in a) yielded CO concentration similar to that of the control run. Hence, the underestimation of CO concentration on 15–16 March is most likely due to initial atmospheric condition. With the model spin-up period advanced to start from 9 March (PM10-Fd9, blue line in c), the underestimation of PM10 concentration on 15–16 March has been improved. Nevertheless, the improvement in O3 simulation (O3-Fd9 green line in b) is not as good as that in PM10; and the reason remains unclear. Emission might play a role for the underestimation. In general, the initial atmospheric condition during the spin-up period has significant effect on the simulation results for CO and PM10. The uncertainty of biomass-burning CO emission in FINNv1 data may also contribute to the underestimation.
Moreover, the above improvement is also observed in AOD simulation. When the model spin-up period was advanced to 2 d earlier, (i.e. starting from 9 March), the simulated AOD (Sim-Fd9 in ) was also significantly improved and approximated the AERONET data observed on 15–16 March. This change also evidences the important role of the lee-side trough over Indochina mentioned earlier. In spite of the improved simulated results for 15–16 March, the AOD simulation for 17–18 March at Chiang Mai station was still underestimated (). A possible reason is the uncertainty of emission estimation in FINNv1.
shows the geographical distributions of fire hotspots derived from MODIS data and PM10 emissions from FINNv1on 17 and 18 March. As can be seen, the number of fire hotspots surrounding Chiang Mai station is significantly greater on 18 March than on 17 March; while the amount of PM10 emissions during these 2 d are similar. Possible underestimation of biomass-burning emission around Chiang Mai might have led to a discrepancy in AOD simulation. CitationWiedinmyer et al. (2011) pointed out that the uncertainty of emission estimation could be as high as a factor of two because the use of fire hotspots, assumed area burned, land cover maps, biomass consumption estimates, and emission factors all introduce error into the model estimates.
Fig. 13 Geographical distributions of (left panel) fire hotspots derived from MODIS data and (right panel) PM10 emission data from FINNv1 on (a) 17 and (b) 18 March.
5. Impact of biomass-burning aerosols on AOD and DRF
With the proposed model capturing reasonably well the trend of PM10 variations at the LABS, this research further investigated individual biomass-burning aerosol components and their impacts on AOD and DRF over East Asia during the study period. The primary aerosol emitted from biomass burning contains organic carbon (OC) and BC (Levine et al., Citation1995; Liousse et al., Citation1996). During this fire event, OC contributed significantly to the aerosols over Indochina and AOD could reach as high as 0.8–1.0 around 15°N, 107°E and 22°N, 95°E (a). In contrast, the AOD of BC (b) is relatively small (<0.175) compared with that of OC. Owing to biomass burning, the AOD of both OC and BC are much higher in Indochina than in other regions. It is estimated that the ratio between OC and BC is about 5–6 at major fire hotspots in Indochina. Such difference in contribution of OC and BC to AOD is consistent with previous findings in the literature. For example, CitationLamarque et al. (2010) found an OC/BC ratio ranging from 5 to 10. Similarly, the ratio obtained from an emission inventory compiled by U.S. EPA (2005) during open biomass burning was 4.7. Wang et al. (Citation2007) also reported an OC/BC ratio of 6.5–8.0 over Indochina, India and South Asia.
Fig. 14 Contributions of (a) OC and (b) BC to simulated average AOD between 15 and 18 March, 2008.
shows the average DRF of aerosols at the top of atmosphere (TOA), ground surface (SFC) and in the atmosphere (ATM). It is obvious that biomass-burning aerosols affect RF not only over Indochina but also at the downwind areas such as southern China, Hong Kong and Taiwan. In this study the RF refers to the change in net irradiance at a certain atmospheric level with and without the effect of biomass-burning aerosols. The net radiative effect is the sum of SW and LW radiation as listed in . As can be seen, the calculated average differences in radiation fluxes simulated with and without biomass-burning emission over Indochina (95–110°E, 10–25°N) during the study period vary at different atmospheric levels. With biomass-burning emission, the average net radiative effect is negative (−4.74 W·m−2) at TOA, implying that the climate is likely to cool. It is also negative (−26.85 W·m−2)at SFC due to less radiative energy under the influence of biomass-burning aerosols. In contrast, the net RF at ATM, which is the difference between DRF at TOA and SFC, is positive (22.11 W·m−2), indicating an increase in radiative heating rate, averaged over the atmospheric column. The primary biomass-burning carbon aerosols (BC and OC) play important roles in the radiation budget. Wang et al. (Citation2007) indicated that solar absorption by BC within the atmospheric, which increases the radiative heating rate, leads to a significant reduction in solar radiation reaching the surface. On the other hand, OC enhances the reflected solar radiation at the TOA, leading to a cooling effect due to reduced incoming solar radiation to the atmosphere and ground surface. The net negative effect of biomass-burning aerosols at TOA is close to the observation over Lindenberg, Germany (−5.8 W·m−2) (Fiebig et al., Citation2002) and the simulated result in South Africa (−4.3 W·m−2) (Myhre et al., Citation2003). The simulated negative effect (−0.3 W·m−2) at TOA over Southeast Asia during TRACE-P by Wang et al. (Citation2007) was weaker than that obtained in this study.
Fig. 15 Average difference in net (SW + LW) radiation fluxes simulated with and without biomass-burning emission during 15–18 March, 2008 (unit: W·m−2) at (a) the top of atmosphere (TOA), (b) ground surface (SFC), and (c) in the atmosphere (ATM).
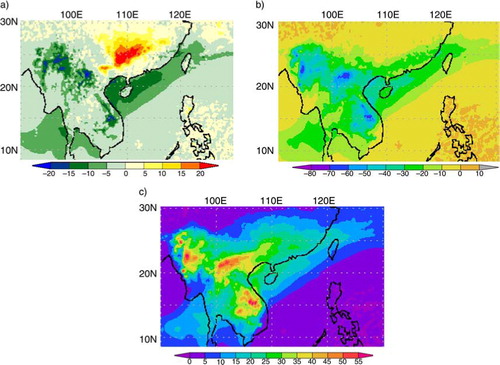
Table 1. Average difference in radiation fluxes simulated with and without biomass-burning emission over Indochina (95–110°E, 10–25°N) during 15–18 March, 2008 (unit W·m−2)
shows the atmospheric radiative absorption by BC. A positive absorption value indicates a warming effect in the atmosphere. BC has strong absorption capacity and results in an increase in atmospheric absorption of around 35–50 W·m−2 at major fire hotspots. The simulation results show that BC absorption () contributes about 80% of the total aerosol radiative absorption in the atmosphere (c). Although dust also has a significant warming effect, there is no significant dust event during the study period. The simulated radiative absorption by dust is less than 2 W·m−2 over East Asia (not shown). It is noteworthy that over Indochina, the simulated AOD of OC is five times more than that of BC while the simulated atmospheric radiative absorption is mainly dominated by BC (). Atmospheric radiation is absorbed mostly by carbonaceous aerosols, as widely discussed in previous reports. For example, Jacobson (Citation2001) found that accounting for internal mixing of BC in aerosols increases the estimated absorption and warming due to BC by a factor of two. Ramanathan and Carmichael (Citation2008) integrated AERONET results with satellite data and estimated that the RF of BC on the average global warming is 0.9 W·m−2 (range, 0.4–1.2 W·m−2), which has significant impact on climate. Recent studies have identified also the important contribution of radiative absorption by OC (brown carbon). CitationChung et al. (2012) estimated that the top-of-atmosphere RF of total carbonaceous aerosols on average global warming is 0.75±0.25 W·m−2, which is mainly attributed to absorption by BC. In this study, since absorption by OC (brown carbon) was not included in the model, the atmospheric absorption from biomass-burning aerosols might have been underestimated.
Fig. 16 Contributions of BC to simulated difference of net (SW + LW) radiation fluxes simulated with and without biomass-burning emission in the atmosphere between 15 and 18 March, 2008 (unit: W·m−2).
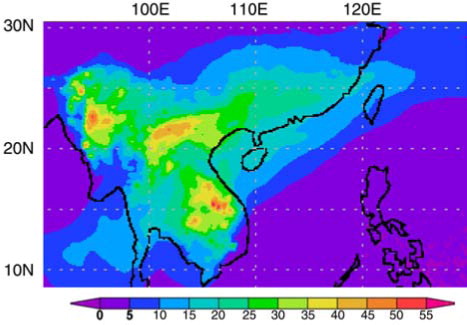
shows the reduction in SW radiation fluxes at SFC simulated with and without biomass-burning emission. As can be seen, such a reduction can reach as high as 80 W·m−2 in Indochina due to the high density of biomass-burning fires. Under the influence of biomass-burning aerosol plume transported by strong wind, there is a NE–SW zone stretching from southern China to Taiwan with a reduction in SW radiation of about 20 W·m−2 at SFC. Over Taiwan, the SW radiation fluxes at SFC can be reduced by 10–20 W·m−2. With the method for calculating the contribution of individual aerosol species to DRF, it was found that the contribution of BC (b) and OC (c) to the reduction in SW radiation fluxes at SFC was 50 and 25%, respectively. Other aerosol components, such as sulphate, nitrate ammonium, and unspeciated PM2.5 from unknown sources also contributed to the reduction of about 5, 4 and 16%, respectively, which was not shown here.
Fig. 17 (a) Average reduction in shortwave radiation fluxes at ground surface simulated with and without biomass-burning emission during 15–18 March, 2008 (unit W·m−2). Contributions of (b) BC and (c) OC to the values observed in (a).
The reduction in surface radiation or RF due to aerosols can be attributed to both absorption and scattering. The downward transmitted radiation fluxes at the SFC include both direct and diffuse radiative fluxes. Scattering and absorption both diminish the direct flux, but much of the flux is scattered forward to produce downward diffuse flux, while none of the absorbed flux is transmitted downward. Therefore, given the same AOD, absorbing aerosols generally reduce the downward diffuse solar radiative fluxes more efficiently than non-absorbing aerosols. Therefore, BC could cause a larger reduction in solar radiative fluxes at the SFC than OC, even though the AOD of BC is much smaller than that of OC.
6. Conclusions
This study analysed the seasonal variations of CO, O3 and PM10, which are related to biomass-burning emissions from Southeast Asia during the springtime (February–April) between 2006 and 2009. The concentrations of CO, O3 and PM10 observed at the LABS (elevation, 2862 m) were around 135–200 ppb, 40–56 ppb and 13–26 µg/m3, respectively. It was estimated that the concentrations of CO, O3 and PM10 at the LABS are 2–3 times higher during the biomass-burning season (spring) than in other seasons.
WRF-Chem simulations with biomass-burning emission data obtained from the FINNv1 inventory reasonably captured the PM10 and O3 concentration but underestimated CO concentration at the LABS during 17–18 March. During the study period, OC made significant contribution to the AOD over Indochina and reached as high as 0.8–1.0 in the biomass-burning areas (10°N–22°N and 95°E–107°E). Comparatively, the contribution of BC to AOD was minor. BC, the main warming aerosol species, had RF across the ATM as high as 35–50 W·m−2 at the fire hotspots. The AOD of OC was about five times greater than that of BC at major biomass-burning areas over Indochina. Overall, the average net radiative effect of biomass-burning aerosols over Indochina at TOA and SFC are negative (−4.74 W·m−2 and −26.85 W·m−2, respectively), which implies that the climate is likely to cool down and at the SFC is receiving less radiative energy. However, a positive net RF (22.11 W·m−2) in the ATM implies an increase in radiative heating rate, averaged over the atmospheric column. Furthermore, with biomass-burning aerosol plume transported by strong wind from Indochina, there is a narrow belt with a reduction in SW radiation of about 20 W·m−2 at SFC stretching from southern China, Hong Kong and to Taiwan. Biomass burning can last throughout the entire springtime in Southeast Asia; hence, its potentially significant impacts on the air quality and regional climate merit further study.
7. Acknowledgements
This work was financially supported by the National Science Council, Taiwan under grants NSC 99-2111-M-001-007-MY3 and NSC-101-2621-M-001-002. The authors gratefully acknowledge the NOAA Air Resources Laboratory (ARL) for the provision of the HYSPLIT transport and dispersion model and/or READY website (http://www.arl.noaa.gov/ready.html) used in this publication. Chun Zhao was partly supported by the Office of Science of the U.S. Department of Energy as part of the Regional and Global Climate Modeling Program. The Pacific Northwest National Laboratory is operated by Battelle Memorial Institute for the U.S. DOE under contract DE-AC05-76RL01830.
Related Research Data
References
- Ackermann I. J. , Hass H. , Memmesheimer M. , Ebel A. , Binkowski F. S. , co-authors . Modal aerosol dynamics model for Europe: development and first applications. Atmos. Environ. 1998; 32: 2981–2999.
- Andreae M. O. , Browell E. V. , Garstang M. , Gregory G. L. , Harriss R. C. , co-authors . Biomass-burning emissions and associated haze layers over Amazonia. J. Geophys. Res. Atmos. 1988; 93: 1509–1527.
- Barnard J. C. , Fast J. , Paredes-Miranda D. G. , Arnott W. P. , Laskin A . Technical note: evaluation of the WRF-Chem “Aerosol Chemical to Aerosol Optical Properties” module using data from the MILAGRO campaign. Atmos. Chem. Phys. 2010; 10: 7325–7340.
- Boschetti L. , Roy D. P. , Justice C. O . Using NASA's world wind virtual globe for interactive internet visualization of the global MODIS burned area product. Int. J. Remote Sens. 2008; 29: 3067–3072.
- Chan C. Y. , Chan L. Y. , Harris J. M. , Oltmans S. J. , Blake D. R. , co-authors . Characteristics of biomass burning emission sources, transport, and chemical speciation in enhanced springtime tropospheric ozone profile over Hong Kong. J. Geophys. Res. Atmos. 2003; 108: 4015.
- Cheng M. T. , Horng C. L. , Su Y. R. , Lin L. K. , Lin Y. C. , co-authors . Particulate matter characteristics during agricultural waste burning in Taichung City, Taiwan. J. Hazard. Mater. 2009; 165: 187–192.
- Christopher S. A. , Kliche D. V. , Chou J. , Welch R. M . First estimates of the radiative forcing of aerosols generated from biomass burning using satellite data. J. Geophys. Res. Atmos. 1996; 101: 21265–21273.
- Chu D. A. , Kaufman Y. J. , Ichoku C. , Remer L. A. , Tanre D. , co-authors . Validation of MODIS aerosol optical depth retrieval over land. Geophys. Res. Lett. 2002; 29
- Chung C.E. , Ramanathan V. , Decremer D . Observationally constrained estimates of carbonaceous aerosol radiative forcing. Proc. Natl. Acad. Sci. U S A. 2012; 109: 11624–11629.
- Crutzen P. J. , Andreae M. O . Biomass burning in the Tropics – impact on atmospheric chemistry and biogeochemical cycles. Science. 1990; 250: 1669–1678.
- Draxler R. R. , Hess G. D . An overview of the Hysplit-4 modelling system for trajectories, dispersion, deposition. Aust.Meteorol. Mag. 1998; 47: 295–308.
- Dubovik O. , Holben B. N. , Eck T. F. , Smirnov A. , Kaufman Y. J. , co-authors . Variability of absorption and optical properties of key aerosol types observed in worldwide locations. J. Atmos. Sci. 2002; 59: 590–608.
- Dubovik O. , Smirnov A. , Holben B. N. , King M. D. , Kaufman Y. J. , co-authors . Accuracy assessments of aerosol optical properties retrieved from AERONET sun and sky-radiance measurements. J. Geophys. Res. 2000; 105: 9791–9806.
- Dwyer E. , Gregoire J. M. , Malingreau J. P . A global analysis of vegetation fires using satellite images: spatial and temporal dynamics. Ambio. 1998; 27: 175–181.
- Fast J. D. , Gustafson W. I. Jr. , Easter R. C. , Zaveri R. A. , Barnard J. C. , co-authors . Evolution of ozone, particulates, and aerosol direct forcing in an urban area using a new fully-coupled meteorology, chemistry, and aerosol model. J. Geophys. Res. 2006; 111 D21305.
- Fiebig M. , Petzold A. , Wandinger U. , Wendisch M. , Kiemle C. , co-authors . Optical closure for an aerosol column: method, accuracy, and inferable properties applied to a biomass-burning aerosol and its radiative forcing. J. Geophys. Res. 2002; 107(D21): 8130.
- Fu J. S. , Hsu N. C. , Gao Y. , Huang K. , Li C. , co-authors . Evaluating the influences of biomass burning during 2006 BASE-ASIA: a regional chemical transport modelling. Atmos. Chem. Phys. 2012; 12: 3837–3855.
- Giglio L. , Csiszar I. , Justice C. O . Global distribution and seasonality of active fires as observed with the Terra and Aqua Moderate Resolution Imaging Spectroradiometer (MODIS) sensors. J. Geophys. Res-Biogeo. 2006a; 111 G02016.
- Giglio L. , van der Werf G. R. , Randerson J. T. , Collatz G. J. , Kasibhatla P . Global estimation of burned area using MODIS active fire observations. Atmos. Chem. Phys. 2006b; 6: 957–974.
- Grell G. , Freitas S. R. , Stuefer M. , Fast J . Inclusion of biomass burning in WRF-Chem: impact of wildfires on weather forecasts. Atmos. Chem. Phys. 2011; 11: 5289–5303.
- Grell G. A. , Peckham S. E. , Schmitz R. , McKeen S. A. , Frost G. , co-authors . Fully coupled “online” chemistry within the WRF model. Atmos. Environ. 2005; 39: 6957–6975.
- Holben B. N. , Eck T. F. , Slutsker I. , Tanré D. , Buis J. P. , co-authors . AERONET – a federated instrument network and data archive for aerosol characterization. Rem. Sens. Environ. 1998; 66: 1–16.
- Holben B. N. , Tanré D , Smirnov A. , Eck T. F. , Slutsker I. , co-authors . An emerging ground-based aerosol climatology: aerosol optical depth from AERONET. J. Geophys. Res. 2001; 106(D11): 12067–12097.
- Ichoku C. , Kaufman Y. J. , Giglio L. , Li Z. , Fraser R. H. , co-authors . Comparative analysis of daytime fire detection algorithms using AVHRR data for the 1995 fire season in Canada: perspective for MODIS. Int. J. Remote Sens. 2003; 24: 1669–1690.
- IPCC, 2007. Climate change 2007: Impacts, adaptation and vulnerability. Rep., Contribution of Working Group II to the Fourth Assessment Report of the Intergovernmental Panel on Climate Change . Cambridge, UK: Cambridge University Press.
- Jaffe D. , Bertschi I. , Jaegle L. , Novelli P. , Reid J. S. , co-authors . Long-range transport of Siberian biomass burning emissions and impact on surface ozone in western North America. Geophys. Res. Lett. 2004; 31 L16106.
- Jacobson M . Global direct radiative forcing due to multicomponent anthropogenic and natural aerosols. J. Geophys. Res. 2001; 106: 1551–1568.
- Kasischke E. S. , Hewson J. H. , Stocks B. , van der Werf G. , Randerson J . The use of ATSR active fire counts for estimating relative patterns of biomass burning – a study from the boreal forest region. Geophys. Res. Lett. 2003; 30(18): 1969.
- Lamarque J.-F. , Bond T.C. , Eyring V. , Granier C. , Heil A. , co-authors . Historical (1850–2000) gridded anthropogenic and biomass burning emissions of reactive gases and aerosols: methodology and application. Atmos. Chem. Phys. 2010; 10: 7017–7039.
- Levine J. S. , Cofer W. R. , Cahoon D. R. , Winstead E. L . Biomass burning: a driver for global change. Environ. Sci. Tech. 1995; 29(3): 120A–125.
- Li T. C. , Wu C. Y. , Chen W. H. , Yuan C. S. , Wu S. P. , co-authors . Diurnal variation and chemical characteristics of atmospheric aerosol particles and their source fingerprints at Xiamen Bay. Aerosol. Air Qual. Res. 2013; 13: 596–607.
- Lin C. Y. , Chang C. C. , Chan C. Y. , Kuo C. H. , Chen W. C. , co-authors . Characteristics of springtime profiles and sources of ozone in the low troposphere over northern Taiwan. Atmos. Environ. 2010; 44: 182–193.
- Lin C. Y. , Hsu H. M. , Lee Y. H. , Kuo C. H. , Sheng Y. F. , co-authors . A new transport mechanism of biomass burning from Indochina as identified by modeling studies. Atmos. Chem. Phys. 2009; 9: 7901–7911.
- Lin N. H. , Tasy S.C. , Reid J.S. , Yen M.C. , Sheu G. R. , co-authors . An overview of regional experiments on biomass burning aerosols and related pollutants in Southeast Asia: from BASE-ASIA and Dongsha Experiment to 7-SEAS. Atmos. Environ. 2013; 78: 1–19.
- Liousse C. , Penner J. E. , Chuang C. , Walton J. J. , Eddleman H. , co-authors . A global three-dimensional model study of carbonaceous aerosols. J. Geophys. Res. 1996; 101(D14): 19411–19432.
- Liu H. Y. , Chang W. L. , Oltmans S. J. , Chan L. Y. , Harris J. M . On springtime high ozone events in the lower troposphere from Southeast Asian biomass burning. Atmos. Environ. 1999; 33: 2403–2410.
- Martonchik J. V. , Diner D. J. , Kahn R. , Gaitley B. , Holben B. N . Comparison of MISR and AERONET aerosol optical depths over desert sites. Geophys. Res. Lett. 2004; 31 L16102.
- Morrison H. , Curry J. A. , Khvorostyanov V. I . A new double-moment microphysics parameterization for application in cloud and climate model. Part I: description. J. Atmos. Sci. 2005; 62: 1665–1676.
- Myhre G. , Berntsen T. K. , Haywood J. M. , Sundet J. K. , Holben B. N. , co-authors . Modeling the solar radiative impact of aerosols from biomass burning during the Southern African Regional Science Initiative (SAFARI-2000) experiment. J. Geophys. Res. 2003; 108(D13): 8501.
- Oanh N. T. K. , Ly B. T. , Tipayarom D. , Manandhar B. R. , Prapat P. , co-authors . Characterization of particulate matter emission from open burning of rice straw. Atmos. Environ. 2011; 45: 493–502.
- Ramanathan V. , Carmichael G . Global and regional climate changes due to black carbon. Nat. Geosci. 2008; 1: 221–227.
- Ramanathan V. , Crutzen P. J . New directions: atmospheric brown “Clouds.”. Atmos. Environ. 2003; 37: 4033–4035.
- Ramanathan V. , Crutzen P. J. , Kiehl J. T. , Rosenfeld D . Atmosphere – aerosols, climate, and the hydrological cycle. Science. 2001; 294: 2119–2124.
- Ramanathan V. , Ramana M. V. , Roberts G. , Kim D. , Corrigan C. , co-authors . Warming trends in Asia amplified by brown cloud solar absorption. Nature. 2007; 448: 575–U575.
- Reid J. S. , Hyer E. J. , Johnson R. S. , Holben B. N. , Yokelson R. J. , co-authors . Observing and understanding the Southeast Asian aerosol system by remote sensing: an initial review and analysis for the Seven Southeast Asian Studies (7SEAS) program. Atmos. Res. 2013; 122: 403–468.
- Remer L. A. , Kaufman Y. J. , Tanré D. , Mattoo S. , Chu D. A. , co-authors . The MODIS aerosol algorithm, products, and validation. J. Atmos. Sci. 2005; 62(4): 947–973.
- Ryu S. Y. , Kwon B. G. , Kim Y. J. , Kim H. H. , Chun K. J . Characteristics of biomass burning aerosol and its impact on regional air quality in the summer of 2003 at Gwangju, Korea. Atmos. Res. 2007; 84: 362–373.
- Schell B. , Ackermann I. J. , Hass H. , Binkowski F. S. , Ebel A . Modeling the formation of secondary organic aerosol within a comprehensive air quality model system. J. Geophys. Res. Atmos. 2001; 106: 275–28. 293.
- Skamarock W. C. , Klemp J. B. , Dudhia J. , Barker D. M. , Duda M. G. , co-authors . 2008. A Description of the Advanced Research WRF Version 3. NCAR Tech. Note, NCAR/TN-475+STR, 8 pp. Natl. Cent. Atmos. Res. Boulder, CO, USA.
- Stockwell W. R. , Middleton P. , Chang J. S. , Tang X. Y . The 2nd generation regional acid deposition model chemical mechanism for regional air-quality modeling. J. Geophys. Res. Atmos. 1990; 95: 16343–16367.
- U.S. National Emissions Inventory data and documentation, CHIEF website. Online at http://www.epa.gov/ttn/chief/net/2005inventory.html .
- Tian D. , Hu Y. T. , Wang Y. H. , Boylan J. W. , Zheng M. , co-authors . Assessment of biomass burning emissions and their impacts on urban and regional PM2.5: a Georgia case study. Environ. Sci. Technol. 2009; 43: 299–305.
- Tripathi S. N. , Dey S. , Chandel A. , Srivastava S. , Singh R. P. , co-authors . Comparison of MODIS and AERONET derived aerosol optical depth over the Ganga Basin, India. Ann. Geophys. 2005; 23: 1093–1101.
- van der Werf G. R. , Randerson J. T. , Giglio L. , Collatz G. J. , Kasibhatla P. S. , co-authors . Interannual variability in global biomass burning emissions from 1997 to 2004. Atmos. Chem. Phys. 2006; 6: 3423–3441.
- Wang S. H. , Lin N. H. , Chou M. D. , Woo J. H . Estimate of radiative forcing of Asian biomass burning aerosols during the period of TRACE-P. J. Geophys. Res. Atmos. 2007; 112 D10222.
- Wiedinmyer C. , Akagi S. K. , Yokelson R. J. , Emmons L. K. , Al-Saadi J. A. , co-authors . The Fire INventory from NCAR (FINN): a high resolution global model to estimate the emissions from open burning. Geosci. Model Dev. 2011; 4: 625–641.
- Yen M. C. , Peng C. M. , Chen T. C. , Chen C. S. , Lin N. H. , co-authors . Climate and weather characteristics in association with the active fires in northern Southeast Asia and spring air pollution in Taiwan during 2010 7-SEAS/Dongsha. Exp. Atmos. Environ. 2013; 78: 35–50.
- Zhang Q. , Streets D. G. , Carmichael G. R. , He K. B. , Huo H. , co-authors . Asian emissions in 2006 for the NASA INTEX-B mission. Atmos. Chem. Phys. 2009; 9: 5131–5153.
- Zhao C. , Leung L. R. , Easter R. , Hand J. , Avise J . Characterization of speciated aerosol direct radiative forcing over California. J. Geophys. Res-Atmos. 2013; 118: 2372–2238.
- Zhao C. , Liu X. , Leung L. R. , Johnson B. , McFarlane S. A. , co-authors . The spatial distribution of mineral dust and its shortwave radiative forcing over North Africa: Modeling sensitivities to dust emissions and aerosol size treatments. Atmos. Chem. Phys. 2010; 10: 8821–8838.
- Zhao C. , Liu X. , Leung L. R. , Hagos S . Radiative impact of mineral dust on monsoon precipitation variability over West Africa. Atmos. Chem. Phys. 2011; 11: 1879–1893.