
Abstract
Non-dispersive infrared CO2/H2O gas analysers produce erroneous CO2 outputs when CO2 is measured in humid air, unless a correction for water vapour cross-sensitivity is applied. Spectroscopic cross-sensitivities arising from direct absorption interference and from the pressure broadening effect are significant in CO2 flux measurements by the eddy covariance technique using open-path gas analysers over the ocean, as opposed to land-surface measurements, where CO2 fluxes are orders of magnitude larger. In this study, a widely used analyser with manufacturer-determined correction coefficients for both cross-sensitivities was tested by laboratory experiments. Our results showed that the correction coefficient for direct absorption interference was not optimised to calculate CO2 flux accurately, and that the correction coefficient for the pressure broadening caused overestimation of the CO2 mixing ratio flux in the same direction as the water vapour flux. Overestimations of open-path eddy covariance measurements of upward CO2 fluxes in previous ocean observations probably resulted from inaccuracies in both of these correction coefficients. We also found that slight changes in spectroscopic cross-sensitivities due to contamination of the analyser's optical windows by sea salt caused a low bias in CO2 outputs with increasing H2O; however, this contamination effect was not always observed in repeated tests under different contamination conditions. We suggest that previously proposed methods for correcting the effect of optical window contamination is of limited value and that measurement of small CO2 fluxes by the open-path eddy covariance technique over the ocean should be performed after confirming the spectroscopic cross-sensitivity and ensuring that the optical windows are as clean as possible.
1. Introduction
Micrometeorological techniques are capable of the most reliable flux measurements of momentum, sensible heat, latent heat and several trace gases (e.g. CO2, CH4 and CO) over various surfaces. The most direct of these measurements are made by the eddy covariance technique, which has been applied successfully to evaluate CO2 fluxes over terrestrial ecosystems (Baldocchi, Citation2003) since the development of fast-response, non-dispersive infrared gas analysers (IRGAs) for simultaneously measuring CO2 and H2O fluctuations (Ohtaki and Matsui, Citation1982). The CO2 flux over the ocean has also been measured using this technique; however, the result has been shown to be approximately one order of magnitude larger than the bulk CO2 flux estimated using gas transfer velocity evaluated by the mass balance technique (Ohtaki et al., Citation1989; Smith et al., Citation1991; Jacobs et al., Citation1999; Kondo and Tsukamoto, Citation2007, Citation2012; Else et al., Citation2011; Lauvset et al., Citation2011).
The eddy covariance technique measures the turbulent CO2 flux as
where ρ d is the dry air density, w is the vertical wind velocity and r c is the mixing ratio of CO2. The prime symbol indicates the fluctuation as a deviation from the mean value (overbar) over a sampling period. An inherent difficulty of this technique in CO2 flux measurements over the ocean is that turbulent fluctuations of the CO2 mixing ratio are several orders of magnitude smaller than over land. Therefore, a slight bias in CO2 fluctuation measurements leads to large deviations in the eddy covariance CO2 flux over the ocean, so that IRGAs with high accuracy and precision are required. For the past 20 yr, commercially available IRGAs such as the LI-6262, LI-7000 and LI-7500 (LI-COR Inc., Lincoln, NE, USA) have been widely used as the de facto standard for measuring CO2 fluxes by the eddy covariance technique. The LI-6262 and LI-7000 are dual-path, single-wavelength IRGAs used for closed-path measurements, whereas the LI-7500 is a single-path, dual-wavelength IRGA used for open-path measurements (Welles and McDermitt, Citation2005). Recently, an enclosed-path IRGA (LI-7200) with the same design as the LI-7500 has been developed to minimise the weaknesses of these older IRGAs (Burba et al., Citation2010).
The biases associated with these IRGAs in eddy covariance CO2 flux measurements are caused by spectroscopic cross-sensitivity due to simultaneous fluctuation of H2O and CO2 (Kohsiek, Citation2000; Edson et al., Citation2011), zero drifts due to contamination of the optical window (Serrano-Ortiz et al., Citation2008), gyroscopic effects on the chopper wheel in the IRGA caused by water vapour-induced motion (McGillis et al., Citation2001) and hydrostatic effects arising from vertical motion induced by ship heave (Miller et al., Citation2010). Open-path IRGAs such as the LI-7500 suffer especially from the spectroscopic cross-sensitivity due to H2O.
There are two spectroscopic cross-sensitivities due to H2O on CO2 measurements (Burch et al., Citation1962; McDermitt et al., Citation1993). One is the pressure broadening effect, which is the Lorentzian broadening (or narrowing) of the CO2 absorption spectral lines due to variation in coexisting H2O in the sample air; the other is direct absorption interference resulting from the overlap of CO2 and H2O absorption features at the wavelength band centred at 4.26 µm used for CO2 measurements. These cross-sensitivities cause the apparent CO2 mixing ratio to increase with increasing H2O mole fraction. It is important to note that these cross-sensitivities affect the measurement of not only the absolute CO2 value but also the CO2 fluctuation, because the turbulent fluctuations of CO2 and H2O are correlated with each other, as expected from the similarity law. Therefore, the spectroscopic cross-sensitivities cause systematic biases in the eddy covariance CO2 flux.
Hupp (Citation2011) suggested that the pressure broadening effect is universal among the same type of IRGAs and that the direct absorption interference is substantially smaller than the pressure broadening effect. For these reasons, spectroscopic cross-sensitivity is generally regarded as not a critical issue for eddy covariance flux measurements, and attempts to confirm the correction coefficients for these cross-sensitivities supplied by IRGA manufacturers have not been reported. LI-COR users have generally used the default values supplied by the manufacturer. However, Edson et al. (Citation2011) suggested that these default correction coefficients are problematic for evaluating extremely small CO2 fluxes (and fluctuations) over the ocean by the eddy covariance technique.
Another important issue is the effects of contamination on the optical windows of open-path IRGAs. In laboratory tests of the IRGA constructed by the National Oceanic and Atmospheric Administration, Kohsiek (Citation2000) concluded that the apparent decrease of CO2 mixing ratios with increasing relative humidity might be caused by a thin film of liquid water adhering to the optical windows. Prytherch et al. (Citation2010) also found that the CO2 mixing ratio fluctuation measured by the LI-7500 in in-situ ocean observations acquired a low bias with increasing fluctuation in relative humidity and suggested that this bias could be attributed to the contamination of the IRGA optical windows by hygroscopic sea salt particles. That is, both studies noted that the water vapour–induced bias (which they referred to as cross-sensitivity) of the measured CO2 mixing ratio is an effect of optical window contamination. Recent studies have suggested that long-known conflicts between the CO2 fluxes determined by eddy covariance and mass balance techniques are associated with window contamination in addition to spectroscopic cross-sensitivity (Kohsiek, Citation2000; Prytherch et al., Citation2010; Edson et al., Citation2011; Duan et al., Citation2013). However, the contamination effect noted by Prytherch et al. (Citation2010) may cause significant downward bias in the CO2 flux measured by the eddy covariance technique, whereas spectroscopic cross-sensitivities cause an increase in the apparent CO2 mixing ratio with increasing H2O mole fraction. Furthermore, the exact sources of optical window contamination in in-situ ocean observations are still unclear.
In this study, we examined whether the apparent CO2 mixing ratio detected by a single-path, dual-wavelength IRGA of the open-path model is appropriately corrected using the manufacturer's correction coefficients for spectroscopic cross-sensitivities. We also investigated the contamination effects caused by sea salt on the optical windows of the IRGA in laboratory tests.
2. Methods
2.1. Theory
In this study, we used the single-path, dual-wavelength model LI-7200 IRGA (LI-COR, Inc., Lincoln, NE). Although the open-path LI-7500 model is otherwise suitable for investigating the effects of contamination on optical windows, the tube used for introducing the gas with known CO2 concentration cannot be physically inserted into the sensor head without making contact with a contaminated optical window in test of the contamination effects. We used the CO2 mixing ratio from the LI-7200 for investigating the manufacturer's correction coefficients for the pressure broadening effect and direct absorption interference. The CO2 mixing ratio is unaffected by the dilution effects of temperature, pressure and H2O. Therefore, we converted the raw CO2 density outputs from the LI-7200 to the CO2 mixing ratios by the ideal gas law, using the simultaneously measured temperature and pressure with CO2 and H2O densities in the sample air.
Because the detailed principles of this type of IRGA are described elsewhere (Welles and McDermitt, Citation2005; Burba et al., Citation2010), only a brief explanation of the spectroscopic cross-sensitivities due to the pressure broadening effect and direct absorption interference is given here.
2.1.1. Pressure broadening effect
The CO2 mole density (ρ
c
) measured by an IRGA following the scaling law of Jamieson et al. (Citation1963) is given by the following equation:1
In this equation, α
c
is the CO2 absorptance:2
which is calculated from the powers received from the sources at absorbing (A
c
) and non-absorbing (A
c0, as a reference) wavelengths for CO2. The calibration function f
c
is an individual fifth-order polynomial fitting function that is determined by the LI-COR factory calibration procedure using a series of standard gases with CO2 mixing ratios ranging from 0 to 3000 ppm (LI-COR, Citation2010). The determined coefficients should be valid for several years. f
c
is determined by measuring the range of known CO2 mixing ratios and fitting a curve to plotted against
. P
ec
is the equivalent (effective) pressure for correcting the pressure broadening effect in theory, which is potentially different from the total pressure (P
a
) in the sample air. Because H2O is the most variable gas component, for its measurements in moist air P
ec
can be written as
3
where a w is the coefficient of the pressure broadening effect for H2O on CO2, and q w is the H2O mole fraction. Note that the pressure broadening effect causes an increase in the apparent CO2 mixing ratio with increasing H2O mole fraction. Theory suggests that a w should be constant among the same IRGA models and that any discrepancy should result from differences in the optical design employed in different IRGAs. In laboratory tests, Hupp (Citation2011) found that a w is unique to each type of IRGA, being 1.15 for models LI-7200 and LI-7500 and 1.57 for models LI-6262 and LI-7000.
2.1.2. Direct absorption interference
CO2 absorptance is not correctly described by eq. (2) in humid air because H2O gas absorbs infrared radiation in the same region of the spectrum used for detecting CO2 absorptance. Therefore, an IRGA designed to measure CO2 and H2O needs another correction. To account for this cross-sensitivity due to direct absorption in the measurements between CO2 and H2O, a new term is added to eq. (2) as follows:4
where A w and A w0 are the powers received from the sources at absorbing and non-absorbing wavelengths for H2O, and X wc is the correction coefficient of direct absorption interference for H2O on CO2. Both the direct absorption interference and the pressure broadening effect cause overestimation of the CO2 mixing ratio when H2O is present. To account for direct absorption interference, each analyser is characterised with an individual correction coefficient during the LI-COR factory calibration procedure. Because direct absorption interference is independent of the CO2 mixing ratio, this interference at ambient CO2 levels is much smaller than the pressure broadening effect (Hupp, Citation2011).
In this study, direct absorption interference for CO2 in eq. (4) was determined by humidifying a CO2-free, air-based gas because the pressure broadening effect at 0 CO2 concentration is considered to be negligible. After applying the correction for direct absorption interference, we determined the pressure broadening effect in eq. (3) from the residual CO2 mixing ratio in an air-based gas with known CO2 mixing ratio.
2.2. Experimental setup
We conducted H2O experiments with a model LI-7200 IRGA (serial number 72H-0361) using the humidification system shown schematically in . This system was constructed to evaluate the H2O correction functions for CO2 and CH4 mixing ratios detected by cavity ring down spectroscopy (Rella et al., Citation2013). We prepared two test gases: a compressed natural dry air with a known CO2 mixing ratio (403.7 ppm CO2) to investigate the pressure broadening effect, and a compressed dry, CO2-free, purified air-based gas (CO2 zero gas) to investigate the direct absorption interference. Before these compressed gases were introduced into the LI-7200, they were split into two paths, one without and one with a dew point generator (model LI-610, LI-COR, Inc., Lincoln, NE) to humidify the sample gas with deionised water. This was done to set each target H2O mole fraction (from 0 to almost 30 mmol mol−1) in the sample gas. The range of target H2O mole fractions (up to about 26°C dew point) mostly covered the range found in the troposphere. To avoid CO2 drift due to changes in the solubility of CO2 in the water pool of the dew point generator, the LI-610 water temperature was kept constant at 26.0±0.2°C by a series of Peltier thermoelectronic coolers. The tests were done in a temperature-controlled room (~29°C) to prevent water vapour or liquid water from condensing on the tube walls before flowing into the LI-7200.
Fig. 1 Schematic setup for testing water vapour cross-sensitivity. Compressed sample gas is supplied to the LI-7200 IRGA after adjustment of the water vapour mole fraction with or without a dew point generator and then passing or not passing through a two-step dehumidification unit consisting of an electric cooler and a chemical trap. The ‘zero gas’ refers to sample gas with no CO2. See text for more details.
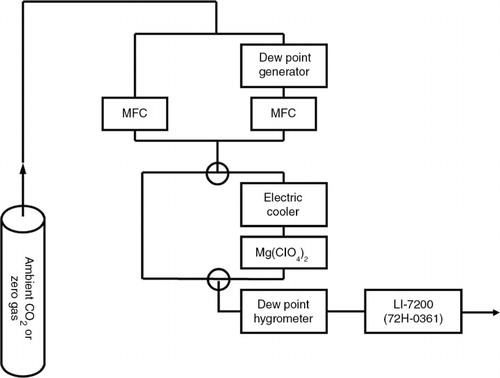
The H2O mole fraction in the sample gas was adjusted by controlling the flow rates of the gases with two thermal mass flow controllers (model SEC-E40, Horiba STEC, Inc., Kyoto, Japan) and was also checked by a chilled-mirror dew point hygrometer (model DPH-503B, Tokyo Opto-Electronics Co., Ltd., Tokyo, Japan). The measurement precision of the LI-7200 10 Hz raw output for the H2O mole fraction in the humidified sample gas was below 0.02 mmol mol−1 (1σ) at the 3.0% level. This level of precision would not affect the typical measurement precision of the CO2 (±0.04 ppm at 0 ppm CO2 or ±0.09 ppm at 403.7 ppm CO2), which is almost the same as that in the dry sample gas. It was therefore precise enough for our purposes. The humidified sample gas was introduced for 30 minutes to the next stage with or without passing through a two-step dehumidification unit. This consisted of an electric cooler (model DH-109, Komatsu Electronics Inc., Kanagawa, Japan) and a chemical trap filled with magnesium perchlorate (20/48 mesh, Wako Pure Chemical Industries, Osaka, Japan), making the dew point of the humid sample gas lower than −50°C. We confirmed that there was no significant difference within the measurement precision between the CO2 mixing ratio in the dehumidified sample gas and that in the original dry sample gas. Finally, the humidified and dehumidified sample gases were alternately supplied to the LI-7200 at 0.5 L min−1.
For tests of optical window contamination, seawater was sprayed on the windows of the LI-7200. After spraying, the AGC (automatic gain control) value, representing the ‘clean window’ baseline value, reached the maximum limit (100%) as the seawater adhered on the windows. When the seawater had evaporated, leaving crystals or a film of sea salt on the optical windows, the AGC value remained constant during each test.
3. Results and discussions
3.1. Test of direct absorption interference
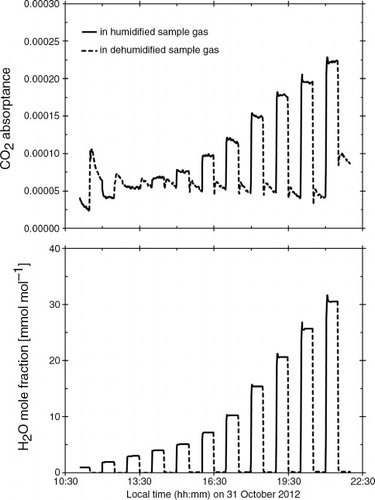
We first tested the cross-sensitivity due to direct absorption interference in eq. (4) by humidifying the dry CO2 zero gas. shows an example of the CO2 absorptances in the presence of H2O mole fractions in the humidified and dehumidified sample gas. In this test, the CO2 absorptance, taken as the raw CO2 output from the IRGA, clearly responded to H2O in the humidified sample gas during half of each humidity cycle, as indicated by the large difference between CO2 absorptances in the highly humidified and dehumidified sample gases.
Fig. 2 Time-series example of the CO2 absorptances (upper) with H2O mole fractions (lower) in humidified (solid lines) and dehumidified (dotted lines) CO2 zero sample gas detected by the LI-7200 IRGA. The CO2 absorptance was corrected using the value of X wc supplied by the manufacturer. All data are plotted as 1-minute averaged values from 10 Hz raw data.
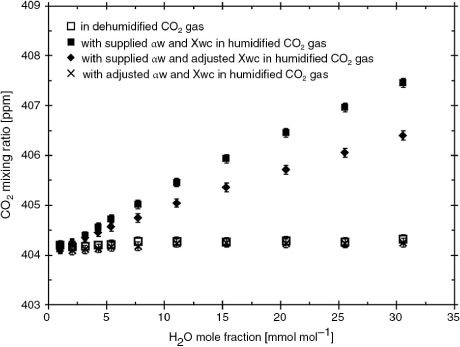
As shown in , errors in the outputs of the CO2 mixing ratio and CO2 absorptance were attributed to the cross-sensitivity due to direct absorption interference in eq. (4). The differences between the CO2 mixing ratios without the correction coefficient X wc in the humidified and dehumidified sample gases substantially increased with increasing H2O mole fraction, up to 0.3 ppm at 30.6 mmol mol−1 H2O. We also confirmed the differences between the CO2 outputs corrected with the manufacturer's X wc (−0.0007) in the humidified and dehumidified gas. Therefore, we conclude that these differences can be attributed to inadequate cross-sensitivity correction for direct absorption interference supplied by the manufacturer. As H2O changed, the errors arising from the manufacturer's X wc value increased up to 0.8 ppm for a rate of 0.04–0.05 µmol CO2 per mmol H2O (). These errors were very small in terms of absolute CO2 values, amounting to a systematic error of 0.2% for the measurement of mean CO2 mixing ratio in 3.0% humid air with 400 ppm CO2 at ambient levels. If the corrected CO2 mixing ratio in the humidified gas is closely adjusted to the CO2 outputs in the dehumidified gas over all H2O mole fractions, our tests indicate that the X wc should be 0.001 instead of −0.0007.
Fig. 3 Example of CO2 mixing ratio outputs in CO2 zero gas as a function of H2O mole fraction: dehumidified gas (□), humidified gas without the correction coefficient X wc (♦), humidified gas with X wc value supplied by the manufacturer (▪) and humidified gas with the X wc value adjusted in this study (×). This study adjusted the value of X wc such that the corrected CO2 outputs with X wc were almost the same as the CO2 outputs with dehumidified gas. Mixing ratio outputs were calculated as average values over a period of 3 minutes after the raw signals from the LI-7200 were stabilised.
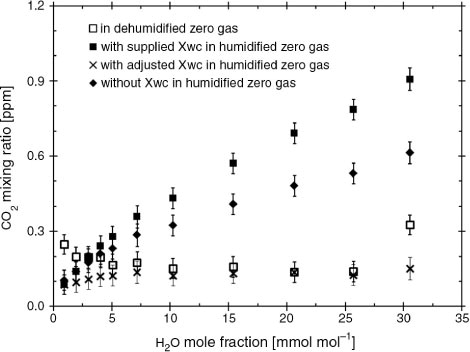
The CO2 outputs in the dehumidified sample gas were constant within typical measurement precision (±0.04 ppm CO2 in CO2 zero gas), with the exception of instrumental drift at the highest humidity, as shown in . The CO2 outputs in the humidified sample gas were also lower than the CO2 outputs in the dehumidified gas at levels below 3 mmol mol−1 H2O. The main cause for this was that gas containing CO2 could not be completely removed from the chemical dehumidification trap at the beginning of the measurement periods for CO2 zero gas. These results showed that the CO2 mixing ratio in the water of the dew point generator kept coming into equilibrium with the (zero) CO2 in the entering gas stream during the tests, and thus instrumental drift should not become a serious issue for this test.
compares the effects of cross-sensitivity due to direct absorption interference as a function of H2O mole fraction for five single-path, dual-wavelength LI-COR IRGAs, of which four were model LI-7500s and one was a model LI-7200 (specifications in ). The effect of H2O change on the IRGA (75H-0140) with the highest X wc (0.153) was 14 times that for the LI-7200 IRGA (72H-0361), and its rate of change with humidity ranged from 0.2 to 0.5 µmol CO2 per mmol H2O. Among these IRGAs, the one tested for this study had the smallest effect from cross-sensitivity due to direct absorption interference.
Fig. 4 Examples of effects of cross-sensitivity due to direct absorption interference as a function of H2O mole fraction, using single-path, dual-wavelength IRGAs listed in . The CO2 mixing ratios of all IRGAs calculated without any correction show several biases, with the assumption that the constant CO2 mixing ratio (400 ppm) is calculated for the changes of H2O mole fractions when all IRGAs are corrected by their individual values of X wc .
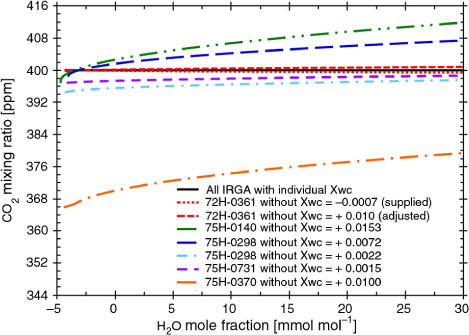
Table 1. Correction coefficients for cross-sensitivity due to direct absorption of CO2 due to H2O (X wc ) and zero factors and span adjustment terms for CO2 (Z c and S c ) and H2O (Z w and S w ) for the listed IRGAs in
In addition to accuracy, it is desirable that the coefficient of spectroscopic cross-sensitivity be stable over time. Users of LI-COR IRGAs generally do not confirm these values before and after observations on the assumption that they remain stable after factory calibration. However, the X wc of one IRGA (75H-0298) changed markedly, from 0.0072 to 0.0022, between calibrations by the manufacturer in 2002 and 2006 (). Therefore, we suggest that eddy covariance users should confirm the value of X wc before and after observations of long-term eddy covariance CO2 fluxes, especially in IRGAs for which a large value of X wc has been determined by the manufacturer.
3.2. Test of pressure broadening effect
We tested the cross-sensitivity due to the pressure broadening effect in eq. (3) by humidifying an ambient air-based gas with known CO2 mixing ratio (403.7 ppm). As shown in , the CO2 outputs in the dehumidified sample gas over the whole H2O range were relatively constant, within typical measurement precisions (±0.09 ppm at 403.7 ppm CO2). However, the CO2 outputs corrected using both values of the manufacturer's a w and the adjusted X wc presented in Section 3.1 were higher than the CO2 outputs in the dehumidified gas. This result implies that the manufacturer's value of a w (1.15) for the pressure broadening effect is too low for IRGAs of single-path, dual-wavelength type. Also, the differences between the CO2 outputs in humidified gas corrected with the manufacturer's a w and X wc values and the CO2 outputs in the dehumidified gas drastically increased with increasing H2O, and the absolute errors increased to a 3.6 ppm bias in CO2 levels due to H2O at 30.6 mmol mol−1 H2O. These values greatly exceeded the measurement precisions, and they caused a systematic error of 0.9%. Furthermore, the errors arising from the manufacturer-supplied values changed with rising humidity from 0.1 to 0.2 µmol CO2 per mmol H2O. This bias has almost the same magnitude as the net turbulent fluctuation of the CO2 mixing ratio observed over the ocean in previous studies (Kondo and Tsukamoto, Citation2007, Citation2012). If the CO2 mixing ratio outputs from the LI-7200 IRGA are closely adjusted to the CO2 outputs in the dehumidified gas for all H2O mole fractions in this study, the a w value should be 1.78 instead of the manufacturer's value of 1.15, as shown in .
Fig. 5 Example of CO2 mixing ratio outputs in ambient (403.7 ppm) CO2 gas as a function of H2O mole fraction: dehumidified gas (□), humidified gas with the manufacturer's values of a w (1.15) and X wc (−0.0007) (▪), humidified gas with the manufacturer's a w and adjusted X wc (0.001) values (♦), and humidified gas with adjusted values of X wc and a w from this study (×). The adjusted value of a w (1.78) was determined so that the CO2 output in humidified gas was almost the same as the CO2 output with dehumidified gas. The adjusted value of X wc was determined in Section 3.1.
Our tests showed that the spectroscopic cross-sensitivity due to the pressure broadening effect in a widely used open-path IRGA caused overestimates of the CO2 mixing ratio flux in direct relation to the water vapour flux, even using the manufacturer's correction coefficients. Possible reasons for this result are that the correction coefficient was determined to a precision of ±1 ppm CO2 from the differences between corrected and actual values over a range of CO2 mixing ratios (0–1100 ppm). In contrast, we precisely determined this coefficient only when the difference between corrected and actual values at ambient CO2 and H2O levels fell within the typical precision of instrumental measurements (±0.09 ppm CO2 as the noise in the LI-7200 10 Hz output) when processing gas with CO2 mixing ratio (403.7 ppm) found in the atmosphere. Our experimental results also show that the manufacturer's correction coefficient for direct absorption interference yields insufficiently accurate CO2 mixing ratios. Adopting both of these correction coefficients as default values causes significant biases in eddy covariance CO2 fluxes of small magnitude.
3.3. Tests of optical window contamination effects
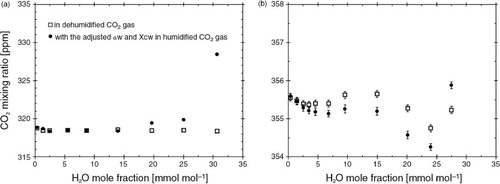
We tested whether the contamination effects of sea salt on the optical windows of the LI-7200 IRGA caused water vapour–induced biases of CO2 mixing ratio outputs by humidifying a sample gas based on natural air with known CO2 mixing ratio (401.1 ppm). shows two examples of results under different contamination conditions of optical windows. In both tests, the whitish films of sea salt on the windows differed noticeably in colour, although the AGC values were equivalent (68.75) and remained constant during each test.
Fig. 6 Two examples of CO2 mixing ratios in dehumidified ambient CO2 gas (□) and in humidified ambient CO2 gas with adjusted values of X wc (0.001) and a w (1.78) (•), as functions of H2O. Different conditions of sea salt attachment on optical windows were applied, although the AGC values were equivalent (68.75) and remained constant during both tests.
3.3.1. Changes in offset and sensitivity
In our first test, the outputs of CO2 mixing ratio from the contaminated IRGA were approximately 82 ppm lower than the actual concentration of 401.1 ppm (a), except at the highest humidity. In our second test, this offset averaged 45 ppm (b). We confirmed that the underestimation of CO2 outputs was a simple offset rather than a change in sensitivity by using four air-based gases with known CO2 mixing ratios (0, 359.7, 401.0, and 421.3 ppm CO2) at different humidity levels (dry and 30 mmol mol−1 H2O). When introducing the CO2 zero gas, the CO2 output from the same contaminated IRGA shown in b clearly decreased by 44.6 ppm, a value almost the same as the decrease with a sample gas of known CO2 mixing ratio shown in b. In contrast, the change in sensitivity of CO2 outputs due to this contamination was an underestimation of 2%, as shown in . In contrast, sea salt contamination caused neither a change in sensitivity nor an offset in the IRGA's H2O output, using the dew point hygrometer as a reference. Prytherch et al. (Citation2010) also reported that the eddy covariance fluxes of latent heat when optical windows were contaminated were similar to the aerodynamic bulk fluxes.
Fig. 7 Sensitivity tests of CO2 mixing ratio outputs in dry [□, rc(dry)] and humidified [•, rc(humid)] standard gases with known CO2 mixing ratios (359.7, 401.0 and 421.3 ppm CO2) under the condition of optical window contamination shown in b. The outputs in humidified gases were corrected with the adjusted values of X wc and a w , and were humidified at the highest level (~3.0%) during the test.
![Fig. 7 Sensitivity tests of CO2 mixing ratio outputs in dry [□, rc(dry)] and humidified [•, rc(humid)] standard gases with known CO2 mixing ratios (359.7, 401.0 and 421.3 ppm CO2) under the condition of optical window contamination shown in Fig. 6b. The outputs in humidified gases were corrected with the adjusted values of X wc and a w , and were humidified at the highest level (~3.0%) during the test.](/cms/asset/29e9a47b-dd23-4a8b-b1a6-bd7aa29f979c/zelb_a_11817257_f0007_ob.jpg)
3.3.2. Water vapour–induced bias due to sea salt contamination
Unlike the case with clean optical windows ( and ), with contaminated optical windows the CO2 mixing ratio outputs in humidified gas showed high biases at high humidities (>20 mmol mol−1 in a as a typical example), even after applying the spectroscopic cross-sensitivity corrections. We made repeated tests under various contamination conditions and obtained similar results in most cases. Although low biases of the CO2 mixing ratio output with increasing H2O were sometimes found (b), low biases of the magnitude observed by Prytherch et al. (Citation2010) were not found. The water vapour–induced biases they observed were greater than ours by an order of magnitude.
3.3.3. Implications for the PKT correction
The reason why sea salt contamination of optical windows caused low CO2 outputs with increasing H2O in previous studies (Prytherch et al., Citation2010; Landwehr et al., Citation2014) is still unclear from our laboratory tests. In in-situ observations, Prytherch et al. (Citation2010) found biases in form and in magnitude that were similar to those suggested by Kohsiek (Citation2000) in laboratory tests with liquid water films on the optical windows, and they concluded that sea salt contamination caused the low biases in CO2 outputs of the open-path IRGA. These studies have led many researchers to believe that sea salt contamination of optical windows causes water vapour–induced low biases in CO2 mixing ratio outputs in open-path eddy covariance measurements of apparent downward CO2 fluxes over the oceans (e.g. Edson et al., Citation2011; Lauvset et al., Citation2011).
A possible explanation for the large low biases in CO2 mixing ratio is that optical window contamination leads to changes in spectroscopic cross-sensitivities. If the contamination reduces the cross-sensitivities, the fact that the accepted correction algorithm for spectroscopic cross-sensitivities produces erroneous, low CO2 outputs with increasing H2O outputs when optical windows are contaminated would result in apparent downward CO2 fluxes with an upward latent heat flux in observations over the ocean. In support of this hypothesis, Prytherch et al. (Citation2010) reported observing a marked, negative correlation between fluctuations of the CO2 mixing ratio and relative humidity, which was similar to the mean behaviour. However, their in-situ observation data did not allow them to clearly show whether this strong relationship between CO2 and H2O outputs was caused by natural processes or optical window contamination.
Prytherch et al. (Citation2010) proposed a correction method for this optical window contamination (the PKT correction method), an iterative approach for arbitrarily reducing the apparent dependence of CO2 mixing ratio output on relative humidity. However, the mechanism inducing the biases has not been elucidated, and we found in this study that sea salt contamination does not always cause a decrease of CO2 mixing ratio with increasing H2O (). Furthermore, Else et al. (Citation2011) found that the PKT correction was troublesome because it made the downward CO2 flux more negative and added noise when latent heat fluxes were very small. These findings indicate that the PKT correction cannot be reliably applied just because optical windows are contaminated by sea salt.
4. Summary and conclusions
Water vapour is well known to influence the measurement of CO2 using non-dispersive IRGAs of several path types, and it can lead to significant measurement errors. Spectroscopic cross-sensitivities due to the pressure broadening effect and direct absorption interference cause erroneous output of the CO2 mixing ratio in samples containing H2O unless their effects are accounted for. In this study, we showed that for the widely used LI-COR gas analyser, the manufacturer's correction for direct absorption interference is not optimised for calculating CO2 mixing ratios and that the correction for the pressure broadening effect causes overestimation of the CO2 mixing ratio flux that increases with the water vapour flux. Kondo and Tsukamoto (Citation2007, Citation2012) observed an upward CO2 flux exceeding the estimated bulk CO2 flux with upward H2O flux over the ocean when the optical windows of the LI-7500 IRGA were cleaned for every observation at each station. These results can be explained by the inaccuracy of the manufacturer's correction of both spectroscopic cross-sensitivities, as shown in our laboratory tests.
Our laboratory tests of optical window contamination showed that contamination by sea salt caused high CO2 output at the higher H2O levels in a water vapour–induced bias and that it caused a large offset in CO2 output without affecting the sensitivity. We also detected a slight change of water vapour cross-sensitivity due to optical window contamination, like the change that caused the low bias of CO2 outputs with increasing H2O found in previous in-situ observations, although this change was not consistent across all of our tests under different contamination conditions. Therefore, we conclude that the proposed method to correct the contamination problem have shortcomings. Accurate measurement of small turbulent CO2 fluctuations using open-path CO2/H2O gas analysers over the ocean depends on verifying optimal spectroscopic cross-sensitivity and on taking measurements when the optical windows are as clean as possible.
5. Acknowledgements
This work was partially supported by funds from the Grant-in-Aid for Scientific Research in Priority Areas (Grant No. 18067010) of the Ministry of Education, Culture, Sports, Science and Technology (MEXT) and the Global Environment Research Account for National Institutes (FY2012-2016; K. Yamanoi, FFPRI) by Ministry of Environment, Japan. This research is a contribution to the Surface Ocean Lower Atmosphere Study (SOLAS) Core Project of the International Geosphere-Biosphere Programme (IGBP). We thank anonymous referees for reading our manuscript carefully and for giving useful comments.
Related Research Data
References
- Baldocchi D . Assessing the eddy covariance technique for evaluating carbon dioxide exchange rates of ecosystem: past, present and future. Glob. Chang. Biol. 2003; 9: 479–492.
- Burba G. G. , Mcdermitt D. K. , Anderson D. J. , Furtaw M. D. , Eckles R. D . Novel design of an enclosed CO2/H2O gas analyser for eddy covariance flux measurements. Tellus B. 2010; 62: 743–748.
- Burch D. E. , Singleton E. B. , Williams D . Absorption line broadening in the infrared. Appl. Opt. 1962; 1: 359–363.
- Duan Z. , Gao H. , Gao Z. , Wang R. , Xue Y. , co-authors . An approach to minimizing artifacts caused by cross-sensitivity in the determination of air-sea CO2 flux using the eddy-covariance technique. Bound. Layer Meteorol. 2013; 148: 227–239.
- Edson J. B. , Fairall C. W. , Bariteau L. , Zappa C. J. , Cifuentes-Lorenzen A. , co-authors . Direct covariance measurement of CO2 gas transfer velocity during the 2008 Southern ocean gas exchange experiment: wind speed dependency. J. Geophys. Res. 2011; 116: C00F10.
- Else B. G. T. , Papakyriakou T. N. , Galley R. J. , Drennan W. M. , Miller L. A. , co-authors . Wintertime CO2 fluxes in an Arctic polynya using eddy covariance: evidence for enhanced air-sea gas transfer during ice formation. J. Geophys. Res. 2011; 116: C00G03.
- Hupp J . The importance of water vapor measurements and corrections. 2011; 8. LI-COR Biosciences Inc. Application Note, 129 .
- Jacobs C. M. J. , Kohsiek W. , Oost W. A . Air-sea fluxes and transfer velocity of CO2 over the North Sea: results from ASGAMAGE. Tellus B. 1999; 51: 629–641.
- Jamieson J. A. , McFee R. H. , Plass G. N. , Grube R. H. , Richards R. G . Infrared Physics and Engineering.
- Jamieson J. A. , McFee R. H. , Plass G. N. , Grube R. H. , Richards R. G . Infrared Physics and Engineering.
- Kondo F. , Tsukamoto O . Air-sea CO2 flux by eddy covariance technique in the equatorial Indian Ocean. J. Oceanogr. 2007; 63: 449–456.
- Kondo F. , Tsukamoto O . Comparative CO2 flux measurements by eddy covariance technique using open- and closed-path gas analysers over the equatorial Pacific Ocean. Tellus B. 2012; 64: 17511.
- Landwehr S. , Miller S. D. , Smith M. J. , Saltzman E. S. , Ward B . Analysis of the PKT correction for direct CO2 flux measurements over the ocean. Atmos. Chem. Phys. 2014; 14: 3361–3372.
- Lauvset S. K. , McGillis W. R. , Bariteau L. , Fairall C. W. , Johannessen T. , co-authors . Direct measurements of CO2 flux in the Greenland Sea. Geophys. Res. Lett. 2011; 38: L12603.
- LI-COR, Inc. Section 3. Theory of operation. LI-7200 CO2/H2O Analyzer Instruction Manual. 2010; 6. Publication No. 984-10564, Lincoln, Nebraska, USA.
- McDermitt D. K. , Welles J. M. , Eckles R. D . Effects of temperature, pressure and water vapor on gas phase infrared absorption by CO2. LI-COR Biosciences Inc. 1993; 5.
- McGillis W. R. , Edson J. B. , Hare J. E. , Fairall C. W . Direct covariance air-sea CO2 fluxes. J. Geophys. Res. 2001; 106: 16729–16745.
- Miller S. D. , Marandino C. , Saltzman E. S . Ship-based measurement of air-sea CO2 exchange by eddy covariance. J. Geophys. Res. 2010; 115: D02304.
- Ohtaki E. , Matsui M . Infrared device for simultaneous measurement of fluctuations of atmospheric carbon dioxide and water vapor. Bound. Layer Meteorol. 1982; 24: 109–119.
- Ohtaki E. , Tsukamoto O. , Iwatani Y. , Mitsuta Y . Measurements of the carbon dioxide flux over the ocean. J. Meteorol. Soc. Jpn. 1989; 67: 541–554.
- Prytherch J. , Yelland M. J. , Pascal R. W. , Moat B. I. , Skjelvan I. , co-authors . Direct measurements of the CO2 flux over the ocean: development of a novel method. Geophys. Res. Lett. 2010; 37: L03607.
- Rella C. W. , Chen H. , Andrews A. E. , Filges A. , Gerbig C. , co-authors . High accuracy measurements of dry mole fractions of carbon dioxide and methane in humid air. Atmos. Meas. Tech. 2013; 6: 837–860.
- Serrano-Ortiz P. , Kowalski A. S. , Domingo F. , Ruiz B. , Alados-Arboledas L . Consequences of uncertainties in CO2 density for estimating net ecosystem CO2 exchange by open-path eddy covariance. Bound. Layer Meteorol. 2008; 126: 209–218.
- Smith S. D. , Anderson R. J. , Jones E. P . A new measurement of CO2 eddy flux in the nearshore atmospheric surface layer. J. Geophys. Res. 1991; 96: 8881–8887.
- Welles J. M. , McDermitt D. K . Measuring carbon dioxide in the atmosphere. Micrometeorol Agr. Syst. Agron. Monogr. 2005; 47: 287–320.