
Abstract
In this study, the concentrations of total mercury (THg) and ions deposited in the surface snow and snow pits in the eastern Antarctic along the 29th inland route of the Chinese National Antarctic Research Expedition were analysed. The THg concentrations in the surface snow ranged from 0.22 to 8.29 ng/L and elevated concentrations were detected in the inland regions of higher altitudes (3000–4000 m). The spatial distribution of the THg in the snow pits showed greater inland concentrations with mean concentrations of <0.2–1.33 ng/L. The THg concentrations in the coastal snow pit (29-A) showed higher concentrations in the summer snow layers than in the winter snow layers. The THg records from the two inland snow pits (29-K and 29-L) spanned decades and indicated elevated THg concentrations between the late 1970s and early 1980s and during the mid-1990s. The temporal variations of THg in the Antarctic snow layers were consistent with anthropogenic emissions around the world. In addition, the Pinatubo volcanic eruption was the primary contributor to the 1992 THg peak that was observed in the inland snow pits.
To access the supplementary material to this article, please see Supplementary files under Article Tools online.
1. Introduction
Mercury (Hg) is a trace metal pollutant of global concern because of its relatively long atmospheric residence time (approximately 1 yr) (Dommergue et al., Citation2010) and its potential to form highly toxic methylmercury, which can bioaccumulate in the aquatic food chain (Schuster et al., Citation2002; Mann et al., Citation2005). Both natural and anthropogenic sources contribute to the presence of mercury in the environment. Land surface (soil degassing) and ocean evasion are the main natural sources of Hg, while fossil fuel combustion and medical waste incineration are the largest anthropogenic sources (Mann et al., Citation2005). The dominant form of Hg in the atmosphere is gaseous elemental mercury (GEM, Hg°), which is relatively inert and can be transported long distances prior to chemical transformation. Consequently, elemental Hg has a global environmental influence. Once the mercury is chemically or photochemically oxidised to reactive gaseous mercury (RGM) and/or particle-associated mercury (PM) (Lindberg et al., Citation2001), it is highly water-soluble and undergoes enhanced deposition via wet and dry processes.
Determining the spatial and temporal patterns of atmospheric mercury deposition is important because the atmosphere is the main pathway for the dispersion of this toxic metal (Fitzgerald and Clarkson, Citation1991; Boutron et al., Citation1998). In the Arctic, atmospheric mercury depletion events (AMDEs) gained attention in the 1990s (Schroeder et al., Citation1998). These events commonly occurred during the spring in the polar coastal environments and were caused by photochemically initiated oxidation reactions that involved marine halogens (Lu et al., Citation2001; Lindberg et al., Citation2002; Skov et al., Citation2004) that transform GEM to RGM and PM (Faïn et al., Citation2008). The deposition of oxidised mercury results in a greater total mercury (THg) concentration in the snow and subsequently contributes to the contamination of the aquatic reservoir during snowmelt (Faïn et al., Citation2008). Modern measurements combined with historical records from lake sediments and peats suggest that a three-fold increase in mercury deposition has occurred since pre-industrial times (Engstrom and Swain, Citation1997; Lamborg et al., Citation2002). In contrast to the sediment-core records, Schuster et al. detected a 20-fold increase in Hg (II) deposition following pre-industrial times (before 1840) through the mid-1980s based on an ice core from the Freemont Glacier (Wyoming, USA) (Schuster et al., Citation2002). Upon analysing the four decades from 1949 to 1989, central Greenland was found to exhibit elevated mercury concentrations beginning in the late 1940s and ranging to the mid-1960s (Boutron et al., Citation1998). The main anthropogenic inputs from North America, Asia and Europe were linked specifically to coal burning and solid waste incineration (Boutron et al., Citation1998). At low latitudes, several attempts have been made to monitor the spatiotemporal variations of toxic metals in snow and ice, especially in the headwater regions of many large rivers (e.g., the highlands in western China) (Loewen et al., Citation2007; Huang et al., Citation2012; Zhang et al., Citation2012). The spatial distribution pattern of mercury in the glaciers located in western China had higher concentrations in the north, where higher atmospheric particulate numbers were measured simultaneously (Loewen et al., Citation2007; Zhang et al., Citation2012). Lower concentrations were observed during the summer (or monsoon season) than during the winter (or non-monsoon season) (Huang et al., Citation2012; Zhang et al., Citation2012). Antarctica is the most remote continent and is usually perceived as an isolated, hostile place and as a symbol of the last great wilderness untouched by humans. However, as in other remote regions, Antarctica is unable to escape the impacts of long-range pollutant transport due to increasing human activities on other continents (Durnford and Dastoor, Citation2011; Pfaffhuber et al., Citation2012).
In past decades, many researchers have investigated the spatiotemporal distribution of mercury in the snow and atmosphere in Antarctica (Vandal et al., Citation1993; Brooks et al., Citation2008a; Jitaru et al., Citation2009; Han et al., Citation2011; Dommergue et al., Citation2012; Pfaffhuber et al., Citation2012; Han et al., Citation2014). Brooks et al. reported preliminary mercury observations at the South Pole (Brooks et al., Citation2008a). In this case, oxidised mercury (e.g. RGM and fine particulate mercury) was present at higher concentrations (100–1000 pg m−3) in the near-surface air. These concentrations were strongly correlated with the vertical mixing rates and showed rapid surface deposition. The spatial distribution of the total THg along the traverse from the coastal region of the Dronning Maud Land to the interior highland regions showed elevated THg concentrations in the polar plateau regions (Han et al., Citation2011). In addition, the history of atmospheric mercury deposition over longer time scales (past decades to tens of thousands years) has also been determined in Antarctica (Vandal et al., Citation1993; Boutron et al., Citation1998; Schuster et al., Citation2002). However, insufficient data are available from Antarctica to study the spatial distribution, the temporal variations and the potential source regions of mercury and the exchanges of mercury between the snow and atmosphere (Durnford and Dastoor, Citation2011), especially for the interior highland regions (Han et al., Citation2011).
Here, we present observations of the spatial distribution of THg on a transect route from Zhongshan Station to Dome A in the interior of eastern Antarctica. Thirteen snow pits were excavated along the route. The records obtained from the pits provide us with the opportunity to understand the spatial distribution of THg from the coast to Dome A and the seasonal variations of THg during past decades. Moreover, this study provided us with an opportunity to understand mercury cycling over the Antarctic region and to compare and analyse these results with previous observations in a synthesised form.
2. Experimental section
2.1. Study area
The field expedition of the 29th Chinese National Antarctic Research Expedition started at Zhongshan Station (69°37′ 31S, 76°37′22E) and reached the Chinese interior research site (Kunlun station), which is located at the highest point of eastern Antarctica, and Dome A (80°25′01S, 77°06′58E) (Xiao et al., Citation2008; Ren et al., Citation2010; Ding et al., Citation2011) between December 2012 and January 2013 (). The expedition route covered a distance of 1248 km, and the altitude increased from sea level at the Zhongshan Station to 4093 m at Dome A. The details of the geographic information of the route and the snow accumulation are listed in and have been presented by others (Hou et al., Citation2007; Xiao et al., Citation2008; Ding et al., Citation2011). Along the route, the coastal region (0–520 km) showed a strong decrease in accumulation with increasing altitude and with increasing distance from the coast. The mid-section (520–1128 km) showed lower accumulation with the highest standard deviation. This finding may be associated with wind-driven processes and/or the unique topography of this region. The region of Dome A (1128–1248 km) had the lowest accumulation and corresponded to the highest elevation and the farthest distance from the ocean (Ding et al., Citation2011). A special precipitation style (diamond dust, clear sky precipitation) dominated the snowfall in this region (Hou et al., Citation2007).
Fig. 1 Sampling sites along the transect from Zhongshan Station to Dome A. Thirteen snow pit samples were collected during the inland journey and the details of the geographic and sampling information can be found in . The blue circles and red points correspond to the locations where surface snow samples were collected on the return trip and were then used for mercury and major ion analysis.
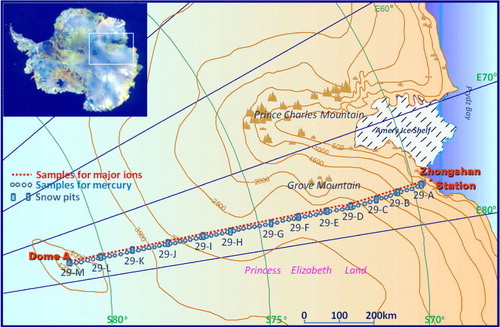
Table 1. Geographic and sampling information with the mean THg concentrations for the 13 snow pits along the transect from Zhongshan Station to Dome A
2.2. Snow sampling
During the 29th Chinese National Antarctic Research Expedition in 2012–2013, 13 snow pits were made along the inland route and 585 snow samples were collected. The details of the snow pit sites are shown in . On the back traverse route, 181 surface snow samples were taken evenly along the route, of which 66 were selected for mercury analysis (supplementary Table S1) and 115 were selected for other ion analysis (). For all samples, 250 ml Nalgene LDPE wide mouth bottles were used; all bottles were thoroughly cleaned using acid and a strict cleaning procedure (Hong et al., Citation2000; Liu et al., Citation2011) at the State Key Laboratory of Cryospheric Sciences (SKLCS) in Lanzhou before double sealing in acid-cleaned LDPE bags. All of the sampling tools, including plastic scrapers and knives, were pre-cleaned before leaving for the fieldwork. For the snow pit, another 20-cm profile was peeled off with clean scrapers after the digging step. All of the samples were taken by pushing the bottles into the wall of the snow pits. In two cases, sample collection was conducted using the ‘Clean Hands–Dirty Hands’ protocol described in our previous work (Zhang et al., Citation2012). Details regarding the cleaning and sample handling protocols can be found in the relevant references (Loewen et al., Citation2007; Huang et al., Citation2012; Zhang et al., Citation2012). The surface snow samples were collected by vertically pushing the sampling bottles into the snow surface, usually at a depth of more than 5 cm. All of the samples were double sealed with clean bags and stored in the dark in clean boxes. All of the samples were transported back to SKLCS while frozen (≤10°C) and were stored in a dark refrigerator (−18°C) until further processing.
2.3. Sample analysis
Before analysis, approximately 50 ml of each snow sample (approximately 20 ml of liquid sample) was aliquoted and transferred into clean polypropylene BD Falcon® (VWR) tubes that were spiked with 100 μL of BV-III grade (CMOS) HCl (Beihua Chemical, China). The remaining sample fractions were used for the ion and stable hydrogen and oxygen isotope analyses. After melting in a clean room (1000-class for the room and 100-class for the operating chamber), 8 μl BrCl was added to each sample. After the processing procedure, all of the samples were stored in clean, dark boxes for more than 6 hours before analysis. The samples were analysed using cold vapour atomic fluorescence spectroscopy (CVAFS) on a Tekran 2600 mercury analyzer according to US EPA Method 1631 (Zhang et al., Citation2012). The detection limit of the method was <0.2 ng L−1. The ORMS-2 (30.6±2.3 ng/L) and ORMS-3 (12.6±1.1 ng/L, National Research Council of Canada) certified reference materials were used for quality control and were within 5% of their certified values. Three unopened sampling bottles were used as field blanks and were brought to the field with the other bottles (Han et al., Citation2014). In the lab, the empty bottles were filled with deionised water and analysed following the same procedure as that used for the other samples (no THg was detected). In addition, the THg concentrations in some samples (approximately 13%) were too low for detection, suggesting that negligible contamination was introduced during the sampling procedure.
The Na+, NH4
+, K+ and Mg2 + cation concentrations were determined using a Dionex ISC 3000 ion chromatograph with an IonPac CS12A column, 20 mM MSA (methanesulphonic acid) eluent and CSRS suppressor. The Cl−, Br−, and
anions and the HCOO− and CH3COO− acids were analysed using a Dionex ISC3000 ion chromatograph with an IonPac AS11-HC column, 25 mM KOH eluent and ASRS suppressor. The analytical detection limits, which were defined as three times the standard deviation of the baseline noise (Toom-Sauntry and Barrie, Citation2002) were approximately 0.58 ng/g for Na+, 0.19 ng/g for NH4
+, 0.19 ng/g for K+, 0.19 ng/g for Mg2 + , 0.75 ng/g for Cl−, 0.07 ng/g for Br−, 0.95 ng/g for
, 0.57 ng/g for
, 0.06 ng/g for HCOO− and 0.24 ng/g for CH3COO−. The analytical precision and accuracy of these concentrations was better than 10%.
The D and 18O compositions in all of the samples were analysed using a Liquid-Water Isotope Analyzer (DLT 100, Los Gatos, USA) based on Off-axis Integrated Cavity Output Spectroscopy (OA-ICOS) at the SKLCS. The isotopic ratios were expressed per mil (‰) relative to Vienna Standard Mean Ocean Water (V-SMOW). The accuracies of the δD and δ18O were ±0.6 ‰ and ±0.2 ‰, respectively.
3. Results and discussions
3.1. THg in the surface snow
The determined THg concentrations for all 66 of the surface snow samples along the traverse from Zhongshan Station to Dome A ranged from 0.22 to 8.29 ng/L (ppt) (with an average value of 1.59±1.89 ng/L (n=66, 1σ), and median, lower and upper percentiles (25% and 75%) of 0.83 ng/L, 0.51 ng/L and 1.57 ng/L, respectively) ( and supplementary Table S1). In general, the surface snow THg concentrations along the expedition transects in eastern Antarctica agreed well with those reported from another expedition routes in Dronning Maud Land [<0.4–10.8 ng/L (n=44)] (Han et al., Citation2011) and were comparable with those from South Victoria Land [0.4–1.5 ng/L (n=5)] (Sheppard et al., Citation1991) and Summit in Greenland [<0.05–2.0 ng/L (n=56)] (Boutron et al., Citation1998). However, the values recorded in our study were significantly lower than those recorded in the Antarctic coastal sea ice regions [near McMurdo, 40–430 ng/L (n=24)] (Brooks et al., Citation2008a). In addition, our values were lower than the mean values on the transect from Dome C to Dumont d'Urville (4.2–194.4 ng L−1, with a mean value of 47.0 ng L−1) (Dommergue et al., Citation2012). The proximity of the sea ice edge and McMurdo Station and the influence of the Mt. Erebus volcanic eruption potentially resulted in the high THg concentrations in Brooks’ samples (Brooks et al., Citation2008a). However, no certified reason was provided for the high mercury concentrations in the samples that were collected during the logistical trial from Dome C and Dumont d'Urville (Dommergue et al., Citation2012). The occasional deposition of highly oxidised mercury potentially caused the high THg concentrations in the surface snow near Dome C and the South Pole (Brooks et al., Citation2008a; Dommergue et al., Citation2012). Otherwise, Hg-rich drifting snow cannot be ruled out (Brooks et al., Citation2008a).
Fig. 2 Total mercury concentrations in the surface snow (a) and snow pit samples (b) collected along the transect from Zhongshan Station to Dome A with the altitude (a), temperature (c) (the air temperature, snow temperature and δD are included) and chemical ion contents ((d) for Na+, (e) for , (f) for Br− and (g) for
).
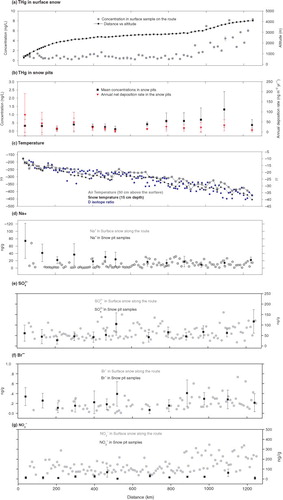
Spatially, the THg concentrations in the surface snow were approximately five-fold higher in the interior highland regions [>3000 m a.s.l., 4.74±2.12 ng/L, (n=13, 1σ)] than in the regions with lower elevations [0.80±0.49 ng/L, (n=53, 1σ)] along the expedition route. The spatial distribution pattern agreed well with Han's results, which covered a traverse route from Syowa station to Dome F in Dronning Maud Land (Han et al., Citation2011). Both data series showed elevated values in the inland regions with high altitudes, implying that different transport pathways or depositional mechanisms play important roles in the deposition of THg in different regions of Antarctica.
3.2. Factors influencing the THg concentrations in the surface snow along the transect
Many factors influenced the variation of the THg concentrations in the snow layers, including the distance from the ocean (Han et al., Citation2011; Dommergue et al., Citation2012), temperature (Brooks et al., Citation2008a; Douglas et al., Citation2008), photochemical reactions associated with solar radiation (Brooks et al., Citation2008a), different precipitation styles (Douglas et al., Citation2008) and accumulation (Han et al., Citation2011). In this section, we analyse the possible factors of influence based on the THg concentrations in the surface snow along the transect. The distributions of the ions (Na+, Cl−, Mg2 + , Br−, ,
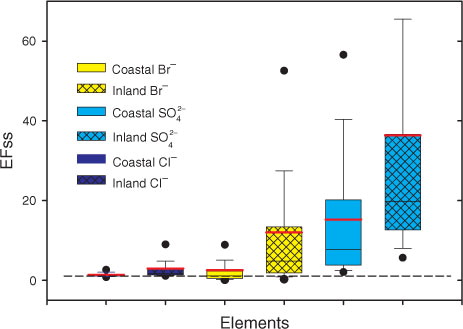
, HCOO−, CH3COO−, etc.) and stable water isotopes (δD, δ18O and D-excess) indicated distinct distributions in the coastal and interior regions, with a dividing line located between approximately 600 km and 2700 m above sea level [Student's t-test, 95% confidence level (Han et al., Citation2011)] (). The sea salt enrichment factors [defined as the mass ratios of the species/Na+ in the snow pit samples divided by those in the standard ocean water (Toom-Sauntry and Barrie, Citation2002; Weller et al., Citation2008)] of the selected ions (Cl−, Br−,
) indicated distinct characteristics in the different sections with higher values in the inland section than the coastal section (). This finding implied that different sources or transporting mechanisms were responsible for deposition in the different regions (Han et al., Citation2014).
Fig. 3 The distribution of the sea salt enrichment factors of selected ions (Cl−, K+, Mg2 + , Br−, ) in the surface snow samples collected in different sections (coastal section between 30–600 km and inland section between 600–1248 km) of the transect from Zhongshan Station to Dome A.
Correlations among the THg and major ions in the surface snow were first analysed in two regions. Significant correlations were observed among the sea salt ions (Na+, Cl−, Mg2 + ) in the coastal regions, implying that the surrounding ocean was a major contributor to deposition (Wolff et al., Citation2003). However, the THg concentrations do not show any significant correlations with the sea salt ions and the other physical indices (altitude, distance inland, air temperature, density, accumulation, etc.), except for snow temperature (−0.44, P=0.03, N=34). A consistent decreasing trend in the THg concentrations occurred over a short distance (0–210 km) from the sea ice region and was potentially associated with the decreased supply of marine halogens for the photo-oxidation of GEM (Poulain et al., Citation2007; Brooks et al., Citation2008a; Han et al., Citation2011). However, the weak correlations between the THg concentrations and the other variables in the initial 600 km transect suggested that many other factors are important for their distribution. First, the nearest sampling site is located 30 km from the coast (622 m above sea level). Hence, none of our samples were truly coastal samples. Additionally, although the direct input of sea salt decreases inland, the deposited halogens could be recycled (Han et al., Citation2011). Second, the accumulation changes significantly in this region; thus, similar sampling depths may represent different time intervals. Third, quick basal ice movement to the Lambert Glacier Basin (Cui et al., Citation2010) and greater wind velocity can be found in this area (Ma et al., Citation2010). Intensive snow drifting can significantly alter the initial deposition of Hg in the surface snow (Li et al., Citation2014).
Significant correlations were observed between THg concentrations and the other variables (altitude, distance inland, temperature, water stable isotopes, etc.) in the interior section (600–1248 km). The Br− concentration was weakly correlated (0.33, P=0.053, N=25) with THg, which was partially attributed to the limited amount of data. No significant correlations were found between THg concentrations and accumulation (−0.28, P=0.128, N=32), suggesting that accumulation slightly influenced the THg distribution. D-excess was a useful indicator for monitoring the moisture sources (Xiao et al., Citation2013). In previous research, it was noted that the moisture source region for the Dome A area lies 46±4°S of the South Indian Ocean (Wang et al., Citation2012). The significant correlations between the THg concentrations and the D-excess, altitude and distance inland (0.73, 0.82, 0.79 for the three variables, respectively, with P<0.01 and N=32 for all) potentially indicate that the lower latitudes were important source regions for Hg deposition in the interior region. The significant negative correlations between the THg and the temperature indices (−0.83, −0.76, −0.63 for air temperature, snow temperature and δD, respectively, P<0.01 and N=32) may show that temperature significantly influenced the deposition of THg. This influence could be achieved via the two following mechanisms. First, colder temperatures can prevent the photoreduction of deposited oxidised mercury into GEM, which would be emitted into the atmosphere (Douglas et al., Citation2008; Brooks et al., Citation2008a). Second, the lower temperatures in the higher altitude regions were helpful for forming diamond dust, surface hoar and frost flower, which are important carriers of mercury (Douglas et al., Citation2008; Hou et al., Citation2007). Pristine diamond dust ice crystals are usually observed with sizes <150 μm and consist of thick plates/short columns, columns and plates that are expected to grow by vapour diffusion after heterogeneous nucleation (Bacon et al., Citation2003). Because of the extremely low accumulation rate in the Antarctic interior, clear sky precipitation accounts for a large fraction of the total precipitation (Bromwich, Citation1988). Because of the unique precipitation and the weak wind in the Dome A region, a needle ice crystal layer develops on the snow surface. This type of unique topographic feature can only be observed in the Antarctic inland sites (Hou et al., Citation2007). Douglas et al. noted that mercury was enriched on the surfaces of the ice crystals, which had higher specific surface areas (Douglas et al., Citation2008). The kinetic crystals that grow from the vapour phase, including surface hoar, frost flower and diamond dust, yield mercury concentrations that are typically 2–10 times greater than those reported for snow deposited during AMDEs (approximately 80 ng/L) (Douglas et al., Citation2008). The long-range transport and vertical precipitation of mercury in diamond dust from the stratosphere could be a major source of THg on the inner Plateau (Han et al., Citation2011).
Halogen radicals (e.g. Br•, BrO• and Cl•) are important activators for the oxidation of atmospheric GEM (Goodsite et al., Citation2004; Faïn et al., Citation2008). Although halogen radicals are concentrated near sea ice regions, long-range transport and sea salt recycling appear to supply marine halogens to even the inland Plateau (Han et al., Citation2011). Scavenging of reactive gases (such as HBr, HNO3 and HONO) by the high surface area of the ice crystals may result in the high values in inland Antarctica (Toom-Sauntry and Barrie, Citation2002). In addition, elevated nitrate concentrations were observed in the interior regions of eastern Antarctica and were highly correlated (0.63, P<0.01, N=32) with the THg concentrations in the surface snow. In the interior regions of the Antarctic ice sheet, nitrate mainly originated from NOx production in the stratosphere and from tropospheric lightning (Wagenbach et al., Citation1998; Röthlisberger et al., Citation2000; Li et al., Citation2013). Otherwise, the production of NOx from N2 dissociation above the stratopause, which is strongly modulated by solar radiation, contributes to the Antarctic budget (Legrand and Kirchner, Citation1990). The production of the THg and nitrate in snow was connected with solar radiation, and the special scavenging pathway may play a role in these significant correlations.
3.3. THg in snow pits
The THg concentrations in the snow pit samples were between <0.2 and 5.09 ng/L (n=558), and the mean concentrations for all of the snow pits varied from 0.13±0.17 ng/L to 1.33±1.09 ng/L (n=13). The mean snow pit concentrations were similar to (or lower than) the surface snow sample concentrations (). Two factors potentially accounted for this difference. 1) The first factor is the difference between the sampling dates. Surface snow samples were collected between 24 January and 11 February 2013, 3–5 weeks later than the maximum solar elevation and during the peak annual mercury production in Antarctica (Brooks et al., Citation2008a). The snow pit samples were collected between 16 December 2012 and 5 January 2013 (). In this case, increasing GEM concentrations were detected in the atmosphere but the peak value had not been reached (Brooks et al., Citation2008a). In the austral summer, GEM is actively converted to its oxidised form of Hg(II) when solar irradiation is sufficiently strong to produce Br• from the photolysis of Br2 (Faïn et al., Citation2008). The following mechanism was potentially involved in the greater THg content in the surface snow samples (Goodsite et al., Citation2004).2) Post-depositional effects. After deposition, Hg depletion in the snow was potentially caused by a rapid snow-to-air Hg transfer resulting from the photoinduced reduction of Hg(II) to volatile Hg° (Lalonde et al., Citation2002) that was released into the atmosphere as GEM. Furthermore, the sublimation-, ablation- and drifting-induced mass loss of snow may reduce the THg concentrations in the snow layers (Zhang et al., Citation2012). Field observations have suggested that newly deposited mercury during snowfall decreased by an average of 54% within 24 hours after deposition (Lalonde et al., Citation2002). In this study, the mean THg concentrations remaining in the snow pits accounted for approximately 28% of the mean values in the surface snow samples, implying that an even larger portion of the deposited THg was released into the atmosphere. Similar to the surface snow samples, the mean THg concentrations in the snow pits were higher in the interior regions [0.74±0.79 ng/L (n=390)] than near the coast [0.23±0.26 ng/L (n=172)]. Otherwise, for all of the snow pits, the arithmetic mean concentrations were greater than the median concentrations, which indicated that the mean was significantly influenced by episodic high concentrations () (Pfaffhuber et al., Citation2012).
Based on the mean THg concentration that was calculated from the snow pits in the interior plateau (above 3000 m, 29-K, 29-L and 29-M are included) and the mean accumulations that were inferred from the snow pits (), the annual mean buried concentration of mercury in the Antarctic polar plateau was roughly estimated for the past three to four decades (~5 million km2) as 0.14±0.03 metric tons. This value was significantly lower than Brooks’ value, which was based on snow pits at the South Pole (~60 metric tons) (Brooks et al., Citation2008a). This deviation resulted from the higher mean THg concentrations that were sequestered in Brooks’ snow pits. However, the three snow pits that were excavated by Brooks were all located near the South Pole Station. The snowpack covered a significantly larger area () in our study. Thus, it was hypothesised that more sites should be included to assess the deposition of THg across such a large area. Regarding the Antarctic ice sheet, the THg concentrations in all 13 snow pits along the transect were used to estimate the total THg deposition. The annual mean amount of sequestered mercury in the past 3 or 4 yr was calculated as the sum of the annual deposition in the regions with different altitudes and was 0.55±0.11 metric tons. Based on the THg concentrations in the surface snow (5 cm) along the traverse, the amount of deposited THg during the austral summer (November–February) was 0.98±0.81 metric tons on the Antarctic polar plateau (3000–4000 m) and was 1.79±1.27 metric tons for the entire Antarctic ice sheet. Thus, approximately 86% of the THg deposited during the austral summer was emitted back into the atmosphere in the high polar plateau area. For all of Antarctica, this value was approximately 69%.
3.4. Temporal variations of the THg and possible sources
Seasonal variations of marine compounds were preferentially adopted for dating the snow pit profiles. In addition, snow accumulation and historical data (Ding et al., Citation2011) were used to ensure the dating accuracy. The fingerprints of the Pinatubo eruption occurred in 1991 and were recorded in snow pits 29-L and 29-M. These fingerprints provided us with a certified dating signature corresponding to 1992 (Traufetter et al., Citation2004; Castellano et al., Citation2005; Ren et al., Citation2010; Cole-Dai et al., Citation2000). Because of the different annual accumulations at different sites, the spanning periods of the snow pits varied from approximately 3 yr at the coast (29-A) to approximately 45 yr in the interior region of Dome A (29-M). In this section, one coastal (29-A) and two inland snow pits (29-K and 29-L) were selected to study the temporal variations of the THg concentrations and the possible influencing factors.
3.4.1. 29-A
Based on the dating results with seasonal variations of the sea salt and sulphate ions, a 3-yr duration (2010–2012) was obtained (). Although the calculated mean annual accumulation rate was 268 kg m−2 yr−1, no previous monitoring results were given for this site. In addition, this value was consistent with another coastal site (LGB69, 286.3 kg m−2 yr−1) on the same expedition route. The THg concentrations were greater in the summer snow layers than in the winter snow layers (δD showed higher and lower values, respectively). The production of RGM was associated with solar irradiation and mainly occurred during the sunlit period (Zhang et al., Citation2012). Typically, the sunlit period in Antarctica lasts from September to March, and the solar elevation reaches its maximum in December (Brooks et al., Citation2008a). Otherwise, the higher concentrations of Br− that occurred in the austral summer snow layers (not shown here) may be responsible for the higher THg values (Lalonde et al., Citation2002). The THg in the snow pit peaked at the surface and decreased rapidly with depth in the sunlit zone (e.g. first 0–15 cm). Below a depth of approximately 25 cm, the THg concentration was less variable, with concentrations of approximately 0.2 ng L−1 (Brooks et al., Citation2008a). No significant correlation was found between the THg and the sea salt ions (). A similar variation trend was found between THg and sulphate. The sulphate concentrations are always higher in the summer when the sea ice area is lower and when more DMS is emitted into the atmosphere (Sun et al., Citation2002 and Welch et al., Citation1993; Becagli et al., Citation2009). The only AMDE in the Antarctic was detected at the McMurdo station on the coast. The increase in the snow pack mercury levels are related to mercury depletion events at locations near marine snowpack and ice containing sea salt. The McMurdo event was similar to the event that was reported at Alert Canada (Schroeder et al., Citation1998; Lu et al., Citation2001) at Barrow, Alaska (Brooks et al., Citation2008a). However, because of the low sampling resolution (25 cm) and the distance from the sea ice edge (40 km), no atmospheric mercury deposition event was detected in the 29-A snow pit.
Fig. 4 Distribution of the THg concentrations in snow pit 29-A with the sodium and sulphate ions and the δD values. The error bars of the total mercury concentrations represent 1σ of instrument precision.
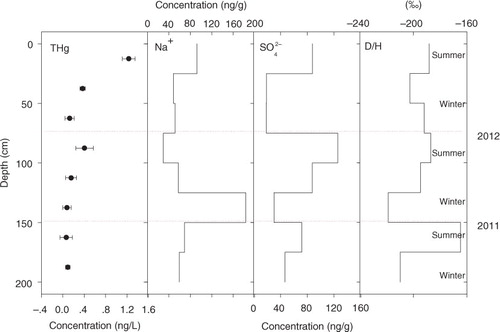
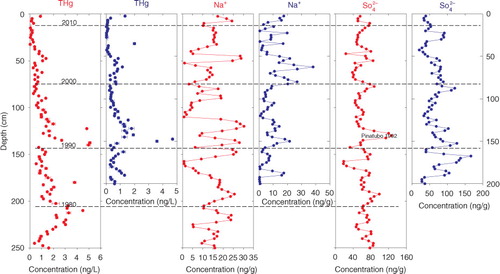
3.4.2. 29-K and 29-L
THg concentration records of longer duration were obtained from the two interior snow pits. Specifically, 24 (1989–2012) and 37 (1976–2012) years of concentration records were obtained from the 29-K and 29-L snow pits, respectively (). Many studies of THg concentrations in snow and ice around the world cover this period (Boutron et al., Citation1998; Faïn et al., Citation2009; Han et al., Citation 2014; Zheng et al., Citation2014). Between the 1970s and 1980s, higher THg values were recorded in the Summit snow layers (Greenland) (Faïn et al., Citation2009). This trend was consistent with the worldwide production of mercury and the anthropogenic emissions of mercury into the atmosphere (USGS, Citation2006). Next, the THg concentrations in the Upper Fremont Glacier ice core showed a decreasing trend (Schuster et al., Citation2002), and a similar trend was found in the Summit snow layers (Faïn et al., Citation2009) and the two sites in the Canadian High Arctic, the Agassiz Ice Cap and the Mt. Oxford Ice Field (Zheng et al., Citation2014). The United States Clean Air Act of 1970 and the Clean Air Amendment of 1990 were partly responsible for this reduction (Schuster et al., Citation2002). In addition, simultaneous decreases in the THg concentrations were also recorded for the Antarctic Taylor Valley and Dome Fuji snow layers between 1987 and 1993 (Witherow and Lyons, Citation2008; Han et al., Citation2014), implying that the anthropogenic effects on mercury production are globally influenced. Another obvious increase in the THg concentration occurred in the mid-1990s and was recorded in both Arctic and Antarctic snow layers (Rebecca et al., 2008; Zheng et al., Citation2014; Han et al., Citation2014). This increase could be associated with a small increase in worldwide mercury production in the mid-1990s (Pacyna et al., Citation2006; USGS, Citation2006; Lindberg et al., Citation2007).
In the 29-L and 29-K snow pits, elevated THg concentrations were detected at the end of the 1970s and during the 1980s (similar distribution patterns can also be found in the 29-M snow pit, although the data are not shown here), which may be connected with high amounts of global mercury production and the anthropogenic emissions of mercury into the atmosphere (Faïn et al., Citation2008, Citation2009). Beginning in the 1980s and lasting until the early 1990s, a consistently decreasing trend in THg occurred. This trend was consistent with a decrease in global mercury production (Faïn et al., Citation2009) and with other snow layer records from the Arctic and Antarctica (Han et al., Citation2014; Zheng et al., Citation2014). In addition, an elevated THg concentration (approximately six times greater than the background value) occurred during the early 1990s in the 29-K and 29-L snow pits. The concurrent appearance of elevated THg contents in these two snow pits potentially resulted from the volcanic eruption of Pinatubo (1991). Several studies have noted that volcanic eruptions can cause elevated halogen concentrations in the atmosphere (Schuster et al., Citation2002; Brooks et al., Citation2008b; Faïn et al., Citation2009) and can further increase mercury deposition in snow layers. Mt. Erebus, a volcano located near Ross Sea in western Antarctica, potentially was a secondary source of local mercury (Brooks et al., Citation2008b). In addition, elevated THg concentrations were recorded simultaneously in the mid-1990s in the two snow pits, implying that even the most remote regions are influenced by anthropogenic activities (USGS, Citation2006). Another simultaneous increase in THg in the two snow pits occurred during the mid-2000s. However, the elevated concentration was lower than values recorded for the mid-1990s ( and ). Because confident emissions data for global mercury are lacking for this period, no further sources for the elevated values are hypothesised.
Fig. 5 Comparison of the temporal distribution of the THg concentrations in snow pits 29-K (blue) and 29-L (red) with the sodium and sulphate ion values. The error bars of the total mercury concentrations represent 1σ of instrument precision.
4. Conclusions
The THg concentrations, ion concentrations and stable water isotopes that were deposited in snow and snow layers in the eastern Antarctic along the 29th Chinese National Antarctic Research Expedition route during the austral summer of 2012/2013 were analysed in this study. In the surface snow, the THg, Br− and concentrations were generally greater in the inland plateau (above 3000 m) than at lower altitudes near the coast. Enhanced halogen supply, stratospheric chemistry during the sunlit period and scavenging by diamond dust ice crystals likely play important roles in deposition in the inland region. Lower mean THg concentrations were detected in the snow pits relative to the surface snow. The post-depositional loss of the deposited Hg from the snow layer was approximately 86% in the inland plateau area and approximately 69% throughout Antarctica. The temporal variations of the THg in the coastal snow pit (29-A) indicated that higher concentrations occurred in the summer snow layers than in the winter snow layers. This finding was consistent with the enhanced photochemical production of reactive gas-phase mercury that has been observed elsewhere in Antarctica during the summer. Most of the inland plateau snow pits (above 3000 m) with multidecadal records showed elevated THg concentrations between the late 1970s and early 1980s and during the mid-1990s. This variation is consistent with trends in the global emissions of mercury. The significant increase in the THg at the beginning of the 1990s was likely associated with the eruption of the Pinatubo volcano (1991). Longer THg records from deeper ice cores were analysed and could be helpful for rebuilding the longer deposition history of mercury in the interior region of eastern Antarctica and for studying the natural and anthropogenic influences on mercury deposition.
Supplementary data
Download PDF (230.2 KB)Acknowledgements
The authors thank all of the members who participated in the 2012–2013 Chinese National Antarctic Research Expedition field campaigns for sample collection. In addition, special thanks are given to Ms. Xiaoxiang Wang, Xiaoqing Cui and Yuman Zhu from the Cold and Arid Regions Environmental and Engineering Research Institute for completing portions of the analysis. This work was financially supported by the Innovative Research Group, the National Natural Science Foundation of China (501100001809) (41121001), NSFC: 41425003 the National Basic Research Program of China (973 Program, 2013CBA01804), the State Key Laboratory of Cryospheric Sciences, the National Natural Science Foundation of China (Grant No. 41201069 and 41476164), the State Oceanic Administration of People's Republic of China Project on Climate in Polar Regions (Grant Nos. CHINARE 2014-04-04 and CHINARE 2014-02-02), and the Foundation for Excellent Youth Scholars of CAREERI, CAS.
Notes
To access the supplementary material to this article, please see Supplementary files under Article Tools online.
Related Research Data
References
- Bacon N. J. , Baker M. B. , Swanson B. D . Initial stages in the morphological evolution of vapour-grown ice crystals: a laboratory investigation. Q. J. Roy. Meteorol. Soc. 2003; 129: 1903–1927.
- Becagli S. , Castellano E. , Cerri O. , Curran M. , Frezzotti M. , co-authors . Methanesulphonic acid (MSA) stratigraphy from a Talos Dome ice core as a tool in depicting sea ice changes and southern atmospheric circulation over the previous 140 years. Atmos. Environ. 2009; 43: 1051–1058.
- Boutron C. F. , Vandal G. M. , Fitzgerald W. F. , Ferrari C. P . A forty year record of Mercury in central Greenland snow. Geophys. Res. Lett. 1998; 25: 3315–3318.
- Bromwich D. H . Snowfall in high southern latitudes. Rev. Geophys. 1988; 26: 149–168.
- Brooks S. , Arimoto R. , Lindberg S. , Southworth G . Antarctic polar plateau snow surface conversion of deposited oxidized mercury to gaseous elemental mercury with fractional long-term burial. Atmos. Environ. 2008a; 42: 2877–2884.
- Brooks S. , Lindberg S. , Southworth G. , Arimoto R . Springtime atmospheric mercury speciation in the McMurdo, Antarctica coastal region. Atmos. Environ. 2008b; 42: 2885–2893.
- Castellano E. , Becagli S. , Hansson M. , Hutterli M. , Petit J. , co-authors . Holocene volcanic history as recorded in the sulfate stratigraphy of the European Project for Ice Coring in Antarctica Dome C (EDC96) ice core. J. Geophys. Res. 2005; 110: 06114.
- Cole-Dai J. , Mosley-Thompson E. , Wight S. P. , Thompson L. G . A 4100-year record of explosive volcanism from an East Antarctica ice core. J. Geophys. Res. 2000; 105: 24431–24441.
- Cui X. , Sun B. , Tian G. , Tang X. , Zhang X. , co-authors . Preliminary results of ice radar investigation along the traverse between Zhongshan and Dome A in East Antarctic ice sheet: ice thickness and subglacial topography. Chin. Sci. Bull. 2010; 55(24): 2715–2722.
- Ding M. , Xiao C. , Li Y. , Ren J. , Hou S. , co-authors . Spatial variability of surface mass balance along a traverse route from Zhongshan station to Dome A, Antarctica. J. Glaciol. 2011; 57: 658–666.
- Dommergue A. , Barret M. , Courteaud J. , Cristofanelli P. , Ferrari C. P. , co-authors . Dynamic recycling of gaseous elemental mercury in the boundary layer of the Antarctic Plateau. Atmos. Chem. Phys. 2012; 12: 11027–11036.
- Dommergue A. , Sprovieri F. , Pirrone N. , Ebinghaus R. , Brooks S. , co-authors . Overview of mercury measurements in the Antarctic troposphere. Atmos. Chem. Phys. 2010; 10: 3309–3319.
- Douglas T. A. , Sturm M. , Simpson W. R. , Blum J. D. , Alvarez-Aviles L. , co-authors . Influence of snow and ice crystal formation and accumulation on mercury deposition to the Arctic. Environ. Sci. Tech. 2008; 42: 1542–1551.
- Durnford D. , Dastoor A . The behavior of mercury in the cryosphere: a review of what we know from observations. J. Geophys. Res. 2011; 116: 06305.
- Engstrom D. R. , Swain E. B . Recent declines in atmospheric mercury deposition in the upper Midwest. Environ. Sci. Tech. 1997; 31: 960–967.
- Faïn X. , Ferrari C. P. , Dommergue A. , Albert M. , Battle M. , co-authors . Mercury in the snow and firn at Summit Station, Central Greenland, and implications for the study of past atmospheric mercury levels. Atmos. Chem. Phys. 2008; 8: 3441–3457.
- Faïn X. , Ferrari C. P. , Dommergue A. , Albert M. R. , Battle M. , co-authors . Polar firn air reveals large-scale impact of anthropogenic mercury emissions during the 1970s. Proc. Natl. Acad. Sci. USA. 2009; 106: 16114–16119.
- Fitzgerald W. F. , Clarkson T. W . Mercury and monomethylmercury: present and future concerns. Environ. Health Perspect. 1991; 96: 159. [PubMed Abstract] [PubMed CentralFull Text].
- Goodsite M. E. , Plane J. , Skov H . A theoretical study of the oxidation of Hg0 to HgBr2 in the troposphere. Environ. Sci. Tech. 2004; 38: 1772–1776.
- Han Y. , Huh Y. , Hong S. , Hur S. D. , Motoyama H . Evidence of air-snow mercury exchange recorded in the snowpack at Dome Fuji, Antarctica. Geosci. J. 2014; 18: 105–113.
- Han Y. , Huh Y.-S. , Hong S.-M. , Hur S.-D. , Motoyama H. , co-authors . Quantification of total mercury in Antarctic surface snow using ICP-SF-MS: spatial variation from the Coast to Dome Fuji. Bull. Kor. Chem. Soc. 2011; 32: 4258–4264.
- Hong S. , Lluberas A. , Rodriguez F . A clean protocol for determining ultralow heavy metal concentrations: its application to the analysis of Pb, Cd, Cu, Zn and Mn in Antarctic snow. Kor. J. Polar Res. 2000; 11: 35–47.
- Hou S. , Li Y. , Xiao C. , Ren J . Recent accumulation rate at Dome A, Antarctica. Chin. Sci. Bull. 2007; 52: 428–431.
- Huang J. , Kang S. , Guo J. , Zhang Q. , Xu J. , co-authors . Seasonal variations, speciation and possible sources of mercury in the snowpack of Zhadang glacier, Mt. Nyainqêntanglha, southern Tibetan Plateau. Sci. Total Environ. 2012; 429: 223–230. [PubMed Abstract].
- Jitaru P. , Gabrielli P. , Marteel A. , Plane J. M. , Planchon F. A. , co-authors . Atmospheric depletion of mercury over Antarctica during glacial periods. Nat. Geosci. 2009; 2: 505–508.
- Lalonde J. D. , Poulain A. J. , Amyot M . The role of mercury redox reactions in snow on snow-to-air mercury transfer. Environ. Sci. Tech. 2002; 36: 174–178.
- Lamborg C. H. , Fitzgerald W. F. , O'Donnell J. , Torgersen T . A non-steady-state compartmental model of global-scale mercury biogeochemistry with interhemispheric atmospheric gradients. Geochim. Cosmochim. Acta. 2002; 66: 1105–1118.
- Legrand M. R. , Kirchner S . Origins and variations of nitrate in south polar precipitation. J. Geophys. Res. 1990; 95: 3493–3507.
- Li C. , Qin X. , Ding M. , Guo R. , Xiao C. , co-authors . Temporal variations in marine chemical concentrations in coastal areas of eastern Antarctica and associated climatic causes. Quart. Intern. 2014; 352: 16–25.
- Li C. , Ren J. , Qin D. , Xiao C. , Hou S. , co-authors . Factors controlling the nitrate in the DT-401 ice core in eastern Antarctica. Sci. China. 2013; 56: 1531–1539.
- Lindberg S. , Bullock R. , Ebinghaus R. , Engstrom D. , Feng X. B. , co-authors . A synthesis of progress and uncertainties in attributing the sources of mercury in deposition. Ambio. 2007; 36: 19–32. [PubMed Abstract].
- Lindberg S. , Wallschlaeger D. , Prestbo E. , Bloom N. , Price J. , co-authors . Methylated mercury species in municipal waste landfill gas sampled in Florida, USA. Atmos. Environ. 2001; 35: 4011–4015.
- Lindberg S. E. , Brooks S. , Lin C.-J. , Scott K. J. , Landis M. S. , co-authors . Dynamic oxidation of gaseous mercury in the Arctic troposphere at polar sunrise. Environ. Sci. Tech. 2002; 36: 1245–1256.
- Liu Y. , Hou S. , Hong S. , Hur S. D. , Lee K. , co-authors . High-resolution trace element records of an ice core from the eastern Tien Shan, central Asia, since 1953 AD. J. Geophys. Res. 2011; 116: 12307.
- Loewen M. , Kang S. , Armstrong D. , Zhang Q. , Tomy G. , co-authors . Atmospheric transport of mercury to Tibetan Plateau. Environ. Sci. Tech. 2007; 41(22): 7632–7638.
- Lu J. Y. , Schroeder W. H. , Barrie L. A. , Steffen A. , Welch H. E. , co-authors . Magnification of atmospheric mercury deposition to polar regions in springtime: the link to tropospheric ozone depletion chemistry. Geophys. Res. Lett. 2001; 28: 3219–3222.
- Ma Y. , Bian L. , Xiao C. , Allison I. , Zhou X . Near surface climate of the traverse route from Zhongshan Station to Dome A, East Antarctica. Antarctic Sci. 2010; 22: 443–459.
- Mann J. L. , Long S. E. , Shuman C. A. , Kelly W. R . Determination of mercury content in a shallow firn core from Greenland by isotope dilution inductively coupled plasma mass spectrometry. Water Air. Soil Pollut. 2005; 163: 19–32.
- Pacyna E. G. , Pacyna J. M. , Steenhuisen F. , Wilson S . Global anthropogenic mercury emission inventory for 2000. Atmos. Environ. 2006; 40: 4048–4063.
- Pfaffhuber K. A. , Berg T. , Hirdman D. , Stohl A . Atmospheric mercury observations from Antarctica: seasonal variation and source and sink region calculations. Atmos. Chem. Phys. 2012; 12: 3241–3251.
- Poulain A. J. , Garcia E. , Amyot M. , Campbell P. G. C. , Ariya P. A . Mercury distribution, partitioning and speciation in coastal vs. inland High Arctic snow. Geochim. Cosmochim. Acta. 2007; 71: 3419–3431.
- Röthlisberger R. , Hutterli M. A. , Sommer S. , Wolff E. W. , Mulvaney R . Factors controlling nitrate in ice cores: evidence from the Dome C deep ice core. J. Geophys. Res. 2000; 105: 20565–20572.
- Ren J. , Li C. , Hou S. , Xiao C. , Qin D. , co-authors . A 2680 year volcanic record from the DT-401 East Antarctic ice core. J. Geophys. Res. 2010; 115: 11301.
- Schroeder W. , Anlauf K. , Barrie L. , Lu J. , Steffen A. , co-authors . Arctic springtime depletion of mercury. Nature. 1998; 394: 331–332.
- Schuster P. F. , Krabbenhoft D. P. , Naftz D. L. , Cecil L. D. , Olson M. L. , co-authors . Atmospheric mercury deposition during the last 270 years: a glacial ice core record of natural and anthropogenic sources. Environ. Sci. Tech. 2002; 36: 2303–2310.
- Sheppard D. , Patterson J. , McAdam M . Mercury content of Antarctic ice and snow: further results. Atmos. Environ. 1991; 25: 1657–1660.
- Skov H. , Christensen J. H. , Goodsite M. E. , Heidam N. Z. , Jensen B. , co-authors . Fate of elemental mercury in the Arctic during atmospheric mercury depletion episodes and the load of atmospheric mercury to the Arctic. Environ. Sci. Tech. 2004; 38: 2373–2382.
- Sun J. , Ren J. , Qin D . 60 years record of biogenic sulfur from Lambert Glacier basin firn core, East Antarctica. Ann. Glaciol. 2002; 35: 362–367.
- Toom-Sauntry D. , Barrie L. A . Chemical composition of snow fall in the high Arctic: 1990–1994. Atmos. Environ. 2002; 36: 2683–2693.
- Traufetter F. , Oerter H. , Fischer H. , Weller R. , Miller H . Spatio-temporal variability in volcanic sulphate deposition over the past 2 kyr in snow pits and firn cores from Amundsenisen, Antarctica. J. Glaciol. 2004; 50: 137–146.
- USGS. US Geological Survey, Mercury statistics. 2006. Online at: http://minerals.usgs.gov/ds/2005/2140/mercury.pdf .
- Vandal G. M. , Fitzgerald W. F. , Boutron C. F. , Candelone J.-P . Variations in mercury deposition to Antarctica over the past 34,000 years. Nature. 1993; 362: 621–623.
- Wagenbach D. , Legrand M. , Fischer H. , Pichlmayer F. , Wolff E . Atmospheric near-surface nitrate at coastal Antarctic sites. J. Geophys. Res. 1998; 103: 11007–11020.
- Wang Y. , Sodemann H. , Hou S. , Masson-Delmotte V. , Jouzel J. , co-authors . Snow accumulation and its moisture origin over Dome Argus, Antarctica. Clim. Dynam. 2012; 40: 731–742.
- Welch K. , Mayewski P. A. , Whitlow S . Methanesulfonic acid in coastal Antarctic snow related to sea-ice extent. Geophys. Res. Lett. 1993; 20: 443–446.
- Weller R. , Woltjen J. , Piel C. , Resenberg R. , co-authors . Seasonal variability of crustal and marine trace elements in the aerosol at Neumayer station, Antarctica. Tellus B. 2008; 60: 742–752.
- Witherow R. A. , Lyons W. B . Mercury deposition in a polar desert ecosystem. Environ. Sci. Tech. 2008; 42: 4710–4716.
- Wolff E. W. , Rankin A. M. , Röthlisberger R . An ice core indicator of Antarctic sea ice production?. Geophys. Res. Lett. 2003; 30(22): 2158.
- Xiao C. , Ding M. , Masson-Delmotte V. , Zhang R. , Jin B. , co-authors . Stable isotopes in surface snow along a traverse route from Zhongshan station to Dome A, East Antarctica. Clim. Dynam. 2013; 41: 2427–2438.
- Xiao C. , Li Y. , Hou S. , Allison I. , Bian L. , Ren J . Preliminary evidence indicating Dome A (Antarctica) satisfying preconditions for drilling the oldest ice core. Chin. Sci. Bull. 2008; 53: 102–106.
- Zhang Q. , Huang J. , Wang F. , Mark L. , Xu J. , co-authors . Mercury distribution and deposition in glacier snow over western China. Environ. Sci. Tech. 2012; 46: 5404–5413.
- Zheng J. , Pelchat P. , Vaive J. , Bass D. , Ke F . Total mercury in snow and ice samples from Canadian High Arctic ice caps and glaciers: a practical procedure and method for total Hg quantification at low pgg−1 level. Sci. Total Environ. 2014; 468–469: 487–494.