
Abstract
The influence of in-cloud and below-cloud scavenging, described by the obscurities (mist, fog and shallow fog) and precipitation, on submicron atmospheric aerosol (AA) particle number size distributions (PNSDs) was studied using 5 years of measurements at the rural background station Košetice. The typical PNSDs during individual meteorological phenomena were compared, and the change in the concentrations before and after the beginning of the phenomenon, the scavenging coefficient λ s , and the rate of change of the AA concentrations with time were computed. It was found that both obscurities and precipitation have a strong influence on the AA concentrations, both on the total number concentrations and on the PNSDs. The presence of phenomena even changes the number of modes on the PNSDs. The PNSD main mode is shifted to the larger particles, and the concentrations of particles smaller than 50 nm in diameter are considerably lower. In nucleation mode, however, wet scavenging does not seem to be the main process influencing the AA concentrations, although its considerable effect on the concentration was proved. During obscurities, there is a typical PNSD to which the PNSDs converge at any mist/fog/shallow fog event. The concentrations of AA particles smaller than 80 nm are lower than they are during periods without any phenomenon recorded, and the concentrations of the strongly prevailing accumulation mode are higher. During liquid precipitation, PNSDs are lower when compared to non-event periods. With larger droplets of the phenomenon, the position of the main mode of the bimodal PNSDs is shifted to the smaller particles. The process of gas-to-particle conversion takes place in the breaks from precipitation during a rain showers period. Precipitation containing frozen hydrometeors behaves differently from liquid precipitation. Concentrations of AA particles larger than 200 nm during precipitation containing solid particles do not differ from non-event cases, suggesting insignificant scavenging.
To access the supplementary material to this article, please see Supplementary files under ‘Article Tools’.
1. Introduction
Wet deposition is an important removal mechanism of atmospheric aerosol (AA) in the troposphere. It comprises processes transferring AA to the surface of the Earth in an aqueous form (Seinfeld and Pandis, Citation1998). Wet deposition can be divided into in-cloud (ICS) and below-cloud (BCS) scavenging. The ICS, also called rainout, or nucleation scavenging (Ladino et al., Citation2011), is described as the growth of particles into cloud droplets, and the capture of AA on droplets via Brownian and turbulent diffusion (Chate et al., Citation2003). The BCS, also called washout or impaction scavenging, consists of collisions and coalescence due to impaction, turbulent and Brownian diffusion as well as phoretic phenomena etc. (e.g. Slinn and Hales, Citation1971; Chate et al., Citation2011).
Both BCS and ICS depend on the size, chemical composition and concentration of the AA particles and also on the presence of an electric charge (e.g. Laakso et al., Citation2003; Ladino et al., Citation2011). For example, BCS is larger for polydisperse AA than for monodisperse aerosol (Andronache, Citation2003). Moreover, BCS depends on the droplet size distribution and rainfall intensity, and ICS also depends on the relative humidity and saturation. Due to the complexity of the processes, a complete understanding is still a challenge, although both phenomena have been extensively studied recently (e.g. Glantz et al., Citation2003; Andronache et al., Citation2006; Collett et al., Citation2008; Chate et al., Citation2011).
The phenomena have been studied using theoretical, modelling and experimental approaches. The experimental data come both from laboratories and several extensive measurement campaigns. However, it is instrument and time demanding to gather information on all the aspects influencing the processes connected to ICS and BCS. Thus, an approach suggested in Yao and Zhang (Citation2012) was selected; the effect of hydrometeors on AA was examined on a database with a large number of AA samples collected during various conditions. The large dataset should help in cancelling out inaccuracies connected to the inhomogeneity in the precipitation and obscurities properties (Laakso et al., Citation2003).
This work describes the influence of BCS and ICS on the submicron number size distribution of AA. As the differences between ICS and BCS are well described in the reports [for example, Andronache (Citation2003) found BCS negligible, when compared to ICS], the aim of this paper was to compare the ICS and BCS effects on real ground-based data. The ICS effect is described on data measured during obscurities, while the BCS conditions are described via data measured during precipitation. Thus, the effects and phenomena taking place during obscurities and precipitation, strongly affecting AA measurements, will be described, and an estimate on the extent of the change connected to precipitation and obscurities will be given.
2. Methods
2.1. Station and instrumentation
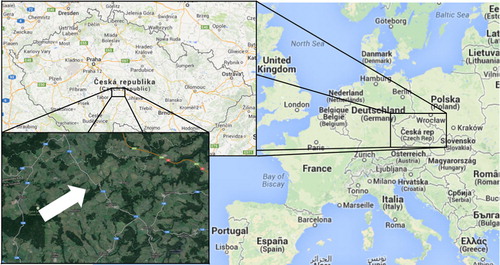
The data were measured at the Košetice observatory (49°35′ N, 15°05′ E, altitude 534 m a.s.l., see ). The station is located about 70 km SE of Prague, in the rural countryside. According to the national classification, it is a rural background station (Váňa and Holoubek, Citation2007). The observatory itself lies in a remote place, about 1.5 km to the nearest small villages (Kramolín and Chýstovice with 7 and 25 inhabitants) and 3 km to the villages Košetice and Křešín with 695 and 150 inhabitants. The landscape is mainly agricultural, with scattered forest. Only local roads and domestic heating could be direct pollution sources.
Fig. 1 Observatory Košetice geographical position. (Maps taken from www.maps.google.com/)
The observatory is a professional meteorological station with additional measurements of air quality. A complete set of the continuously instrumentally measured meteorological variables and gaseous pollutants concentrations are available. Moreover, a professional meteorologist is continuously present at the station. The meteorologist records the weather conditions with one-minute precision, according to the WMO (World Meteorological Organization) international codes, specifically according to WMO Code 4677: Present weather reported from a manned station (WMO, Citation2011).
Since 2008, the station has been equipped with an SMPS (Scanning Mobility Particle Sizer, IfT/TROPOS type) within the EUSAAR/ACTRIS network (Philippin et al., Citation2009). The SMPS determines the submicron particle number size distributions (PNSDs) in the size range between 8.7 and 848.1 nm with the set flow ratio of 1 to 5 lpm for aerosol and sheath flow, respectively. Details on the SMPS set-up can be found in Zikova and Ždímal (Citation2013).
2.2. Data processing
The PNSDs were determined using the IfT/TROPOS scanning program (details in Wiedensohler et al., Citation2012), providing information on the raw mobility size distributions and on the diagnostic parameters of the instrument as well. The diagnostics consist of the values of temperature, relative humidity, absolute pressure and flows of both aerosol and sheath air.
From the raw and diagnostic files, the number size distributions between 10 and 800 nm were computed using TROPinv shareware application software. The TROPinv inversion routine is based on multiple charge inversion (Pfeifer et al., Citation2014) and also contains corrections of condensation particle counter (CPC) counting efficiencies, particle losses in the connecting tubes and inside the SMPS, based on an equivalent pipe length (Wiedensohler et al., Citation2012), and differential mobility analyser (DMA) transfer function. It also allows the flagging and rejection of data outside the recommended range for the diagnostic variables required by the EUSAAR/ACTRIS quality standards. The flagging is applied to the temperature (10–30 °C), relative humidity (0–40%), aerosol flow (1 lpm±5%) and sheath flow (5 lpm±5%) values.
The meteorological data come from the Czech Hydrometeorological Institute (CHMI) database that includes quality checked data only. All the complete records were included in the analysis; otherwise, no further check was performed.
2.3. Data coverage
For the purpose of this study, the PNSDs measured between 1/5/2008 and 30/4/2013 were analysed. The original SMPS time resolution of 5 minutes was preserved. Thus, in total, 525 600 samples were theoretically available. Due to calibrations, maintenance and also hardware failures, there were some intermissions in the dataset present. Moreover, after the quality check, some further data had to be excluded, as they did not fulfil the quality standard requirements described in Section 2.2. Eventually, 437 037 samples were obtained, that is, more than 83% of the data.
No similar intermissions were reported in the meteorological data. However, from the natural principle of the occurrence of meteorological phenomena, the time series were not continuous. In total, 6189 recorded meteorological phenomena events were collected in the 5-year period. From these, 3725 phenomena lasted for at least 1 hour. Shorter durations were excluded from the analysis for the sake of statistics – to have at least 12 SMPS spectra for each event. As a final step, the measured SMPS spectra were assigned to the recorded phenomena. The assignment was done only if the phenomenon was recorded during the whole SMPS scan.
2.4. Phenomena described
The hydrometeors considered are those defined in WMO Code 4677 – Present weather reported from a manned weather station (WMO, Citation2011). The hydrometeors can be divided into two basic groups: obscuration and precipitation. However, not all the phenomena described in the Code table were included in this study. Some of these have not been observed at the station in the studied period (for example spray, volcanic ash), others have only sparse occurrence (hail, ice pellets etc.). The phenomena considered, with their WMO codes, number of recorded events, duration, and also numbers of the respective SMPS scans are presented in .
Table 1. The number of recorded events, numbers of the respective 5-minute SMPS scans, and averaged duration of the phenomena (with their WMO codes) used in this study
The obscuration group consists of mist, fog and shallow fog. Mist is defined as visibility between 1 and 10 km, uniform in all directions, fog is defined as visibility decreased under 1000 m, and shallow fog is a fog with a vertical extent under 2 m.
The precipitation group can be further divided into liquid and solid precipitation. The liquid precipitation group consists of drizzle, rain and rain showers. The main difference among the three phenomena is the sizes of the typical droplets. While drizzle is defined as ‘Very small, numerous and uniformly dispersed, water drops that may appear to float while following air currents’, the rain is described as ‘Precipitation of liquid water particles, either in the form of drops larger than 0.5 mm or smaller drops which, in contrast to drizzle, are widely separated’. The rain showers are described as precipitation that ‘suddenly starts and stops, or there are rapid changes of intensity, and (is) usually characterized by rapid changes in the appearance of the sky’ (WMO, Citation2012). The solid precipitation includes the fall of snowflakes (in the text also described as snow) and rain with snow.
2.5. Connection of meteorological phenomena and air mass history
To analyse the connection between the air mass origin, and phenomena occurrence, the backward trajectories coming to Košetice observatory were computed using the HYSPLIT (Hybrid Single-Particle Lagrangian Integrated Trajectory) model (Draxler and Rolph, Citation2013). The trajectories were computed 72 hours back, based on the NOAA-NCEP/NCAR Reanalysis database. The reanalysis consists of global NCEP/NCAR pressure level reanalysis data, in a HYSPLIT compatible format, on a latitude–longitude grid (2.5°) at 17 pressure levels. The time resolution of the data is 6 hours (Kalnay et al., Citation1996; Draxler, Citation1998).
All the trajectories were clustered into six clusters, according to the total spatial variance analysis. The means of the clusters, with the percentage of the occurrence in the 5-year period are shown in .
Fig. 2 Left: Means of the six air mass clusters coming to the Košetice observatory. The markers denote 6-hour time intervals. Right: number of occurrence of trajectories in individual clusters during the 5-year measurement period.
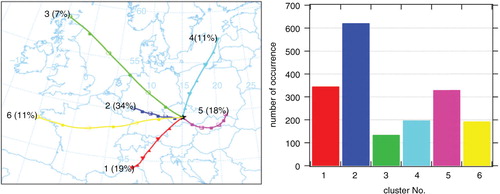
For the description of the individual clusters, mainly in the means of synoptic origin, the clusters were compared with the synoptic types recorded for every day in the CHMI (Racko, Citation2014) according to the Catalogue of synoptic types for the Czech Republic (HMU, Citation1986), so it is possible to determine the meteorological origin of the air masses in the individual clusters.
For every cluster, the number of the occurrence of individual phenomena was computed. For each of the 1826 available days, one trajectory, coming to the station at 06:00, was computed. The air mass origin computed in the morning was ascribed to the whole day. This simplified (and not valid during, for example, atmospheric fronts passage) scheme was chosen due to the limited number of trajectories to be clustered in the HYSPLIT model. Further, the numbers of cases were divided by the number of days in individual clusters, as the number of trajectories in the clusters is not constant (see right). The frequency of the occurrence of individual phenomena in the clusters can be seen in .
Fig. 3 Number of occurrences of individual phenomena during air masses coming from the six clusters. Top: number of occurrences of mist, fog and shallow fog. Middle: number of occurrences of drizzle, rain and rain showers. Bottom: number of occurrences of snow and rain with snow.
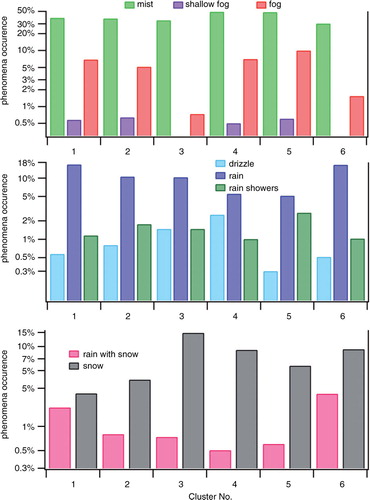
From the comparison, the connection of different air masses to different phenomena is quite visible. Fog and shallow fog tend to have lower frequency in air masses from clusters 3 and 6 (air masses connected to cyclonic conditions) and higher frequency in air masses in cluster 4 (anticyclone over Scandinavia) and 5 (anticyclone over Eastern Europe or a weak pressure field). The difference in mist occurrence is somehow lower. See Section 3.5 for more on the mist observation ambiguity.
The frequencies of liquid precipitation depend strongly on the precipitation type; while rain occurs mainly in air masses from clusters 1 and 6 (connected to cyclonic situations; with cyclones either above Central Europe, or over Iceland), drizzle is brought mainly by air masses typical for anticyclonic situations in cluster 4, and similarly rain showers are most frequent in cluster 5 air masses.
Liquid and solid precipitation exhibits different dependence on air masses as well. The frequency of rain with snow is similar to those of rain, that is, higher frequencies in clusters 1 and 6 air masses. Snow was recorded more commonly in cluster 3 air masses – fast air masses bringing air from the Atlantic Ocean during cyclonic situations.
3. Results and discussion
3.1. Differences in the concentration and PNSDs measured during individual phenomena
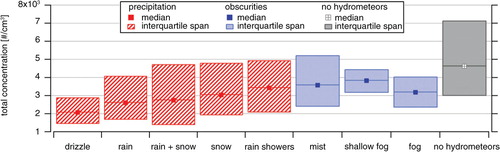
Both obscurities and precipitation have a strong influence on AA concentrations – the total number concentrations measured during any mentioned phenomenon are lower than the concentrations measured at the time when no hydrometeors were observed (). Generally, during precipitation events, concentrations are lower than during obscurities. However, there is a further variability among the individual phenomena. For example, concentrations measured during fog are lower than those during rain showers. The lowest total concentrations were measured during drizzle events.
Fig. 4 Box plots of the total number concentration of AA measured during individual meteorological phenomena and during periods without the presence of hydrometeors. The marker shows the median, and the box indicates the interquartile span.
The difference in the effect of hydrometeors on AA is not only in the terms of total concentrations. Both precipitation and obscuration have a strong influence on PNSDs. The typical spectra for periods without the presence of hydrometeors and for obscurities and precipitation events were computed and compared to one another ().
Fig. 5 Median (lines) and interquartile span (bars) of typical spectra during individual meteorological phenomena, as compared to the typical spectrum recorded without any hydrometeor (grey area). Obscurities are in the first row, highlighted with a blue dashed rectangle; precipitations are highlighted with the red solid line. The number (#) is the number of averaged SMPS spectra.
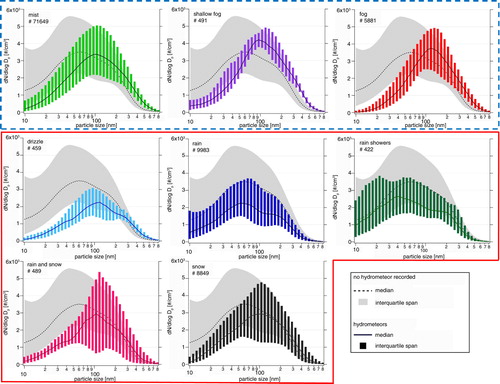
Three conclusions can be drawn from the comparison of the PNSDs fitted with a lognormal distribution (the same approach was used also for all the other mode fitting). Firstly, the presence of hydrometeors changes the number of modes on the PNSDs. Without the presence of hydrometeors, the distribution median is bimodal (modes at 61 and 198 nm). During obscurities, monomodal PNSD is observed; during precipitation, a bimodal or trimodal distribution is present (). Secondly, if any phenomenon is observed in the atmosphere, the PNSD is shifted to the larger particles, and concentrations of particles smaller than 50 nm are considerably lower (the median of PNSDs during meteorological phenomena is even below the 1st quartile of the PNSDs without any hydrometeor recorded). Thirdly, the concentration in the accumulation mode sizes (about 100 nm) is the highest during obscurities for all three rated quartiles and is higher also for all the particles larger than 100 nm. It is in agreement with the conclusions from Yu et al. (Citation2011), showing the dominant mode peaking at 110–250 nm during haze–fog days. It is also interesting that the 1st quartile of PNSDs is bimodal without any exception during all the phenomena and during periods without hydrometeors as well.
In the following sections, the effects of hydrometeors on PNSDs are discussed within the obscuration and precipitation group, comparing the individual phenomena with one another.
3.2. Obscurities
During obscurities, AA particles tend to have a sharper distribution with strongly prevailing accumulation mode with concentrations higher than during periods without any hydrometeor recorded. On the contrary, when compared to non-hydrometeor spectra, concentrations of particles smaller than 80 nm are lower during obscurities.
The medians of PNSDs show a shift in the mode position of the median of the concentrations towards larger particles during obscurities. While the typical non-event spectrum peaks at 61 nm, the spectrum recorded during fog episodes peaks at 121 nm, during mist at 101 nm and 90 nm during shallow fog. This shift towards larger particles in the accumulation mode would most probably be a result of the increase of secondary aerosol mass by condensational growth since particles in this size range contain significant amounts of inorganic salts like ammonium sulphate and/or nitrate (Ervens et al., Citation2011).
The shape of the medians of PNSDs during fog and shallow fog is similar to each other in sizes from 120 to 800, but there are more particles in sizes below 120 nm during shallow fogs. What is mainly interesting is that, during shallow fog, the inlet of the SMPS is over the fog layer, whereas during a fog episode, it is within the fog. The similarity in larger particles between the individual obscurity types may be explained via the suppression of convection and turbulence during all the events; thus, the re-suspension of particles from the surface is decreased, independently of the obscurity type. The difference in the concentration of particles below 120 nm could be explained by the occurrence of 80 nm mode particles, probably from the gas-to-particle conversion processes in the vicinity of fog top, also reported in Heintzenberg et al. (Citation2006), or from the aqueous reactions in the fog drops that might transform soluble volatile organic compounds into lower volatility secondary organic aerosol species (Collett et al., Citation2008).
As for the comparison of interquartile spans, it is important to remember that the number of observations of mist was larger by about one order of magnitude, when compared to fog, and by about two orders of magnitude, when compared to shallow fog. So the larger interquartile span is not surprising, and one would even expect much larger differences. On the contrary, in sizes above 200 nm, the interquartile span is actually almost identical between fog and mist, and also in sizes between 10 and 40 nm the interquartile span values are comparable between individual obscurity types. It suggests that there is a typical PNSD to which the PNSDs converge at any mist/fog/shallow fog event.
The differences in the influences of individual types of obscurities can be ascribed to various concentrations of droplets and to various droplet size distributions as well. These variables affect the removal of AA from the atmosphere, as well as its reactions. Unfortunately, additional information on droplet size was not available.
3.3. Precipitation
Precipitation, compared to the obscurities, had a shorter duration (), and larger droplet sizes are assumed. There is a further difference between liquid and solid precipitation in duration, droplet size, settling velocity, droplet surface (and thus also cross-section) area etc. So the effect of precipitation on AA is also divided into a part describing the effects of liquid precipitation and a part describing precipitation containing solid particles.
3.3.1. Liquid precipitation
Liquid precipitation phenomena differ from each other mainly in the droplet sizes, intensities, duration and the settling velocity of the droplets, influencing the contact time for the wet deposition of AA.
During liquid precipitation events, the PNSDs are considerably lower as compared to non-event periods. The position of the main mode shifts from 39 nm for rain showers to 52 and 118 nm for rain and drizzle, respectively. The second modes are shifted in a similar manner. It is in a negative correlation with the expected droplet size – the larger the droplets of the phenomenon are, the smaller the AA particles in the main mode are. For the second mode positions, however, this relationship is not valid. The position of the second mode is similar for rain and rain showers, and shifted to the right for drizzle events. During drizzle, an inclination of the third mode is also visible. The mode corresponds to the 39 nm mode during rain showers and suggests that the scavenging of particles in the sizes between 50 and 200 nm is not so effective. From the correspondence of the median of the PNSDs during rain, and the first quartile of the non-event PNSDs, we conclude that the lowest non-event PNSDs were measured in the time period directly after a rain event. It confirms the empirically known fact that the ‘cleanest’ air can be measured after a rain event. This finding was confirmed by the comparison of non-event data measured in the first 15 minutes after rain episodes, having PNSDs almost identical to those of 1st quartile of non-event PNSDs.
When comparing PNSDs during rain and rain showers, the spectra are similar to each other for particles larger than 60 nm. When discussing particles in nucleation and Aitken mode, the situation changes considerably. The median of the concentrations of particles smaller than 60 nm is almost twice as high during rain showers as it is during rain. A similar feature is visible in 3rd quartile values, with a prevailing new mode peaking at about 25 nm. This could be due to a process of gas-to-particle conversion taking place in a very clean environment with a lower condensation sink in the breaks from the precipitation during the rain showers period.
Interquartile spans measured during individual liquid precipitation phenomena show large discrepancies. The interquartile span of PNSDs during rain is in a good agreement with the interquartile span during rain showers for particles larger than 70 nm. For particle sizes below 70 nm, the interquartile span is higher during rain showers, suggesting that there are some additional processes taking place during rain showers, which are not present during rain. The interquartile span measured during drizzle is narrower, mainly in sizes below 50 nm and above 200 nm. The reason should not be in a lower number of observations or in the duration, as both of these characteristics are comparable with those of rain showers. The explanation could be not in the scavenging by drizzle itself, but in the conditions favourable to the appearance of drizzle. Further analyses in this work show that there was only a minor (or even no) decrease in concentrations after a drizzle outset (Section 3.4.).
3.3.2. Liquid and solid precipitation
The main focus of this section was on the dependence of the size-dependent removal of AA on the presence of solid precipitation in the atmosphere. During winter, the share of solid precipitation at the station is not negligible and contributes markedly to the overall wet removal.
In terms of the medians of PNSDs, the influence of the phenomena is different in three different size classes of AA particles. The first class consists of particles in sizes from 10 to 20 nm, having the lowest concentrations during snow or snow mixed with rain. Thus, in this size range, the presence of solid hydrometeors increases the removal. The effect is connected with the different collision efficiency for snowflakes and raindrops, and also a filtering effect of the holes in the snowflakes reported in Mitra et al. (Citation1990). According to the filtration theory, the effect will be strongest for the smallest particles, which could explain considerably lower concentrations of particles smaller than 20 nm (). Another explanation could be in a higher charge on droplets during liquid precipitation, making the neutralizer in the SMPS unable to neutralize the aerosol completely, and resulting in higher measured concentrations in this size range. The second class consists of particles in sizes from 20 to 60 nm that have the same concentrations during rain and snow events; lower concentrations were recorded during mixed precipitation. It is in agreement with Paramonov et al. (Citation2011), who reported more efficient scavenging when the snow is mixed with rain, due to the higher temperatures making snowflakes stickier and larger (resulting also in higher terminal velocity), and also a more pronounced positive correlation between the precipitation rate and scavenging for particles in the nucleation and Aitken modes. The third-class particles in sizes between 60 and 800 nm are most efficiently removed during rain. The difference in the removal by solid or mixed precipitation is almost negligible, and for the particles larger than 200 nm, the concentrations do not differ from those recorded without any hydrometeors, suggesting the removal of these particles by snow is not efficient.
3.4. Change in the number concentration
From the comparisons, it was evident that AA PNSDs measured both during obscurities and precipitation differ significantly from the periods without the recorded presence of hydrometeors. The question is, however, if the difference is due to the effect of the phenomena themselves, or due to the conditions that are connected to the phenomena occurrence. To answer the question, the change in concentrations after the phenomena formation was quantified.
The quantification of the change was based on the ratio of concentrations measured directly before and at the beginning of the phenomenon. As the concentration before phenomenon, the mean values from a 1-hour period before the phenomenon was firstly observed were considered (if at least 6 out of the 12 theoretically obtainable data points were available). Similarly, the mean concentration in the first hour of the phenomenon was considered as the initial value. The ratio is presented as value p, that is,2
Thus, if the ratio (given in percent) is positive, it shows an increase in concentrations after the appearance of the phenomenon; if it is negative, there has been a decrease. It should be remembered that the changes in concentrations during both precipitation and obscurities are not only the results of hydrometeors processing the AA. Independently of the hydrometeor type, there are instrumental errors, turbulence, advection, local pollution sources, mixing of the boundary layer with clouds, condensation, nucleation, coagulation etc. Many of the processes can be enhanced/suppressed during precipitation/obscurities, so there is some dependence on the hydrometeor type.
The p value was counted from the total number concentrations and from the cumulative concentrations corresponding to the typical PNSD modes as well. The size class from 10 to 20 nm was chosen as a representative of a nucleation mode, the class from 20 to 50 nm as an Aitken mode, the 50–200 nm mode as an accumulation mode and the size class from 200 to 800 nm as a droplet mode. In , the median and interquartile span of the change can be seen for all the considered obscurities and precipitations. All the p values were tested with the Wilcoxon sum rank test with the null hypothesis that the data come from a distribution whose median is zero at 5% significance (i.e. no change during the phenomenon duration). Those p values, for which it was possible to reject the null hypotheses, are plotted in with the filled median symbol.
Fig. 6 The box plot of change in concentrations after the appearance of obscurities, and both liquid and solid precipitation in individual cumulative size intervals. The markers denote the median of the change, box boundaries denote the 1st and 3rd quartiles, and the size of the boxes indicates the value of the interquartile span. The filled markers denote a statistically significant change.
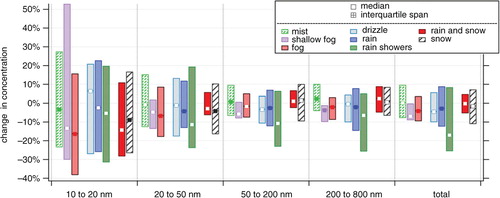
From , it is evident that the change in concentration p is strongly size dependent, and there are also visible differences between obscurities and precipitations. The largest decrease in concentrations was reported for the nucleation mode. However, statistically significant change was found only for mist, fog and snow. Liquid precipitation does not seem to be efficient in AA removal. This can be due to the larger variability in concentrations of the 10–20 nm particles, and/or also due to the lower counts of particles in this size range, increasing the uncertainty of the measurement.
The only size interval in which all the phenomena report decrease in concentrations is the Aitken mode, even though the decrease is not strong as it is in the nucleation mode (4.4% in average). It is in accordance with the results of scavenging coefficients (see Section 3.6) that are the highest in these two mentioned modes (see left). In the Aitken mode, similarly to the nucleation mode, AA is also effectively removed by fog. The result differs from those of Noone et al. (Citation1992), who reported an increase of particles below 300 nm after the fog creation, and a decrease of particles larger than 300 nm (and total concentrations as well). The reason for the discrepancy could be the aged aerosol present at the background station, as compared to the fresh aerosol in the Po valley evaluated by Noone et al. (Citation1992). Glantz et al. (Citation2003) drew a similar conclusion as this study; according to them, particles smaller than 100 nm are the dominant formation agents of cloud droplets, and they also reported activation in the Aitken mode sizes. Apart from the removal by fog, also rain and snow are effective in the removal of Aitken mode particles.
The concentrations of particles in the accumulation and droplet mode show mild decreases in the concentrations (2.5 and 1% on average). The accumulation particles are statistically significantly removed only by rain – no other precipitation or obscuration seems to provide a statistically significant change in concentration. It is probable that the decrease of the concentrations of these particles during other phenomena is partly masked by the growth of smaller activated particles. In the droplet mode, the AA is removed also by fog and shallow fog. A cause for concern is the increase in the concentration of particles between 50 and 800 nm after the appearance of mist. One possible explanation could be a desultory observation of mist and haze. So after the mist appearance, instead of the observation of wet removal by hydrometeors, the particles lowering the visibility are sampled. The total concentrations show a decrease only during rain and fog; the other changes are statistically insignificant.
3.5. Change in the number concentration with time
As a next step of the analysis, the time evolution of the changes of the concentration during the whole duration of the obscurities and precipitation was computed. The time evolution of the concentrations (both integral concentrations in the size classes 10–20, 20–50, 50–200, 200–800 nm and total concentrations) was fitted with an exponential fit3
and the standard error of the regression was computed. The result is the slope a of the concentration curve, that is, the rate of the change in the concentration. If the slope a is positive, there was an increase in the concentrations with time; zero values denote no change in the concentrations with time, and negative values indicate a decrease in the concentrations. The a value depends not only on the hydrometeor type; it is dependent on AA particle size as well. So, like in Section 3.4, the a values were calculated for the total concentration and for size classes representing the typical AA modes. Further, only a subset of the events was used: for each event, the nucleation mode concentrations time series fitted with an exponential decrease of concentration was visually examined, and only those events clearly corresponding to the exponential fit were considered. Thus, only those events with no detected nucleation, and with the scavenging acting as the main factor, were considered. Due to the low number of events in the subset, some of the phenomena were not considered. Only mist, fog, rain and snow had enough events (185, 41, 56 and 36, respectively), and the median and interquartile span of the concentration change are plotted in . All the values were again tested with the Wilcoxon rank sum test with the null hypothesis that the data come from a distribution whose median is zero at 5% significance (i.e. no change during the phenomenon duration). At the 5% significance level, it was possible to reject the hypothesis for most of the size classes and phenomena in the subset. The medians of those a values, for which it was possible to reject the null hypothesis, are plotted in with a filled symbol. All the statistically significant changes in the concentrations were negative, denoting a decrease in the concentrations.
Fig. 7 The dependence of medians (markers) and interquartile span (bars) of the change of cumulative concentrations in time on particle size classes for individual obscurities and precipitation. A statistically significant change is denoted with filled markers.
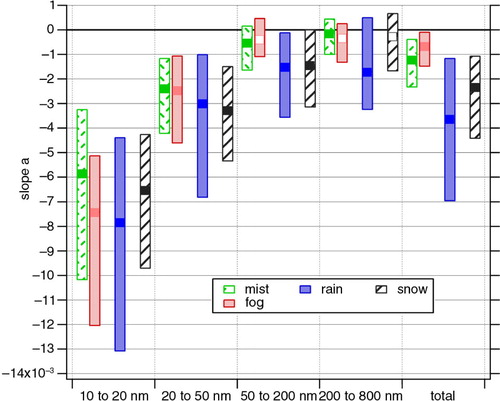
In the smallest particle (10–20 nm) size class, the recorded change was statistically significant during all the considered phenomena. The removal rate was similar during rain and fog and slightly slower during mist and snow. Particles in sizes from 20 to 50 nm, representing Aitken mode, are removed less efficiently, but again by all the selected hydrometeors. During fog and mist, the removal rate is comparable. During precipitation, the removal rate is higher than during obscurities and is comparable for rain and snow. Slower changes in concentrations were recorded for particles in the accumulation mode, with the exception that mist remains an effective removal agent, whereas fog was found to be insignificant. On the contrary, rain and snow remove particles effectively. Rain and mist effectively remove particles of the droplet mode as well. Considering the total concentrations, the statistically significant decrease in concentration is evident during mist, fog, rain and snow as well.
If the whole dataset was considered, that is, also during the period when wet removal was not the main factor affecting the AA concentration change, the number of statistically significant changes in time decreased (not shown). In the smallest particle size class, the recorded change was statistically significant only during fog. Particles in sizes from 20 to 50 nm are removed slightly more efficiently, but again only via obscurities. During precipitation, these particles do not seem to be removed. Comparable changes in concentrations were recorded for particles in the accumulation mode; mist remains an effective removal agent, fog was found to be insignificant, and rain removes particles effectively. Rain is also the only phenomenon effectively removing particles of the droplet mode. Considering the total concentrations, a statistically significant decrease in concentration is evident during mist, fog and rain. Thus, it can be concluded that during mist, the wet removal is the main process for AA in sizes between 20 and 200 nm, for fog between 10 and 50 nm and for rain in sizes between 50 and 800 nm. The other AA sizes are also strongly influenced by other phenomena.
3.6. Scavenging coefficient
Finally, a description of the evolution of the concentrations during the phenomena is given, based on the scavenging coefficient λ
s
, representing the fraction of AA removed by precipitation in unit time for a certain aerosol particle diameter. It can be computed from the experimental data according to the equation given, for example, in Laakso et al. (Citation2003):1
where t 1 and t 0 is the time of the two subsequent measurements, and c 1 and c 0 are the concentrations of AA particles of diameter dp at the corresponding times. For the purpose of this study, the coefficient was computed from the 5-minute data (i.e. t–t 0=5 min) for each event longer than 60 minutes. From the same subset as in Section 3.5, the size dependent λ s for each of the event was computed, and the size-dependent medians of these values were calculated (). The 5th and 95th percentile of the values were also provided in for an easier comparison with other authors.
Fig. 8 The size-dependent scavenging coefficient of meteorological phenomena. Left: obscurities; middle: rain; right: snow. The markers stand for the median; the area between lines (1st and 3rd quartiles) shows the interquartile span. The negative values of the 1st quartile are not shown in the plot.
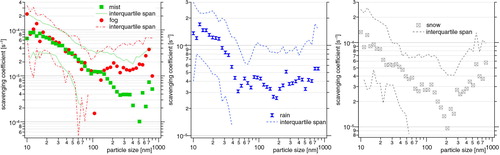
Table 2. Scavenging coefficients in the size range from 10 to 800 nm (5th–95th percentile) for obscurities and precipitation, as compared to other studies
From the comparison of λs, it is evident that obscurities and precipitation act differently from solid particles containing precipitation during the wet removal of AA particles. Mist and fog (no shallow fog data passed the subset conditions) have λs between 1×10⁻⁴ and 1×10⁻⁶ s−1, with a minimum at particle sizes at about 100 nm for fog, and between 250 and 500 nm for mist ( left). The λs values are similar for both mist and fog in sizes below 150 nm. For larger particles, fog is a more efficient removal agent than mist. Similar results can be drawn from a p values analysis (). When compared to precipitation, the obscurities show about 50% lower λs than for rain, limiting the lifetime of AA particles less strongly than precipitation.
The λs of rain shows a minimum in scavenging (the so-called Greenfield gap based on Greenfield, Citation1957) at about 100 nm, which corresponds well to the results of Laakso et al. (Citation2003). For snow, the Greenfield gap can be found at about 200 nm particles, that is, in good agreement with the shape of the theoretical curves and parameterizations of λs (Zhang et al., Citation2013). The shape of the snow λs dependence on particle size agrees well with the results of Kyrö and Grönholm (Citation2009) good agreement was found also with results of Paramonov et al. (Citation2011), only with slightly higher values for snow. The reason could be in the higher temperatures during our measurement as compared to those of Paramonov et al., who also found a direct dependence between λs and temperature. Generally, the comparison of our results to other authors’ work is more than satisfying, taking into account that the differences can be up to factor 3–5 due to various rainfall intensity and raindrop number size distribution (Wang et al., Citation2010).
4. Conclusions
The 5 years of PNSDs measured at rural background station were compared with professional meteorological records according to the WMO Code book to see the changes in PNSDs during obscurities and precipitation. As for obscurities, mist, fog and shallow fog were considered; the representatives of precipitations were drizzle, rain showers, rain, snow and rain with snow.
To quantify whether the change in the PNSDs is due to the effect of the phenomena themselves, or due to the conditions that are connected to the phenomena occurrence, the change in concentrations p before and at the beginning of the phenomenon was computed. To quantify the rate of change of AA concentrations in time, the slope a (a measure of the exponential decrease of the concentration with time) was computed. And to be able to compare our results to other authors’ work, the scavenging coefficient λ s was added to the analysis.
It was found that both obscurities and precipitation have a strong influence on AA concentrations; the total number concentrations measured during any mentioned phenomenon are lower than the concentrations measured at the time when no meteorological phenomenon was observed. During precipitation events, total concentrations are lower than during obscurities. The λs coefficient is about 50% lower for obscurities than for precipitation. Thus, the lifetime of AA particles is limited less strongly by obscurities than by precipitation.
The changes also depend on AA particle size, so precipitation and obscuration have a strong influence on PNSDs; their presence even changes the number of modes on the PNSDs. Without any phenomenon, the distribution median is bimodal. During obscurities, monomodal PNSD is observed. During liquid precipitation, the number of peaks depends on the individual precipitation types. During rain, snow, rain with snow, and rain showers, bimodal spectra were recorded; during drizzle, a third mode tends to form.
If any of the phenomena is observed in the atmosphere, the PNSD main mode is shifted to the larger particles, and concentrations of particles smaller than 50 nm in diameter are considerably lower. According to the a value analysis and the change in number concentrations in the nucleation and Aitken modes, the wet scavenging is not the main process influencing AA concentrations; there is almost no change for obscurity or precipitation (except for fog and mist), if the data are not carefully separated into subsets. In the subset, where no nucleation, advection or local pollution influences the concentration, the statistically significant decrease rate a was recorded, and the scavenging coefficient was found to be over 1×10⁻⁴ s−1. Thus, the hydrometeors are effective in nucleation mode particle removal, but other phenomena can dominate over the wet removal.
During obscurities, the concentrations of AA particles smaller than 80 nm are lower than during periods without any phenomenon recorded; on the contrary, concentrations of the strongly prevailing accumulation mode are higher (the position of the mode differs slightly with the individual phenomenon). The quite narrow interquartile span recorded during all three obscurities suggests a typical PNSD to which the PNSDs converge at any mist/fog/shallow fog event. During mist and fog, a statistically significant change in the concentrations of nucleation mode particles was recorded, with fog influencing the AA concentrations more than mist. In the Aitken mode, a decrease of concentrations was visible both during mist and fog, with a comparable effect. The activation of such small particles is possible because the aerosol present at the background station is already aged, transported from distant sources. The accumulation and droplet mode particle concentrations do not change significantly during any obscurity. The exception is mist, during which an increase of concentrations after the appearance of the phenomenon was recorded. It is possible, however, that instead of observation of wet removal by hydrometeors, the particles lowering the visibility are sampled during these episodes, due to the imperfect observation by meteorologists. This theory is supported by the significant decrease of concentrations with time, calculated by the slope a, proving mist scavenges particles efficiently.
During any liquid precipitation event, the PNSDs are considerably lower as compared to non-event periods. The shape of the PNSDs of AA during liquid precipitation depends on the size of the droplets. The larger the droplets of the phenomenon are, the smaller the AA particles in the main mode of the bimodal PNSDs are. During drizzle, also an inclining of the third mode peaking at 39 nm is visible. The mode corresponds to the 39 nm mode during rain showers and suggests a less effective scavenging of particles in sizes between 50 and 200 nm by drizzle, or even some source of particles in this size range (probably the growth and activation of Aitken mode particles). For these particles, the only significant removal agent was found to be rain. For particles larger than 60 nm, the PNSDs during rain and rain showers are similar to each other. For particle sizes below 60 nm, the median of the concentrations is almost twice as high during rain showers as it is during rain, and also the interquartile span is significantly higher during rain showers, suggesting some additional processes taking place during rain showers, which are not present during rain. This could be a process of gas-to-particle conversion taking place in a very clean environment with a lower condensation sink in the breaks from the precipitation during the rain showers period.
Precipitation containing frozen hydrometeors behaves differently from liquid precipitation. In the nucleation mode size range, the presence of solid hydrometeors increases the wet removal, although the removal rate is higher for rain. In the Aitken mode, the same concentrations were recorded during rain and snow events; lower concentrations were recorded during mixed precipitation. However, the change in the concentrations after the start of the phenomenon shows a significant decrease only during rain and snow. With sizes of AA larger than 50 nm, the solid precipitation is less effective in AA removal, and the difference between solid or mixed precipitation is almost negligible. The concentrations of AA particles larger than 200 nm do not differ from non-event cases, suggesting insignificant scavenging, or rather other processes influencing the concentrations more efficiently than scavenging.
Supplementary Figure 1
Download JPEG Image (758.2 KB)
Supplementary Figure 2
Download JPEG Image (1.6 MB)
Supplementary Figure 3
Download JPEG Image (1.3 MB)
5. Acknowledgements
The long-term monitoring of PNSDs would not be possible without financial support of EU infrastructural project ACTRIS (FP7-262254); data analysis and preparation of this manuscript was financially supported by Czech Science Foundation, project no. P209/11/1342; and at the final stage of manuscript preparation, this work has received funding from the EU Horizon 2020 Research and Innovation Program under Grant Agreement No. 654109. The authors would also like to thank Dr. Jakub Ondráček for SMPS service, and Dr. Milan Váňa and his colleagues from the Czech Hydrometeorological Institute, especially Adéla Šmejkalová Holubová from the Košetice observatory, for providing the meteorological data and their assistance with operating the SMPS. We also thank Sean Mark Miller, MA, for correcting the text.
Notes
To access the supplementary material to this article, please see Supplementary files under ‘Article Tools’.
References
- Andronache C . Estimated variability of below-cloud aerosol removal by rainfall for observed aerosol size distributions. Atmos. Chem. Phys. 2003; 3(1): 131–143.
- Andronache C. , Grönholm T. , Laakso L. , Phillips V. , Venalainen A . Scavenging of ultrafine particles by rainfall at a boreal site: observations and model estimations. Atmos. Chem. Phys. 2006; 6: 4739–4754.
- Chate D. M. , Murugavel P. , Ali K. , Tiwari S. , Beig G . Below-cloud rain scavenging of atmospheric aerosols for aerosol deposition models. Atmos. Res. 2011; 99(3–4): 528–536.
- Chate D. M. , Pranesha T. S . Field studies of scavenging of aerosols by rain events. J. Aerosol. Sci. 2004; 35(6): 695–706.
- Chate D. M. , Rao P. S. P. , Naik M. S. , Momin G. A. , Safai P. D. , co-authors . Scavenging of aerosols and their chemical species by rain. Atmos. Environ. 2003; 37(18): 2477–2484.
- Collett J. L. , Herckes P. , Youngster S. , Lee T . Processing of atmospheric organic matter by California radiation fogs. Atmos. Res. 2008; 87(3–4): 232–241.
- Depuydt G. , Masson O. , Brenguier J. L. , Piot C. , Jaffrezo J. L . Below-cloud scavenging by snow and mixed precipitation events calculated from high temporal resolution in situ measurements. European Aerosol Conference 2013 Book of abstracts. 2013. Prague, 1–6 September 2013. Online at: http://eac2013.cz/EAC abstracta/Atmospheric Aerosols/Depuydt-Guillaume_Atmospheric Aerosol_20130227-164948_7829639464.pdf .
- Draxler R. R . An overview of the HYSPLIT 4 modelling system for trajectories, dispersion, and deposition. Aust. Meteorol. Mag. 1998; 47: 295–308.
- Draxler R. R. , Rolph G. D . HYSPLIT (HYbrid Single-Particle Lagrangian Integrated Trajectory). 2013. NOAA Air Resources Laboratory, College Park, MD. Online at: http://www.arl.noaa.gov/HYSPLIT.php .
- Ervens B. , Turpin B. J. , Weber R. J . Secondary organic aerosol formation in cloud droplets and aqueous particles (aqSOA): a review of laboratory, field and model studies. Atmos. Chem. Phys. 2011; 11(21): 11069–11102.
- Glantz P. , Noone K. J. , Osborne S. R . Scavenging efficiencies of aerosol particles in marine stratocumulus and cumulus clouds. Q. J. R. Meteorol. Soc. 2003; 129(590): 1329–1350.
- Graedel T. E. , Franey J. P . Field measurements of submicron aerosol washout by snow. Geophys. Res. Lett. 1975; 2(8): 325–328.
- Greenfield S . Rain scavenging of radioactive particulate matter from the atmosphere. J. Atmos. Sci. 1957; 14: 115–125.
- Heintzenberg J. , Leck C. , Birmili W. , Wehner B. , Tjernstrom M. , co-authors . Aerosol number–size distributions during clear and fog periods in the summer high Arctic: 1991, 1996 and 2001. Tellus B. 2006; 58(1): 41–50.
- HMÚ. Katalog povětrnostních situací pro území ČSSR/Catalogue of synoptic types for the CSSR. 1968. HMÚ, Praha..
- Kalnay E. , Kanamitsu M. , Kistler R. , Collins W. , Deaven D. , co-authors . The NCEP/NCAR 40-Year Reanalysis Project. Bulletin of the American Meteorological Society. 1996; 77(3): 437–471.
- Kyrö E. , Grönholm T . Snow scavenging of ultrafine particles: field measurements and parameterization. Boreal Environ. 2009; 14: 527–538.
- Laakso L. , Grönholm T. , Rannik Ü. , Kosmale M. , Fiedler V. , co-authors . Ultrafine particle scavenging coefficients calculated from 6 years field measurements. Atmos. Environ. 2003; 37(25): 3605–3613.
- Ladino L. , Stetzer O. , Hattendorf B. , Günther D. , Croft B. , co-authors . Experimental study of collection efficiencies between submicron aerosols and cloud droplets. J. Atmos. Sci. 2011; 68(9): 1853–1864.
- Maria S. F. , Russell L. M . Organic and inorganic aerosol below-cloud scavenging by suburban New Jersey precipitation. Environ. Sci. Technol. 2005; 39: 4793–4800.
- Mitra S. K , Vohl O. , Ahr M. , Pruppacher H. R . A wind tunnel and theoretical study of the melting behavior of atmospheric ice particles. IV: Experiment and theory for snow flakes. J. Atmos. Sci. 1990; 47(5): 584–591.
- Noone K. , Ogren J. , Hallberg A . Changes in aerosol size and phase distributions due to physical and chemical processes in fog. Tellus B. 1992; 44(5): 489–504.
- Paramonov M. , Groenholm T. , Virkkula A . Below-cloud scavenging of aerosol particles by snow at an urban site in Finland. Boreal Environ. Res. 2011; 16: 304–320.
- Pfeifer S. , Birmili W. , Schladitz A. , Müller T. , Nowak A. , co-authors . A fast and easy-to-implement inversion algorithm for mobility particle size spectrometers considering particle number size distribution information outside of the detection range. Atmos. Meas. Tech. 2014; 7(1): 95–105.
- Philippin S. , Laj P. , Putaud J. P. , Wiedensohler A. , De Leeuw G. , co-authors . EUSAAR – An unprecedented network of aerosol observation in Europe. Earozoru Kenkyu. 2009; 24(2): 78–83.
- Racko S . Typizace povetrnostnich situaci pro uzemi Ceske republiky. 2014. Online at: http://www.chmi.cz/portal/dt?menu=JSPTabContainer/P4_Historicka_data/P4_1_Pocasi/P4_1_12_Typizace_situaci .
- Seinfeld J. H. , Pandis S. N . Atmospheric chemistry and physics: from air pollution to climate change. 1998; Hoboken, NJ: Wiley.
- Slinn W. G. N. , Hales J. M . A reevaluation of the role of thermophoresis as a mechanism of in- and below-cloud scavenging. J. Atmos. Sci. 1971; 28(8): 1465–1471.
- Vána M. , Holoubek I . Košetice observatory–20 years. 2007; Czech Hydrometeorological Institute, Prague.
- Wang X. , Zhang L. , Moran M. D . Uncertainty assessment of current size-resolved parameterizations for below-cloud particle scavenging by rain. Atmos. Chem. Phys. 2010; 10(12): 5685–5705.
- Wiedensohler A. , Birmili W. , Nowak A. , Sonntag A. , Weinhold K. , co-authors . Mobility particle size spectrometers: harmonization of technical standards and data structure to facilitate high quality long-term observations of atmospheric particle number size distributions. Atmos. Meas. Tech. 2012; 5(3): 657–685.
- WMO . WMO code 4677: Present weather reported from a manned station. 2011; Bremerhaven: PANGAEA.
- WMO. Manual on codes – International codes, Volume I.1: Part A – Alphanumeric codes. 2012; Geneva, Switzerland: WMO.
- Yao X. H. , Zhang L . Supermicron modes of ammonium ions related to fog in rural atmosphere. Atmos. Chem. Phys. 2012; 12(22): 11165–11178.
- Yu X. , Zhu B. , Yin Y. , Yang J. , Li Y. , co-authors . A comparative analysis of aerosol properties in dust and haze–fog days in a Chinese urban region. Atmos. Res. 2011; 99(2): 241–247.
- Zhang L. , Wang X. , Moran M. D. , Feng J . Review and uncertainty assessment of size-resolved scavenging coefficient formulations for below-cloud snow scavenging of atmospheric aerosols. Atmos. Chem. Phys. 2013; 13(19): 10005–10025.
- Zikova N. , Ždímal V . Long-term measurement of aerosol number size distributions at rural background station Košetice. Aerosol Air Qual. Res. 2013; 13(5): 1–11.