
Abstract
Ultrafine particles in the atmosphere may have important climate and health effects. As they are below visible size and not visible for remote sensing techniques, the majority of observations thus come from ground-based measurements. Some of those observations indicate elevated sources for ultrafine particles. Here we present for the first time airborne measurements of number concentration and size distributions of ultrafine particles along defined flight paths across Germany, allowing to derive background concentrations and to identify major single sources. A significant impact of fossil fuel–related emissions on background and maximum concentrations was found. Maxima reaching up to 90 000 particles cm−3 were encountered in plumes of single large sources extending over more than 200 km. Modelling shows that about 10–40 % of Germany were continuously affected by such plumes. Regional-scale transport and boundary layer dynamics were identified as major factors controlling spatial and temporal patterns of size and number distributions.
1. Introduction
Ultrafine particles (UFPs) in the air are suggested to have significant impact on climate and health. Too small to be visible and undetectable for remote sensing techniques, they are affecting on a regional scale the number concentration of cloud condensation nuclei (CCN) and subsequently cloud optical properties and rainfall distributions (Laaksonen et al., Citation2005; Pierce and Adams, Citation2007; Junkermann et al., Citation2011b; Kerminen et al., Citation2012; Sporre et al., Citation2014; Junkermann and Hacker, Citation2015). Bister and Kulmala (Citation2011) even hypothesised an impact of UFPs on upper tropospheric water vapour from nucleation mode particles.
Health issues of particulate mass are normally linked to fine particles like PM10 and PM2.5 (Oberdörster et al., Citation2005; Pope, Citation2007; Pope et al., Citation2008). However, although not yet confirmed, recently the ultrafine fraction (<100 nm) was supposed to be probably even more important (Araujo, Citation2011; Franck et al., Citation2011).
Despite the potential health and climate hazard due to potential effects on rainfall, spatial, temporal and intensity distribution (Junkermann et al., Citation2011b) or cloud modification important for radiation budgets (Paasonen et al., Citation2013), the knowledge of the tropospheric distribution of UFPs is limited as these particles are not included into routine atmospheric monitoring programs on a wider scale. For example, the German environmental agency (UBA) reports UFP number concentrations only from 13 out of 314 stations reporting PM2.5 and PM10 data. However, there are at least some attempts to overcome this gap. In 2008, a national ground-based measuring network was setup in Germany (GUAN, Birmili et al., Citation2009, Citation2015). More detailed ground-based measurements covering parts of Germany are available from campaign studies in different regions (Asmi et al., Citation2013; Birmili et al., Citation2013). However, all single ground-based stations encounter the problem whether they are representative for the wider region. Due to the high temporal and spatial variability of ultrafine aerosol sources, for example, traffic and several anthropogenic burning processes, and the high emission rate of certain single point sources such as power stations, which emit to elevated altitudes of the planetary boundary layer (PBL) (Junkermann et al., Citation2011a), the representativeness of ground-based measurements is not always guaranteed. Thus, three-dimensional measurements at larger scales, from local to regional or continental scale, and vertical profiles of UFP distributions, would be beneficial. This requires airborne mobile platforms (O'Dowd et al., Citation2007, Citation2009; Crumeyrolle et al., Citation2010; Junkermann et al., Citation2011a; Schobesberger et al., Citation2013; Junkermann and Hacker, Citation2015). New airborne experiments within EUCAARI covered also a European wide scale (McMeeking et al., Citation2010; Reddington et al., Citation2011; Hamburger et al., Citation2012). However, as large aircraft were used, within several of these experiments only a minor fraction of these measurements were performed within the PBL. Also, the instrumentation used for boundary layer flight patterns did neither include sensors for the ultrafine aerosol number concentration, nor for their size distributions (McMeeking et al., Citation2010). Additional airborne measurements especially in low elevations within or directly above the PBL, that is, close to emission sources and along the regional transport and distribution pathways, would thus be highly valuable for a characterisation of ‘typical’ ultrafine aerosol loads on a regional to continental scale (see, e.g., for Australia: Bigg and Turvey, Citation1978). Here we report for the first time on such a regional-scale airborne survey for UFPs (<100 nm) and their size distributions over Germany. The flights overpassed the agricultural and industrial landscapes with their varying emission sources from the pre-alpine hills of upper Bavaria towards the German Bight north of Hamburg. An attempt was made to characterise typical average and background aerosol with respect to number, concentrations and size distributions. We focused on areas with a high variability of air mass origin to identify probably dominating UFP sources, their typical characteristics of aerosol emissions and to conclude of the importance of sources for the UFP budget in Germany. Key questions addressed were: Why are UFPs number concentrations similar in magnitude over rural eastern Germany and over the heavily industrialised and densely populated Ruhr area (Kreyling et al., Citation2003)? What is controlling temporal and spatial patterns of UFP number concentrations at ground level and aloft? Are these patterns correlated with typical anthropogenic activities or with advection, transport and boundary layer dynamics patterns?
2. Materials and methods
2.1. Aircraft and instrumentation
Airborne measurements of fine and ultrafine aerosols were performed between April 2012 and June 2014. Within the current survey, the main emphasis was on horizontal distributions and coverage of large parts of Germany from the Bavaria Alps to the northern coastline. The flight altitude never exceeded 3000 m above sea level (~10 000 ft), which is the upper boundary of the airspace, open for flights under visual flying rules (VFR) over Germany. The aircraft is a slow flying open cell weight shift controlled aircraft with a cruise speed of about 25 m s−1 (Junkermann, Citation2001). Current legislative lower flight altitude limit for cross-country flights with this type of aircraft is 150 m above ground level (a.g.l.). For larger aircraft (McMeeking et al., Citation2010), this limit is 2000 ft or ~600 m a.g.l., often already higher than the PBL. The low cruise speed of the aircraft reduces the requirements for the time resolution of the instruments to obtain a reasonable horizontal resolution.
The aerosol size distribution instrumentation, similar to the package used during the COPS campaign in 2007 (Junkermann et al., Citation2011a; Wulfmeyer et al., Citation2011), consists of a WRAS system, GRIMM (Ainring, Germany), covering the ultrafine fraction with a Scanning Mobility Particle Spectrometer (SMPS+C, GRIMM, Model 5403) measuring from 4.5 to 350 nm within 2 min time resolution and the fine fraction from 300 nm to 20 µm with an optical particle spectrometer (OPS, GRIMM, Model 1.108). Here the time resolution is 6 s. In addition, the total number of UFPs was measured with a separate condensation particle counter (CPC) having 1s time resolution. All instruments were reduced in size, weight and power consumption. Modifications also included additional temperature stabilisation to allow operation in wider temperature ranges from −20 to +40 °C and under rapidly changing environmental conditions (temperature, pressure, humidity) during vertical profiles. All technical characteristics like dimensions, flow rates, calibration procedures etc. however, were preserved in order to make measurements comparable to ‘standard’ aerosol instrumentation. The aerosol package contains a single wavelength nephelometer (AVMIII, HSS Inc. Bedford, MA, USA) for measurement of the extinction coefficient and for several flight sections in 2014 a 7 wavelength aethalometer, Model AE33 AVIO (Drinovec et al., Citation2015). The total instrument setup () contains also two sets of gimbaled radiation instruments from actinic flux in the UVB (280-315 nm) (Junkermann et al., Citation1989) to total shortwave (model 210 Pyranometer, LICOR) and longwave (CGR4 pyrgeometer, Kipp & Zonen, NL) radiation, both for upwelling and downwelling radiation, surface and sky temperature sensors, a wind and turbulence probe (Metzger et al., Citation2012) and an ozone sensor. It thus allows not only to measure the spatial distribution of aerosols but also to characterise the state of the ambient PBL concerning boundary layer dynamics and air chemistry.
Table 1. Instrumentation package of the ultralight aircraft D-MIFU
All aerosol data plus a user selectable set of other parameters are displayed online within the field of view of the pilot. Apparent changes in aerosol sizes and number concentrations or other parameters, crucial for the characterisation of airmass or vertical boundary layer structure, are visible directly and the pilot/scientist in charge can adjust flight patterns accordingly. The CPC not only serves as flight guidance instrument, for example, for Lagrangian plume studies (Junkermann et al., Citation2011a; Junkermann and Hacker, Citation2015), it is also a recommended instrument to compare the total number of particles counted by the SMPS to an independent instrument for quality control (Wiedensohler, Citation2012). The aerosol package has been used for a variety of different investigations within Europe, Mexico, China and Australia (Junkermann, Citation2005; Grutter et al., Citation2008; Junkermann et al., Citation2009, Citation2011a, Citation2011b; Junkermann and Hacker, Citation2015). Thus, the results of the current survey can also be compared to data as obtained in earlier campaigns (Wiegner et al., Citation2006; Wulfmeyer et al., Citation2011) and reflecting ‘typical’ conditions for other remote or polluted atmospheric environments.
An advantage of the open aircraft with a pusher configuration is the simple way to sample gases and aerosols. Inlet lines can be kept very short and due to the slow cruise speed only for fine and coarse particles an isokinetic inlet is needed. This is solved with a forward pointing brass tube of 30 cm length with a tip with matching diameter. Aerosols are sampled and analysed as close to ambient conditions as possible. A drier is only used for the differential mobility analyser sheet air to prevent high voltage sparks in humid environments.
The aircraft instrumentation is shown in . The total weight of the instrument package is 45 kg, power consumption after warm up <200 W.
Operation under VFR avoids the restrictions of large aircraft sticking to ATC conform air routes or temporary reserved areas (TRA's) (Hamburger et al., Citation2012). The meteorological limit of VFR conditions, horizontal visibility >5 km, minimum distances to clouds 1.5 km and with direct sight towards the ground, is not a severe restriction. It includes, anyway, broken and scattered clouds and totally overcast conditions. Due to the characteristics of the small aircraft wind speed limits are ~30 kts (15 m s−1, Bft 7).
2.2. Flight patterns and tracks
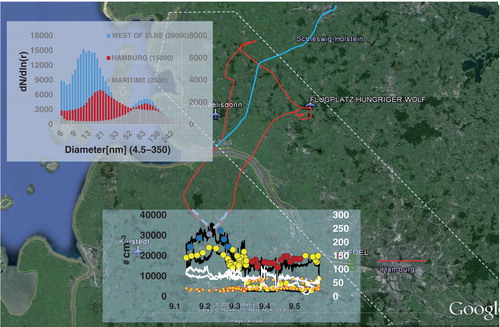
The aerial survey was flown between April 27, 2012, and June 17, 2014, in three campaigns. Flight tracks and weather conditions and main wind directions are shown in and . The section north of Hamburg was flown in September 2013 with special emphasis on an investigation of shipping emissions. Measurements close to the Czech and Polish border and downwind of the city of Berlin were repeated June 6–17, 2014, including a further investigation of the specific local emission sources identified in 2012 in this area and the southerly advection of polluted air masses along the Elbe Valley, the ‘Bohemian wind’.
Fig. 1 Flight tracks and main wind directions (arrows) for the individual flight sections. Black lines indicate flights in April–May 2012, green lines flights along the coastline in September 2013 and blue lines flights in June 2014.
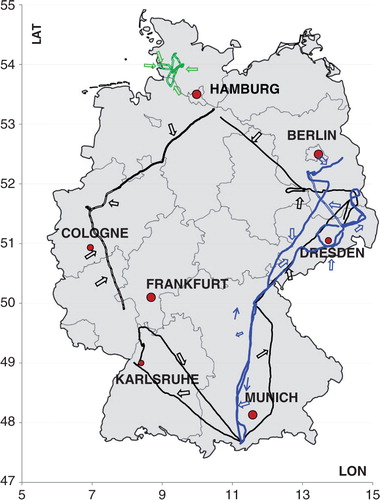
Table 2. Summary of flights, weather conditions and measured aerosol data. Ultrafine aerosols are given as maximum and background concentrations as well as geometrical mean diameter. Fine particles are shown as number of particles >300 nm cm−3. The fraction of time column indicates how long particle number concentrations >15 000 cm−3 were encountered
Black lines in indicate flights in April–May 2012, green lines flights along the coastline in September 2013 and blue lines flights in June 2014. The majority of the experiments were performed under cloud free or less than 4/8 conditions. The dotted lines mark the flight sections that were either flown under scattered cloud (north of Hamburg) or totally overcast conditions (Dinslaken to Mainz, 2012). The second half of sections Hamburg to Dinslaken (north of Cologne) in 2012 and Kamenz (Dresden) to Berlin (Schönhagen, EDAZ) in 2014 were flown less than 3 h after heavy rain in the area and avoiding remaining local shower activity. Flight patterns were modified each day according to the actual wind forecast. Whenever possible, initially a vertical profile into the free troposphere was flown to define the upper boundary of the PBL and to decide on a suitable altitude for further horizontal scanning. This PBL boundary is clearly visible from changes in temperature, dewpoint, aerosol number concentration and visibility (Wiegner et al., Citation2006) and on the online displays. Later, during horizontal scans further short vertical ascents into the free troposphere were flown occasionally as needed. Flights were performed between 09:00 local time and the early afternoon during the time of the day when also photochemistry and convective mixing are most active. Twelve of the 19 flying days were ‘long distance’ flights of more than 300 km while seven flights were regional scale and focused on specific emission patterns. Background concentrations were defined as lowest values within the boundary layer observed for time periods of at least 15 min or six SMPS size distributions outside of obvious emission plumes within the PBL. Size distributions in these ‘background’ areas do not contain particles in the lowest size bins below 10 nm and the geometrical mean diameters (GMD) (>30 nm) is well above that of fresh emissions (<15 nm). This procedure does not estimate the lowest number concentrations occasionally observed in an area but accounts for enhanced background levels in a polluted atmosphere (Lenschow et al., Citation2001; Van Poppel et al., Citation2013; Hacker et al., Citation2016).
2.3. Aerosol budgets
In case of single large aerosol sources, for example, from power plants (Pueschel and Van Valin, Citation1978; Whitby et al., Citation1978; Junkermann et al., Citation2011a; Junkermann and Hacker, Citation2015), whose plume concentrations exceed the local background significantly, the flux of particle number or mass emission can be derived from airborne plume transects. Budget estimates for such single sources require complete plume cross-sections, derived from the fast CPC signal, the PBL altitude and the in situ wind (Bigg and Turvey, Citation1978; Lelieveld et al., Citation1987; Junkermann et al., Citation2011a). The fast CPC signal, smoothed with a running average, along the flight path gives the total number of particles within a plane perpendicular to the plume transport vector and is multiplied with the wind speed to obtain a particle flux, the emission source strength after subtraction of the background measured at both sides of the plume. Wind direction and wind speed are thus measured additionally in situ with an accuracy of ~10° and ±30 cm s−1 (Metzger et al., Citation2012). The in situ wind measurements normally compare reasonably well with HYSPLIT (Draxler and Rolph, Citation2013) derived transport velocities in case that a clear long distance transport pattern is applicable. The agreement gets worse due to the limited resolution of the trajectory model when small-scale disturbances such as local showers and thermally induced thunderstorms are nearby or when complex orography disturbs local flow patterns.
Under conditions, which are typical for good flying conditions under VFR, normally either high pressure systems or cold air after frontal passages, the PBL altitude can be estimated using the basic meteorological signals plus a rapidly changing aerosol concentration within about ±25 m (Lelieveld et al., Citation1987; Wiegner et al., Citation2006). Under such conditions, also an emission into the PBL from an elevated source is well mixed after about 5–10 km distance (VDI, Citation1992). Wind speeds between 3 and 6 m s−1 are favourable as (a) the error in the wind speed measurement is >10 % and (b) plume dispersion and dilution is still limited leading to high concentration and high plume/background differences. The error in the emission estimate than is in the order of ±25 % (Lelieveld et al., Citation1987; Hacker et al., Citation2016).
2.4. Source apportionment
For source apportionment, we were using a combination of in situ measurements and back-trajectory models (HYSPLIT) (Draxler and Rolph, Citation2013) using GDAS, 0.5°, meteorology, which is globally available for HYSPLIT since 2007. The in situ measurements allow us to derive an approximate age of the aerosol based on the size of the Aitken mode. UFPs are either the result of gas-to-particle conversion with initial sizes of about one nm (Kulmala et al., Citation2013) slowly growing into the detectable sizes of >4 nm or primary emissions with sizes between ~6 and ~10 nm (Junkermann et al., Citation2011a; Brachert et al., Citation2013, Citation2014). All these particles grow during the day in the atmosphere with a few nm per hour (Junkermann et al., Citation2011a; Kulmala et al., Citation2013) into size ranges of CCN>50 nm (Laaksonen et al., Citation2005; Andreae, Citation2009). Both sources are often mixed (Junkermann and Hacker, Citation2015). Nevertheless, within obvious plumes the fraction of primary emissions is mostly well defined based on the size distribution modes. A clear mode with particles above the size of the lowermost size bins within ~1–3 h downwind of apparent sulphur compound sources indicates primary origin. Secondary particles in such sulphur rich plumes within these first hours would be still either below detection limit or in the lowermost size bins below 6 nm (Lonsdale et al., Citation2012; Kulmala et al., Citation2013). Although HYSPLIT trajectories are calculated with grid cells for a global transport model and therefore cannot follow smaller scale orography they mostly allow an estimation of the origin of the air mass. The trajectory endpoints files provide additional information about boundary layer structure, meteorological variables and mixed boundary layer depth with hourly resolution during the transport. Thus, they are an additional tool to search for sources of aerosols along the trajectory path, which is provided as keyhole markup language zipped (KMZ) file and directly ready to use within common geo-information systems. Despite the limited resolution of the HYSPLIT model, in most cases well known particle sources, for example, power stations can be identified visually within a short distance from the trajectory and within the corresponding travelling time. We would like to note that in our case studies the origin and type of the air mass is less important than the history of fresh emissions from sources along the trajectory.
3. Results
3.1. Overview
gives an overview over all flight legs and maximum, average and background concentrations of total fine and UFP numbers found over Germany as well as the GMD of the UFP fraction measured with the SMPS. With only two exceptions, the flight sections with advection of maritime air masses from the Baltic or the Northern Sea, during all long distance flights occasional plume-like enhanced particle numbers between 15 000 and 90 000 cm−3 were found. The percentage of flight time with concentrations >15 000 cm−3 (~10 times the natural background) is also given in the table. The lowermost values were about 1500, slightly higher than the 800–1200 cm−3 in remote Australia (Suni et al., Citation2008; Junkermann et al., Citation2009, Citation2015).
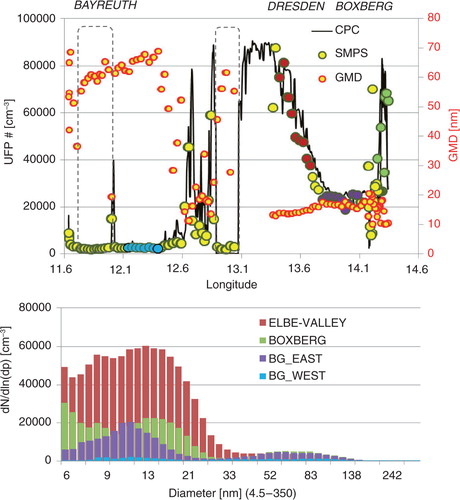
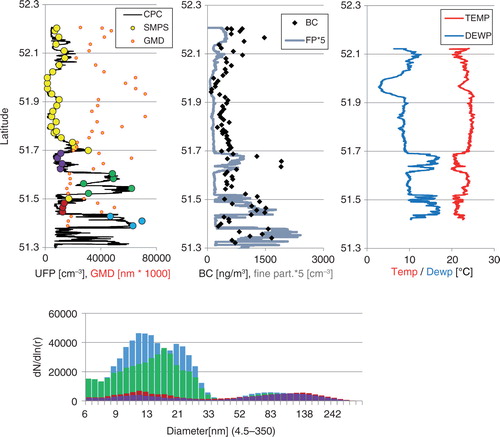
gives an example for the highly variable particle concentrations and size ranges observed between Bayreuth and Garmisch-Partenkirchen passing over agricultural and forested areas along the Czech border, and downwind of the cities of Ingolstadt and Munich. Typically for all plume encounters with number concentration above 15 000 cm−3 is the low GMD of the size distribution. The GMD increases with increasing travelling time from the emission source. Thus, the fresher the emission, the smaller are the particle diameters, see Hamed et al. (Citation2010) for data from Melpitz and Junkermann et al. (Citation2011a). shows the number concentrations measured with the particle counter (TSI 3010) and the SMPS (yellow dots) as well as the GMD derived from the SMPS measurements during a flight from Bayreuth to Kamenz, ~40 km northeast of Dresden April 28, 2012. Both instruments agree well in the total particle number concentration as long as the residence time in the plume is longer than a few minutes and the plume concentration is stable enough during the 2 min SMPS scanning time. Areas with apparently low concentrations, marked with dotted lines, indicate flight sections above the PBL. The GMD for both clean background PBL conditions and the lower free troposphere is about 60–80 nm, indicating aged aerosols. For enhanced PBL background number concentrations as observed in more polluted areas, but outside of apparent plumes, the GMD is significantly lower between 40 and 50 nm. However even here the smallest size bins (<10 nm) were normally empty. Size distributions measured within the individual plumes and within the background areas east and west of the Dresden area (Elbe Valley) are shown in , lower panel. The peaks about 50 km west of Dresden have a mode centre at 16 nm; the maximum, about 15 min downwind of the power station Boxberg, peaks at 8 nm. The broader plume over the Elbe Valley with more constant particle number concentrations indicates a mixture of aged particles (a main mode with ~25–30 nm) with additional freshly produced new particles as the lowest size bins are filled up while the right flank of the main mode of the size distribution moves further towards ~30–35 nm. This is in agreement with aging plumes with initial primary emission and subsequent gas-to-particle conversion after oxidation of excess sulphur dioxide to H2SO4 (Junkermann et al., Citation2011a; Lonsdale et al., Citation2012; Junkermann and Hacker, Citation2015), a pattern also observed by Hamed et al. (Citation2010) for ground-based measurements during new particle formation events at Melpitz, which is located about 75 km northeast of Dresden. Using HYSPLIT trajectory analysis and an approximate age information derived from the size distribution the major peaks can be assigned to emissions from single local sources (e.g. refinery) in lower Bavaria (Burghausen) and to power stations on the upwind side of the mountain ridge. For the whole flight, the number concentration of fine particles (>300 nm) and the PM 2.5 and PM 10 derived from the size distributions within the PBL remained stable. Although slightly enhanced in the eastern part of the area there is no significant correlation of the fine particle fraction with any local plume encounters similar to the ultrafine fraction.
Fig. 2 Flight path, particle number concentration of the CPC (black lines and the SMPS (filled circles) and geometric mean diameter (yellow/red small circles) between Bayreuth and Ohlstadt under northeasterly winds (16.6.2014). The upper panel also shows the position of the cities of Ingolstadt (refineries, 13 0000 population) and Munich (~1.5 million population). Size distributions (lower panel) are colour coded according to upper panel SMPS data.
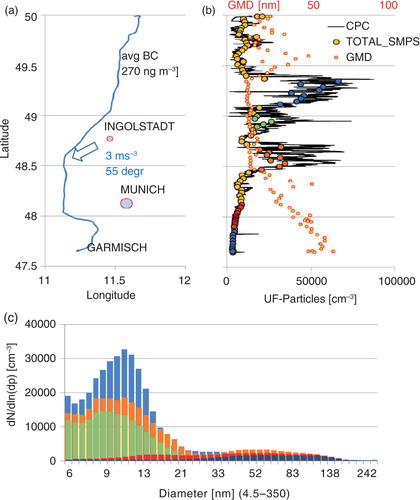
Fig. 3 Upper panel: Number concentrations measured with the particle counter (TSI 3010) and the SMPS (yellow dots) as well as the GMD derived from the SMPS measurements during a flight from Bayreuth to Kamenz, ~40 km northeast of Dresden on April 28, 2012. Dotted lines, measurements above the PBL. The lower panel shows the averaged size distributions as colour coded in the upper panel. Enhanced background east (BG_EAST) of the Elbe Valley with signatures of uncharacterised fresh emissions.
A similar pattern was flown 2 yr later in 2014 (June 6) from Ohlstadt via Bayreuth and from there the next day (June 7) following the Czech border towards Dresden (Kamenz) under predominately (data not shown) southerly to southwesterly flow. This time Dresden was passed about 15 km upwind. HYSPLIT back-trajectories for June 6 and 7 indicate a transport pathway aligned with the flight path and plume encounters from the Ingolstadt refineries halfway between Ohlstadt and Bayreuth on June 6 (plume age ~30 min, max 85 000 cm−3, GMD 11 nm, southeasterly wind) and June 7, from Bayreuth to Dresden (plume age ~15 h, 25–35 000 particle cm−3, GMD 25–35 nm, west-southwesterly winds, downwind of the city of Munich (~8500 cm−3, GMD 40 nm). Within the refinery plume, the number concentration of fine particles >300 nm doubled, but was still in the range typical for moderate to low particle load below 20 cm−3. For comparison, in the Po Valley fine particles larger than 300 nm were often found in number concentrations up to ~200 cm−3 (Laaksonen et al., Citation2005), in the dusty area upwind of Mexico City (Grutter et al., Citation2008) and as well over the Mediterranean in Saharan Dust events values reach occasionally up to 400 cm−3 (Junkermann, Citation2005; Meloni et al., Citation2015).
Passing the valley of the Elbe upwind of the city of Dresden in the south on June 7 a pronounced UFP peak with 55 000 cm−3, GMD 13 nm, appeared upon crossing the edge of the valley 200 m a.g.l. under slight southerly wind. The number concentration increased from 8000 to 55 000 cm−3 within only 30 s passing the edge of the Elbe Valley. The corresponding back-trajectory indicates transport over the Czech coal area with the power stations Tusimice and Ledvice in the early morning before sunrise. HYSPLIT is not able to resolve such the complex orography of the Elbe Valley a source apportionment solely based on this model is less reliable. However, the winds over the Pirna airfield south of Dresden on the valley floor and the in situ measurement 150 m above ground show an SE airflow directly along the valley. This wind pattern is very typical for the Elbe Valley and well known as the ‘Bohemian Wind’ which brought pollution from the ‘black triangle’, the Czech coal mining and energy generation areas, towards Dresden. The same pattern with a channelled valley flow was observed again June 9 during a flight circulating around Dresden with >50 000 cm−3 upwind of Dresden, significantly lower about 2 h later over the flat area in the north.
3.2. Power station plumes along the Polish border, June 8, 2014
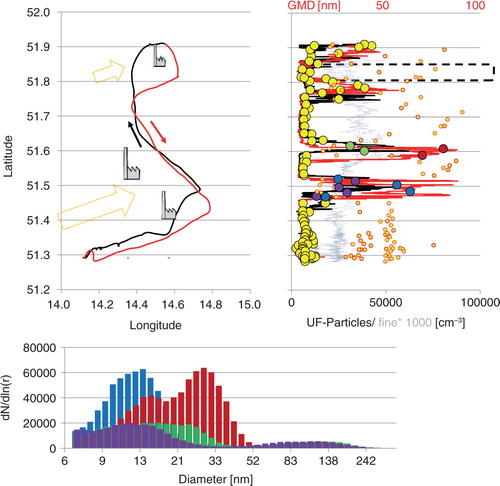
Several large coal-fired power stations are located in Germany north of Dresden/Kamenz along the Polish border. They were identified already in 2012 as major primary particle sources and a specific flight was performed to confirm these previous results and to estimate their emission source strength. depicts the flight path, particle numbers and sizes and GMD about 1 h downwind of the power stations under southwesterly advection. Red lines show the south–north pattern, black lines show the return flight. Clear plumes were observed for the two southerly stations while in the vicinity of the northern one, Jänschwalde, the wind speed was too low and the wind direction varying, preventing a clear plume study. PBL altitudes during this flight were probed after takeoff, close to the northern turning point at Jänschwalde and before landing. Based on mixed layer height, plume cross section, total particle number and in situ wind speed the two power stations in the south were estimated to emit both ~1.5 – 2×10¹⁸ s−1 particles in agreement with a Lagrangian study of the Karlsruhe power station plume and further studies in Australia (Junkermann et al., Citation2011b; Junkermann and Hacker, Citation2015). Neither an enhancement of accumulation mode or fine particles (OPC>300 nm) nor of black carbon (BC) values (aethalometer, channel 880 nm) were observed. Also both the number concentration and the mass concentration of accumulation mode particles, derived from the SMPS, within plume and background remained constant. Particle number and mass enhancement was limited to the particle sizes below 30 nm for all three power stations. (lower panel) shows the size distributions measured ~1 h downwind of the two stations Boxberg and Spremberg. It is interesting to note that these stations, with a similar power generation capacity, show roughly the same source strength but slightly different size ranges with 12 nm respectively 18 nm geometric mean diameter after ~1 h of transport. These differences were preserved during the day and within the second plume transect on the return flight. They point towards a dependence of primary particle production within the power station on the operation conditions and the techniques used for flue gas cleaning which may lead to particles as small as 8 nm (Brachert et al., Citation2014). The Boxberg plume size distribution in 2014 again is in agreement with the 2012 study assuming a primary emission at ~8 nm and a growth rate of about 4–6 nm/h and with the results of the 2007 Karlsruhe plume study (Junkermann et al., Citation2011a).
Fig. 4 Flight path, particle number concentrations and GMD (red/yellow dots) about 1 h downwind of the power stations Spremberg and Boxberg along the Polish border and circling Jänschwalde under southwesterly advection (June 8, 2014) upper panel, red lines the south–north pattern, black lines the return flight. Winds were declining from 4 m s−1 in the south to <2 m s−1 in the north. Red and black the ultrafine particles, the grey dotted line the number concentration of fine (visible) particles >300 nm×1000. The black dotted line marks an ascent above the PBL. Size distributions (lower panel) colour coded according upper panel SMPS.
A quite different pattern was observed June 10 during the flight from Kamenz to Berlin under in situ easterly winds (). The signatures of the three power stations observed June 8 were not detectable within the PBL under easterly winds. In contrast, fine particle concentrations in the PBL reached values up to 500 cm−3, more than 20 times as high as on June 8, comparable to measurements over the Mexico City basin (Grutter et al., Citation2008). Accordingly the visibility was reduced to less than 10 km. In situ wind measurements did not allow us to identify the sources of these particles. However, according to a HYSPLIT calculation for 400 m altitude (clearly within the PBL<600 m a.g.l.) the wind direction changed about 1 h prior to the plume encounter and despite an in situ easterly wind the trajectory indicated a transport from the southeast over the Polish power station Turow, a station without a modern flue gas cleaning system during the time of the measurement. BC reached more than 2000 ng m−3, about five times as high as downwind of modern ‘clean’ power stations. Just above the PBL particle concentrations increased up to 65 000 cm−3 on a more southerly trajectory (HYSPLIT calculation for 800 m a.g.l.), picking up pollution traceable to the ‘clean’ Czech coal-fired power station Melnice (900 MW). The mixed boundary layer in the evening of June 9 (from the HYSPLIT trajectory endpoint file) over the power station at the time of the air mass advection was below 150 m, lower than the chimney and emission height of the power station. Effective nocturnal transport thus occurred in the residual layer without significant vertical plume dispersion. The conditions on June 10 with the high particle load in the stable PBL also suppressed the development of thermal convection and downward mixing of the Melnice plume and that way lead to a clear separation of two different air masses.
Fig. 5 Particle number concentrations of CPC/SMPS and OPC (FP) as well as black carbon (BC), temperature and dewpoint and size distributions (lower panel) measured during the flight from Kamenz to Berlin (Schönhagen, EDAZ) (June10, 2014). High total mass (fine particles>300 nm) in the PBL is correlated to high BC and high dewpoint in the humid boundary layer capped by a strong inversion. Above the PBL, clear sky and high ultrafine particle number concentrations dominate.
3.3. Northern German lowlands
West of Berlin, further towards Hamburg and back south towards Münster over the Northern German lowlands total particle numbers were relatively constant in low to medium range of 2500–6000 cm−3 under advection from Northern Sea or from the Baltic Sea. In this area, no dominant plumes were found and GMD of the SMPS size distributions were always in the ranges of 40–70 nm typical also for other background measurements. It is not clear where the twice as high values in air masses from the Baltic Sea were originating from. However, along the coast a major ship traffic line (Kadetrinne) with a total of about 65 000 ships/a might provide a major contribution to sulphur emissions. It is obvious from the bimodal size distributions that the additional UFPs are due to a fraction within the Aitken size range. Within slightly polluted air masses, always two major size modes were observed with a fraction in the Aitken mode with growing number concentrations.
3.4. Northern Sea Coastline
The area north of Hamburg was investigated in September 2013 within the framework of the MESMART (Measurements of shipping emissions in the marine troposphere; www.mesmart.de) project. The aircraft was used for flights along the river Elbe and the Nord-Ostsee channel, connecting as a major shipping route the Northern Sea and the Baltic Sea. With southeasterly advection, the emissions of the city Hamburg dominated, clean maritime air under (north) westerly winds. Particle concentrations downwind of Hamburg reached about 10 000–15 000 cm−3, slightly higher than downwind of Munich in 2012 and 2014, however, with a significantly lower mixed boundary layer. The total particle production from the city Munich was already previously measured by upwind and downwind measurements in 2003 with the TSI 3010 particle counter (Wiegner et al., Citation2006). The total particle flux derived from particle number, vertical distribution, cross section of the city plume and wind speed derived from HYSPLIT as the in situ technique was not yet available was ~2×10¹⁷ s−1. These data agree with our estimates from the 2012 and 2014 flyby data for Munich and Hamburg from the current study. Berlin (12.6.2014) was a special case as the two city power stations are clearly visible on top of the larger city plume. Overall particle fluxes of the larger German cities with similar population (1.7 and 1.4 million) were roughly comparable and about an order of magnitude lower than the emissions of a single power station of about 600–800 MW. It was not possible to disentangle the emissions of the port of Hamburg from the general city plume. However, apparently higher concentrations up to 35 000 cm−3 were observed September 6, 2013, within a plume further west of the Elbe under south-southeasterly wind. Both the in situ and the HYSPLIT wind direction agree well and exclude any source apportionment to the city or industrial emissions of the Hamburg area. Also, the size distribution of this plume has a GMD of 24 nm, too large for fresh emissions, which were within all plumes, observed from a shorter distance, clearly well below 20 nm. Assuming an average growth rate of ~4 nm/h this corresponds to an age of 5–6 h and a transport distance of about 200 km. As there are neither large cities, nor industry complexes known to emit such particles along the back-trajectory the origin of this plume is most likely one of the major German sulphur sources, the power station Buschhaus ().
Fig. 6 Particle number concentrations and size distributions west of the River Elbe and north (downwind) of Hamburg. The blue line is the ship channel connecting Northern and Baltic Sea. Highest number concentrations were found in air masses bypassing Hamburg ~30 km to the west. Size distributions correspond to fill colour of the SMPS total counts, polluted conditions left, maritime background right scale.
Under westerly winds particle number concentrations in the maritime air were about 1600–2500 cm−3. Ships did not contribute significantly on a local scale, which is probably due to the fact that they have to run at low speed while travelling towards Hamburg. A clear signature of up to 20 000 particles cm−3 was obvious several times from the small refinery at Brunsbüttel.
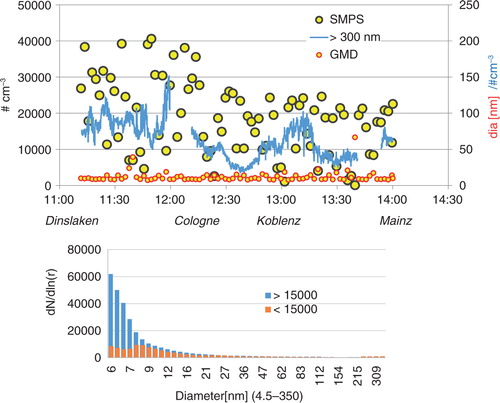
Fig. 7 Particle number concentrations, fine particles>300 nm (in blue), GMD and size distributions from the SMPS for the flight from Dinslaken to Mainz under totally overcast (8/8) conditions.
3.5. Overcast conditions, Western Germany
The return flight from Hamburg to Garmisch-Partenkirchen on May 3, 2012, lead through the Ruhr-industry district from Dinslaken directly towards the south, passing downwind of Cologne and the petrochemical industry between Cologne and Bonn under southwesterly winds. It was performed under initially totally overcast conditions downwind of the brown coal area west of the river Rhine. Within the final 50 km of this track, the cloud cover broke and allowed to climb higher up into the free troposphere. Unfortunately the CPC was running that day only for the first 30 min. Thus, for most of this day, only the SMPS and optical particle counter data are available. Total UFP numbers were constantly high up to 50 000 cm−3 but slowly declining towards 25 000 cm−3 during the flight to Mainz (). Particle sizes (GMD) were exceptionally low for all the flight and did not exceed 10 nm for most of the size distributions. All size distributions show highest number concentrations in the lowest size bins indicating that even smaller particles are present in sizes below the counting threshold for the SMPS of 4.5 nm. Fine particulate mass was about twice of what was found over other anthropogenic affected areas, but only about one third of what was observed about 100 km west of the Polish border downwind of Turow.
3.6. South-western Germany
Two flight legs were flown over South-western Germany between Garmisch-Partenkirchen and Speyer on May 14 and May 17, 2012, within the current survey. Both flights show medium background concentrations between 3000 and 5000 cm−3 very similar to the results from more than 15 regional flights over the Rhine valley and the black forest during the COPS campaign 2007 (Junkermann et al., Citation2011a; Wulfmeyer et al., Citation2011). Apparent plumes were observed in the vicinity of the power station Karlsruhe (Junkermann et al., Citation2011a) and downwind of a small power station in the city of Ulm.
4. Model simulations
We applied the fully online-coupled model system COSMO-ART (Vogel et al., Citation2009; Bangert et al., Citation2013; Rieger et al., Citation2014) to elucidate the occurrence of UFPs behind large single sources from the modelling perspective. COSMO-ART accounts for atmospheric chemistry and describes aerosol dynamics of primary and secondary particles following the modal approach. This results in simulated size distributions of aerosols and their chemical composition (soot, sulphate, nitrate, ammonia, water, and secondary organics). Using the model system we carried out a case study for a day in November when secondary particle formation in the atmosphere via the oxidation of precursors should be suppressed due to low OH radical concentrations and primary particle emission would be more visible.
At first simulations for whole Europe were performed with COSMO-ART with a 7 km spatial resolution to build up the gas phase and aerosol background conditions. The simulation results for Europe are used as boundary and initial conditions for sensitivity simulations performed with COSMO-ART at a spatial resolution of 2.8 km and a simulation domain which covers all of Germany. Two sensitivity simulations were performed in which we accounted for direct particle emissions by combustion power plants. For both sensitivity simulations, we added the direct emission of H2SO4 droplets to all large single sources in our emission data set categorised as combustion power plants (E-PRTR, Citation2016). The median size of the emitted droplets depends on the emitted H2SO4 concentration, which is estimated, assuming a conversion of 1.5 % of the SOx emissions to H2SO4 (Brachert et al., Citation2013; Junkermann and Hacker, Citation2015). For scenario A, the source strength of the direct particle emissions per power station was taken from the measurements described in the previous sections and as 2×10¹⁸ particles s−1. In scenario B, the source strength was prescribed based on the simulations tool AerCoDe (Wix et al., Citation2010), which was used to estimate the formation of H2SO4 aerosol droplets by homogeneous nucleation inside the gas liquid contact devices used for the gas cleaning (e.g. wet flue gas desulfurisation). The resulting number concentration is in the order of 4×107 cm−3 at the outlet of the stack after 20 s of coagulation independent of the emitted H2SO4 concentration. Aerosol diameter in the AerCoDe B scenario is by far higher than observed (this study and Junkermann et al., Citation2011a) and modelled by Brachert et al. (Citation2013) at 50–90 nm. Assuming an average volume flux for all considered combustion plants the source strength in scenario B of the direct particle emissions was prescribed to 5.5×10¹⁵ particles s−1 per plant.
shows the resulting distribution of Aitken particles for southeasterly advection over northern Germany for both sensitivity scenarios. Both simulations show that the primary emission plumes from the combustion power plants have a widespread impact on particle number concentrations.
Fig. 8 Spatial distribution of Aitken mode particles from primary emissions by combustion power plants over Germany according to COSMO-ART modelled with AerCoDe (right panel) and based on measured (left panel) ultrafine particle emissions for southeasterly winds. The model was run for winter (November) overcast conditions to suppress secondary gas-to-particle conversion within the plume.
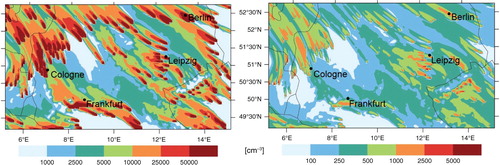
The simulated particle number concentrations in case A based on the airborne observations exceed the number concentrations in case B based on the in-plant nucleation simulations with AerCoDe by more than one, up to three orders of magnitude. As the higher concentrations are based on measured source strengths in the atmosphere, they should be the more realistic ones. Nevertheless, the reason for the difference needs further investigation.
5. Summary and discussion
Between 2012 and 2014, regional-scale airborne PBL measurements over Germany of UFP number concentrations and size distributions were performed to investigate the spatial distribution of UFPs and to search for and to characterise major sources and their impact on the variability of particle number concentrations over Germany. One of the main advantages of such airborne measurements is that direct disturbances of small local aerosol sources like individual cars or other small emitters can be avoided. At about 200 m above ground, for example, motorway emissions (Rosenbohm et al., Citation2005) are no longer detectable as individual line sources. They might, however, contribute to a diffuse enhanced background. On the other hand, single large sources, emitting into mid-elevations of the mixed layer, are well visible. Irrespective of the high variability of particle numbers in an urban environment, within such an airborne survey, cities are area sources with a footprint diameter of several km. As contributions of diffuse local and distant larger sources are depending on regional-scale advection systems, clean or polluted background loads depend on the meteorological situation and may not be captured by a few short flights. Thus we repeated some flight patterns from 2012 in 2014 and also compared data from previous airborne campaigns in Germany (Wiegner et al., Citation2006; Junkermann et al., Citation2011a; Wulfmeyer et al., Citation2011). The special properties of the aircraft, the combination of fast counters and detailed size distribution measurements with the low cruise speed and the possibility to climb rapidly for vertical profiles up into the free troposphere allow, together with in situ wind measurements and back-trajectory calculations (HYSPLIT), not only a source apportionment but also an estimate of the source strength of individual large primary particle sources.
Over large distances over Northwestern Germany, Bavaria and South-western Germany, particle number concentrations were comparable to background values in other moderately polluted European areas in the range of 2000–3000 particles cm−3, but about twice or three times as high as over Finland (O'Dowd et al., Citation2009) or over Australia where about 800–1200 cm−3 were observed repeatedly (Suni et al., Citation2008; Junkermann et al., Citation2009 Junkermann et al., Citation2011b, Citation2015). Along the Polish border, over the Ruhr area and downwind of the brown coal mining area west of Cologne and the petrochemical industry south of Cologne lowest levels of particles were often in a range of 10 000–15 000 cm−3. Such high background number concentrations, previously, for example, found over the highly polluted Italian Po Valley (Laaksonen et al., Citation2005; Junkermann, Citation2009), were already considered as plumes or events in other, more remote areas. Single high concentration plumes with more than 60 000–80 000 particles cm−3, comparable to highly polluted urban conditions (Bae et al., Citation2010), with short-term variable (±30 %) concentrations were about 10–30 km wide and found directly (~10–20 km) downwind of fossil fuel burning power stations or refineries. The number concentrations are well in agreement with a dilution of the initial particle numbers in the stack of up to 3×109 cm−3 (Brachert et al., Citation2013) and a subsequent plume dilution by about three orders of magnitude. Wider, similar high maximum particle concentration plumes spanning horizontally up to 100 km were observed at several locations with more constant particle number concentrations. They were found 50–150 km downwind of agglomerations of fossil fuel processing or energy plants and might also contain secondary aerosols. Examples here are the industry district along the river Rhine, the valley of the Elbe upwind of Dresden and also – under northeasterly advection – along the Czech border over the forests of northern Bavaria. Enhanced particle concentrations exceeding 15 000 cm−3 were observed up to 60 % of the flight time ().
Downwind of major German cities Munich, Berlin and Hamburg, urban plume concentrations were in the order of 4000–10 000 cm−3 above local background values, comparable to observations 80 yr ago (Landsberg, Citation1938) and in 1974/1976 downwind of major Australian cities in a similar survey (Bigg and Turvey, Citation1978), despite completely different clean air regulations and far less traffic at that time. Downwind of Berlin, the additional plume signatures of the two coal-fired city power stations are obvious. The number concentrations of such city plumes depend on the mixed layer height and correspond for the major German cities investigated to an UFP number source in a range of ~2–4×10¹⁷ s−1, about an order of magnitude less than a typical coal-fired power station of about 600–800 MW (this study, Junkermann et al., Citation2011a, Citation2011b; Junkermann and Hacker, Citation2015). This result compares well with ultrafine aerosol data from an earlier (2003) particle budget study in Munich (Wiegner et al., Citation2006).
Based on the model calculations using the measured emissions and in agreement with the results of the current study, 10–40 % of Germany's rural countryside are continuously covered by elevated layers of predominately primary invisible UFPs with number concentrations between 15 000 and 80 000 cm−3, about one to two orders above continental background (). Central and northern Germany are more often affected than southern Germany due to the higher density of power stations. The spatial distribution is depending on the location of sources and the predominant transport patterns. Under rainy conditions, often under northwesterly transport, lower concentrations are expected although, even directly after heavy rainfall concentrations, still between 30 000 and 50 000 cm−3 were observed over the heavily industrialised Ruhr area with a high agglomeration of coal-fired power stations (e.g. Scholven, 2200 MW, 10 km from the airport of Dinslaken, Walsum 1300 MW and others within 20 km), coke plants (Bottrop) and refineries.
Particulate matter originating from sources processing fossil fuel is normally initially emitted into elevations of more than 200 m. Early morning the resulting plumes appear in the residual layer isolated from the ground by the nocturnal inversion. Convection during the day is mixing air from this residual layer down to the surface and accordingly modifies boundary layer diurnal particle patterns (Boy and Kulmala, Citation2002; Demerjian and Mohnen, Citation2008; Crippa et al., Citation2012). Where and when such downward mixing occurs depends on plume position and thermal convection, which is in turn dependent on solar radiation, air and surface temperatures (Stull, Citation1988).
The results of the current study are well in agreement with recent observations of both ground-based measurements and vertical profiles of UFPs, indicating elevated sources of Aitken mode particles (Crumeyrolle et al., Citation2010; Song et al., Citation2010; Crippa et al., Citation2012; Schobesberger et al., Citation2013; Altstädter et al., Citation2015; Platis et al., Citation2016). Several of these studies found either enhanced numbers of UFPs in higher elevations within or just above the PBL (within the residual layer) or close to the surface high particle number events with size distributions linked to regional-scale transport (Birmili and Wiedensohler, Citation2000; Boy and Kulmala, Citation2002; Crippa et al., Citation2012). HYSPLIT back-trajectories for these published data often pass close to or over coal-fired power stations 50–300 km upwind. Größ et al. (Citation2015) investigated nucleation events at a rural surface station and suggested downward mixing of polluted residual layer air as a possible source of UFPs. Power station plumes contain primary UFPs and excess secondary particle precursor substances H2SO4 and ammonia. They are also consistent with the regional variability and temporal evolution of boundary layer UFP number concentrations and size distributions in urban and rural environments in Germany (Birmili et al., Citation2013; Ma and Birmili, Citation2015). A dominating role of three-dimensional transport processes on the distribution of aerosols a regional scale on has been observed also elsewhere in larger aerosol network studies (Demerjian and Mohnen, Citation2008).
Primary particulate emissions from fossil fuel use or processing have to be taken into account as major contributions to the UFP budget over Germany both within the discussion of observations and in regional-scale models that often do not yet consider properly the changes in emission patterns after flue gas cleaning (Junkermann et al., Citation2011b). An investigation of their climate relevance is beyond the scope of this study. However, changes in cloud relevant aerosols (CCN) that might change rainfall temporal, spatial and intensity patterns, linked to emission changes in Germany have been reported already by Hamed et al. (Citation2010) and ship track like plumes of smaller cloud droplets are observable from satellite downwind of German power stations as well as over Australia (Rosenfeld, Citation2000; Rosenfeld, private communication). Also changes in the precipitation intensity spectra were reported for northeastern Germany after the reunification in 1990. However, the aerosol–cloud–precipitation system is too complex and the observational database is still not sufficient enough to derive any experimental evidence or causality.
Power station plume studies over several hundred kilometres were performed already in the early 1970s (Bigg and Turvey, Citation1978; Gillani et al., Citation1978; Ayers et al., Citation1979; Hegg and Hobbs, Citation1979). However, compared to the ‘old’ studies, nowadays these plumes are no longer visible, neither for the human eye nor for satellites. What is probably most relevant for regional-scale modelling (Pierce and Adams, Citation2009) is the change of magnitude of the primary particle number emission with ‘clean’ fossil fuel combustion (Junkermann et al., Citation2011b), up to three orders of magnitude larger than older ‘dirty’ power stations (Pueschel and Van Valin, Citation1978; Wilson, Citation1981), the exclusive emission of Aitken mode particles both in number and mass distributions and the particulate emission without any detectable BC enhancement. This change in the partitioning between fine and UFPs is due to the modification of size distributions (removal of fine particles) and the fraction of H2SO4 in the flue gas. Future measures to reduce emissions of the Polish power stations along the German border which were not yet equipped at the time of the survey with current flue gas cleaning systems can be expected to further modify both background number concentrations in fine and ultrafine mode and plume events also in eastern Germany.
6. Acknowledgement
We acknowledge support by Deutsche Forschungsgemeinschaft and Open Access Publishing Fund of Karlsruhe Institute of Technology.
References
- Altstädter B. , Platis A. , Wehner B. , Scholtz A. , Wildmann N. , co-authors . ALADINA – an unmanned research aircraft for observing vertical and horizontal distributions of ultrafine particles within the atmospheric boundary layer. Atmos. Meas. Tech. 2015; 8: 1627–1639. http://dx.doi.org/10.5194/amt-8-1627-2015 .
- Andreae M. O . Correlation between cloud condensation nuclei concentration and aerosol optical thickness in remote and polluted regions. Atmos. Chem. Phys. 2009; 9: 543–556.
- Araujo J. A . Are ultrafine particles a risk factor for cardiovascular diseases?. Rev. Esp. Cardiol. (English Ed). 2011; 64(8): 642–645.
- Asmi A. , Coen C. , Ogren M. , Andrews J. A. , Sheridan E. , co-authors . Aerosol decadal trends – Part 2: in-situ aerosol particle number concentrations at GAW and ACTRIS stations. Atmos. Chem. Phys. 2013; 13: 895–916. http://dx.doi.org/10.5194/acp-13-895-2013 .
- Ayers G. P. , Bigg E. K. , Turvey D. E . Aitken particle and cloud condensation nucleus fluxes in the plume from an isolated industrial source. J. Appl. Met. 1979; 187: 449–459.
- Bae M.-S. , Schwab J. J. , Hogrefe O. , Frank B. P. , Lala G. G. , co-authors . Characteristics of size distributions at urban and rural locations in New York. Atmos. Chem. Phys. 2010; 10: 4521–4535.
- Bangert M. , Vogel B. , Junkermann W. , Brachert L. , Schaber K . The impact of flue gas cleaning technologies in coal-fired power plants on the CCN distribution and cloud properties in Germany. 19th International Conference on Nucleation and Atmospheric Aerosols. 2013. 24–28 June 2013, Fort Collins, CO, USA. Abstract. DOI: http://dx.doi.org/10.1063/1.480338M .
- Bigg E. K. , Turvey D. E . Sources of atmospheric particles over Australia. Atmos. Environ. 1978; 12: 1643–1655.
- Birmili W. , Sun J. , Weinhold K. , Merkel M. , Rasch F. , co-authors . Atmospheric aerosol measurements in the German Ultrafine Aerosol Network (GUAN) – Part III: black carbon mass and particle number concentrations 2009–2014. Gefahrst – Reinhalt. Luft. 2015; 75(11/12): 479–488.
- Birmili W. , Tomsche L. , Sonntag A. , Opelt C. , Weinhold K. , co-authors . Variability of aerosol particles in the urban atmosphere of Dresden (Germany): effects of spatial scale and particle size. Meteorologische. Zeitschrift. 2013; 22(2): 195–211.
- Birmili W. , Weinhold K. , Nordmann S. , Wiedensohler A. , Spindler G. , co-authors . Atmospheric aerosol measurements in the German Ultrafine Aerosol Network (GUAN). Gefahrst – Reinhalt. Luft. 2009; 69: 137–148.
- Birmili W. , Wiedensohler A . New particle formation in the planetary boundary layer: meteorological and gas phase parameter influence. Geophys. Res. Lett. 2000; 27: 3325–3328.
- Bister M. , Kulmala M . Anthropogenic aerosols may have increased upper troposphere humidity in the 20th century. Atmos. Chem. Phys. 2011; 11: 4577–4586.
- Boy M. , Kulmala M . Nucleation events in the continental boundary layer: influence of physical and meteorological parameters. Atmos. Chem. Phys. 2002; 2: 1–16.
- Brachert L. , Kochenburger T. , Schaber K . Facing the sulfuric acid aerosol problem in flue gas cleaning: pilot plant experiments and simulation. Aerosol. Sci. Technol. 2013; 47: 1083–1091.
- Brachert L. , Mertens J. , Khakharia P. , Schaber K . The challenge of measuring sulfuric acid aerosols, number concentration and size evaluation using a condensation particle counter (CPC) and an electrical low pressure impactor (ELPI). J. Aerosol. Sci. 2014; 67: 21–27.
- Crippa P. , Petäjä T. , Korhonen H. , El Afandi G. S. , Pryor S. C . Evidence of an elevated source of nucleation based on model simulations and data from the NIFTy experiment. Atmos. Chem. Phys. 2012; 12: 8021–8036.
- Crumeyrolle S. , Manninen H. E. , Sellegri K. , Roberts G. , Gomes L. , co-authors . New particle formation events measured on board the ATR-42 aircraft during the EUCAARI campaign. Atmos. Chem. Phys. 2010; 10: 6721–6735. http://dx.doi.org/10.5194/acp-10-6721-2010 .
- Demerjian K. L. , Mohnen V. A . Synopsis of the temporal variation of particulate matter composition and size. J. Air Waste Manag. Assoc. 2008; 58: 16–233. http://dx.doi.org/10.3155/1047-3289.58.2.216 2.
- Draxler R. R. , Rolph G. D . HYSPLIT (HYbrid Single-Particle Lagrangian Integrated Trajectory) Model. 2013. Access via NOAA ARL READY Website http://ready.arl.noaa.gov/HYSPLIT.php. NOAA Air Resources Laboratory, Silver Spring, MD.
- Drinovec L. , Močnik G. , Zotter P. , Prévôt A. S. H. , Ruckstuhl C. , co-authors . The “dual-spot” Aethalometer: an improved measurement of aerosol black carbon with real-time loading compensation. Atmos. Meas. Tech. 2015; 8: 1965–1979. http://dx.doi.org/10.5194/amt-8-1965-2015 .
- E-PRTR, European Pollutant Release and Transfer Register. Online at: http://prtr.ec.europa.eu/#/lcplevels .
- Franck U. , Odeh S. , Wiedensohler A. , Wehner B. , Herbath O . The effect of particle size on cardiovascular disorders – The smaller the worse. Sci. Total. Environ. 2011; 409(20): 4217–4221. http://dx.doi.org/10.1016/j.scitotenv.2011.05.049 .
- Gillani N. V. , Husar R. B. , Husar J. D. , Patterson D. E . Project MISTT: kinetics of particulate Sulphur formation in a power plant plume out to 300 km. Atmos. Environ. 1978; 12: 1739–1752.
- Größ J. , Birmili W. , Hamed A. , Sonntag A. , Wiedensohler A. , co-authors . Evolution of gaseous precursors and meteorological parameters during new particle formation events in the Central European boundary layer. Atmos. Chem. Phys. Discuss. 2015; 15: 2305–2353.
- Grutter M. , Basaldud R. , Rivera C. , Harig R. , Junkermann W. , co-authors . SO2 emissions from Popocat'epetl volcano: emission rates and plume imaging using optical remote sensing techniques. Atmos. Chem. Phys. 2008; 8: 6655–6663. Online at: www.atmos-chem-phys.net/8/6655/2008/ .
- Hacker J. M , Chen D. , Bai M. , Ewenz C. , Junkermann W. , co-authors . Using airborne technology to quantify and apportion emissions of CH4, N2O and NH3 from feedlots. Anim. Prod. Sci. 2016. http://dx.doi.org/10.1071/AN15513. Online at: http://www.publish.csiro.au/nid/72.htm .
- Hamburger T. , McMeeking G. , Minikin A. , Petzold A. , Coe H. , co-authors . Airborne observations of aerosol microphysical properties and particle ageing processes in the troposphere above Europe. Atmos. Chem. Phys. 2012; 12: 11533–11554. http://dx.doi.org/10.5194/acp-12-11533-2012 .
- Hamed A. , Birmili W. , Joutsensaari J. , Mikkonen S. , Asmi A. , co-authors . Changes in the production rate of secondary aerosol particles in Central Europe in view of decreasing SO2 emissions between 1996 and 2006. Atmos. Chem. Phys. 2010; 10: 1071–1091. http://dx.doi.org/10.5194/acp-10-1071-2010 .
- Hegg D. A. , Hobbs P. V . Measurements of gas-to-particles conversion in the plumes from five coal-fired electric power plants. Atmos. Environ. 1979; 14: 99–116.
- Junkermann W . An ultralight aircraft as platform for research in the lower troposphere: system performance and first results from radiation transfer studies in stratiform aerosol layers and broken cloud conditions. J. Ocean. Atm. Techn. 2001; 18: 934–946.
- Junkermann W . The actinic UV-radiation budget during the ESCOMPTE campaign 2001: results of airborne measurements with the microlight research aircraft D-MIFU. Atmos. Res. 2005; 74: 461–475. http://dx.doi.org/10.1016/j.atmosres.2004.06.009 .
- Junkermann W . On the distribution of formaldehyde in the western Po-valley, Italy, during FORMAT 2002/2003. Atmos. Chem. Phys. 2009; 9: 9187–9196.
- Junkermann W. , Hacker J. , Lyons T. , Nair U . Land use change suppresses precipitation. Atmos. Chem. Phys. 2009; 9: 6531–6539.
- Junkermann W. , Hacker J. M . Ultrafine particles over Eastern Australia: an airborne survey. Tellus B. 2015; 67: 25308. http://dx.doi.org/10.3402/tellusb.v67.25308 .
- Junkermann W. , Hagemann R. , Vogel B . Nucleation in the Karlsruhe plume during the COPS/TRACKS – Lagrange experiment. Q. J. Roy. Meteorol. Sci. 2011a; 137: 267–274.
- Junkermann W. , Vogel B. , Sutton M. A . The climate penalty for clean fossil fuel combustion. Atmos. Chem. Phys. 2011b; 11: 12917–12924.
- Junkermann W. , Platt U. , Volz A . A photoelectric detector of the measurement of photolysis frequencies of ozone and other atmospheric molecules. J. Atmos. Chem. 1989; 8: 203–227.
- Kerminen V.-M. , Paramonov M. , Anttila T. , Riipinen I. , Fountoukis C. , co-authors . Cloud condensation nuclei production associated with atmospheric nucleation: a synthesis based on existing literature and new results. Atmos. Chem. Phys. 2012; 12: 12037–12059. http://dx.doi.org/10.5194/acp-12-12037-2012 .
- Kreyling W. G. , Tuch T. , Peters A. , Pitz M. , Heinrich J. , co-authors . Diverging long-term trends in ambient urban particle mass and number concentrations associated with emission changes caused by the German unification. Atmos. Environ. 2003; 37: 3841–3848.
- Kulmala M. , Kontkanen J. , Junninen H. , Lehtipalo K. , Manninen H. E. , co-authors . Direct Observations of Atmospheric Aerosol Nucleation. Science. 2013; 339: 943–946.
- Laaksonen A. , Hamed A. , Joutsensaari J. , Hiltunen L. , Cavalli F. , co-authors . Cloud condensation nucleus production from nucleation events at a highly polluted region. Geophys. Res. Lett. 2005; 32(6): 06812. http://dx.doi.org/10.1029/2004GL022092 .
- Landsberg H . Conrad V . Atmospheric condensation nuclei. Gerlands Beiträge zur Geophysik, Ergebnisse der Kosmischen Physik III. 1938; 155–252. Akademische Verlagsgesellschaft. M.B.H. Leipzig.
- Lelieveld J. , Jansen F. W. , den Tonkelaar J. F . Assessment of transboundary mass fluxes of air pollutants by aircraft measurements: A preliminary survey with reference to a case study. Atmos. Environ. 1987; 21: 2133–2143.
- Lenschow P. , Abraham H.-J. , Kutzner K. , Lutz M. , Preuß J.-D. , co-authors . Some ideas about the sources of PM10. Atmos. Environ. 2001; 35(Suppl. 1): 23–S33.
- Lonsdale C. R. , Stevens R. G. , Brock C. A. , Makar P. A. , Knipping E. M. , co-authors . The effect of coal-fired power-plant SO2 and NOx control technologies on aerosol nucleation in the source plumes. Atmos. Chem. Phys. 2012; 12: 11519–11531. http://dx.doi.org/10.5194/acp-12-11519-2012 .
- Ma N. , Birmili W . Estimating the contribution of photochemical particle formation to ultrafine particle number averages in an urban atmosphere. Sci. Total Environ. 2015. 512–513, 154–166. DOI: http://dx.doi.org/10.1016/j.scitotenv.2015.01.009 .
- McMeeking G. R. , Hamburger T. , Liu D. , Flynn M. , Morgan W. T. , co-authors . Black carbon measurements in the boundary layer over western and northern Europe. Atmos. Chem. Phys. 2010; 10: 9393–9414. http://dx.doi.org/10.5194/acp-10-9393-2010 .
- Meloni D. , Junkermann W. , di Sarra A. , Cacciani M. , De Silvestri L. , co-authors . Altitude resolved shortwave and longwave radiative effects of desert dust in the Mediterranean during the GAMARF campaign: indications of a net daily cooling in the dust layer. J. Geophys. Res. Atmos. 2015; 120(8): 3386–3407. http://dx.doi.org/10.1002/2014JD022312..
- Metzger S. , Junkermann W. , Mauder M. , Beyrich F. , Butterbach-Bahl K. , co-authors . Eddy Covariance flux measurements with a weight-shift microlight aircraft. Atmos. Meas. Tech. 2012; 5: 1699–1717. http://dx.doi.org/10.5194/amt-5-1699-2012 .
- Oberdörster G. , Oberdörster E. , Oberdörster J . Nanotoxicology: an emerging discipline evolving from studies of ultrafine particles. Environ. Health Perspect. 2005; 113(7): 823–839.
- O'Dowd C. D. , Yoon Y. J. , Junkermann W. , Aalto P. , Kulmala M. , co-authors . Airborne measurements of nucleation mode particles I: coastal nucleation and growth rates. Atmos. Chem. Phys. 2007; 7: 1491–1501.
- O'Dowd C. D. , Yoon Y. J. , Junkermann W. , Aalto P. , Kulmala M. , co-authors . Airborne measurements of nucleation mode particles II: boreal forest nucleation events. Atmos. Chem. Phys. 2009; 9: 937–944.
- Paasonen P. , Asmi A. , Petäjä T. , Kajos M. K. , Äijälä M. , co-authors . Warming-induced increase in aerosol number concentration likely to moderate climate change. Nat. Geosci. 2013; 6: 438–442.
- Pierce J. R. , Adams P. J . Efficiency of cloud condensation nuclei formation from ultrafine particles. Atmos. Chem. Phys. 2007; 7: 1367–1379. http://dx.doi.org/10.5194/acp-7-1367-2007 .
- Pierce J. R. , Adams P. J . Uncertainty in global CCN concentrations from uncertain aerosol nucleation and primary emission rates. Atmos. Chem. Phys. 2009; 9: 1339–1356.
- Platis A. , Altstädter B. , Wehner B. , Wildmann N. , Lampert A. , co-authors . An observational case study on the influence of atmospheric boundary-layer dynamics on new particle formation. Boundary-Layer Meteorol. 2016; 158: 67–92. http://dx.doi.org/10.1007/s10546-015-0084-y .
- Pope C. A . Mortality effects of longer term exposures to fine particulate air pollution: review of recent epidemiological evidence. Inhal. Toxicol. 2007; 19(Suppl. 1): 33–38.
- Pope C. A. , Renlund D. G. , Kfoury A. G. , May H. T. , Horne B. D . Relation of heart failure hospitalization to exposure to fine particulate air pollution. Am. J. Cardiol. 2008; 102: 1230–1234.
- Pueschel R. F. , Van Valin C. C . Cloud condensation nucleus formation in a power plant plume. Atmos. Environ. 1978; 12: 307–312.
- Reddington C. I. , Carslaw K. S. , Spracklen D. V. , Frontoso M. G. , Collins L. , co-authors . Primary versus secondary contributions to particle number concentrations in the European boundary layer. Atmos. Chem. Phys. 2011; 11: 12007–12036. http://dx.doi.org/10.5194/acp-11-12007-2011 .
- Rieger D. , Bangert M. , Kottmeier C. , Vogel H. , Vogel B . Impact of aerosol on post-frontal convective clouds over Germany. Tellus B. 2014; 66: 22528.
- Rosenbohm E. , Vogt R. , Scheer V. , Nielsen O. J. , Dreiseidler A. , co-authors . Particulate size distributions and mass measured at a motorway during the BAB II campaign. Atmos. Environ. 2005; 39: 5696–5709.
- Rosenfeld D . Suppression of rain and snow by urban and industrial air pollution. Science. 2000; 287: 1793–1796.
- Schobesberger S. , Väänänen R. , Leino K. , Virkkula A. , Backman J. , co-authors . Airborne measurements over the boreal forest of southern Finland during new particle formation events in 2009 and 2010. Boreal Environ. Res. 2013; 18: 145–163.
- Song M. , Lee M. , Kim J. H. , Yum S. S. , Lee G. , co-authors . New particle formation and growth in relation to vertical mixing and chemical species during ABC-EAREX2005. Atmos. Res. 2010; 97: 359–370.
- Sporre M. K. , Swietlicki E. , Glantz P. , Kulmala M . Aerosol indirect effects on continental low-level clouds over Sweden and Finland. Atmos. Chem. Phys. 2014; 14: 12167–12179. http://dx.doi.org/10.5194/acp-14-12167-2014 .
- Stull R. B . An Introduction into Boundary Layer Meteorology. 1988; , London: Kluwer Academic Press. ISBN 978-94-009-3027-8.
- Suni T. , Kulmala M. , Hirsikko A. , Bergman T. , Laakso L. , co-authors . Formation and characteristics of ions and charged aerosol particles in a native Australian Eucalypt forest. Atmos. Chem. Phys. 2008; 8: 129–139.
- Van Poppel M. , Peters J. , Bleux N . Methodology for setup and data processing of mobile air quality measurements to assess the spatial variability of concentrations in urban environments. Environ. Pollut. 2013; 183: 224–233.
- VDI (The Association of German Engineers). 1992. Manual: Air Pollution Prevention, Environmental Meteorology, Atmospheric Dispersion Models. Kommission Reinhaltung der Luft�– Normenausschuss KRdL, VDI 3782, Part1. 15–20, Beuth Verlag, Berlin..
- Vogel B. , Vogel H. , Bäumer D. , Bangert M. , Lundgren K. , co-authors . The comprehensive model system COSMO-ART – Radiative impact of aerosol on the state of the atmosphere on the regional scale. Atmos. Chem. Phys. 2009; 9: 8661–8680. http://dx.doi.org/10.5194/acp-9-8661-2009 .
- Whitby K. T. , Cantrell B. K. , Kittelson D. B . Nuclei formation rate in a coal fire power plant plume. Atmos. Environ. 1978; 12: 313–321.
- Wiedensohler A. , Birmili W. , Nowak A. , Sonntag A. , Weinhold K. , co-authors . Mobility particle size spectrometers: harmonization of technical standards and data structure to facilitate high quality long-term observations of atmospheric particle number size distributions. Atmos. Meas. Tech. 2012; 5: 657–685.
- Wiegner M. , Emeis S. , Freudenthaler V. , Heese B. , Junkermann W. , co-authors . Mixing layer height over Munich, Germany: variability and comparisons of different methodologies. J. Geophys. Res. 2006; 111: 13201. http://dx.doi.org/10.1029/2005JD006593 .
- Wilson W. E . Sulfate formation in point source plumes: a review of recent field studies. Atmos. Environ. 1981; 15: 2573–2581.
- Wix A. , Brachert L. , Sinanis S. , Schaber K . A simulation tool for aerosol formation during sulphuric acid absorption in a gas cleaning process. J. Aerosol. Sci. 2010; 41: 1066–1079.
- Wulfmeyer V. , Behrendt A. , Kottmeier C. , Corsmeier U. , Barthlott C. , co-authors . The Convective and Orographically-induced Precipitation Study (COPS): the scientific strategy, the field phase, and research highlights. Q. J. Roy. Meteorol. Soc. 2011; 137: 3–30. http://dx.doi.org/10.1002/qj.752 .