
Abstract
The area of the Dead Sea valley and the adjacent regions are often affected by mineral dust. This study focuses on an extreme dust episode occurring on 22 March 2013, where near-surface dust concentrations of up to 7000 µg m−3 were encountered in the Dead Sea region. This episode is of great interest as it was accompanied by high wind speeds and a gust front that rapidly passed the Judean Mountains. Wind was even accelerated on the lee side of the Judean Mountains leading to a severe downslope wind. We simulated this situation with the comprehensive online-coupled weather forecast model COSMO-ART. Fair agreement was found between the simulated meteorological variables and the observations. The model was capable of producing a reasonable spatiotemporal distribution of near-surface dust concentration, consistent with available measurements in this area. With respect to the time of the maximum near-surface dust concentration in the Dead Sea valley, the model captured it almost perfectly compared to the observed total suspended particle (TSP) concentrations. COSMO-ART showed that the high near-surface dust concentration in the Dead Sea valley was mainly determined by local emissions. These emissions were caused by strong winds on the lee side of the Judean Mts. The model showed that an ascending airflow in the Dead Sea valley lifted dust particles, originating mainly from the upwind side of the Judean Mts., up to approximately 7 km. These dust particles contributed to the pronounced maximum in modelled dust aerosol optical depth (AOD) over the valley. Here we highlight the important point that the simulated maximum dust AOD was reached in the eastern part of the Dead Sea valley, while the maximum near-surface dust concentration was reached in the western part of the valley.
1. Introduction
The Dead Sea is a unique place on Earth with a water level currently 428 m below sea level. It is located within one of a series of basins aligned in a long (600 km) and narrow (10–20 km) active tectonic zone, which branches northward from the trough of the Red Sea (Neev and Emery, Citation1967). The Dead Sea is surrounded by the Judean Mountains (up to 1000 m amsl) to the west and by the Moab Mountains (up to 1300 m amsl) to the east. Through the pronounced orography, the area is characterised by special meteorological conditions, particularly by valley and slope winds. The wind regime in the Dead Sea basin is also governed by general synoptic systems, such as Mediterranean cyclones, and by mesoscale and local factors, such as Mediterranean breezes and local lake breezes (Shafir and Alpert, Citation2011, and references therein).
Mineral dust, which is abundant in the Dead Sea region most of the time (Singer et al., Citation2003, Citation2004), is of interest for several reasons. It has a negative impact on human health and it is of danger for technical equipment. Further on it has an impact on aviation by degrading visibility. Mineral dust aerosol modifies the state of the atmosphere by altering the shortwave and longwave radiative fluxes and cloud formation (Carslaw et al., Citation2010, and references therein). Due to its chemical composition, mineral dust deposited on land or on ocean surfaces can act as a fertilizer. In general, the mineral dust cycle is closely related to the iron cycle, the carbon cycle, and the energy cycle (Mahowald et al., Citation2005; Shao et al., Citation2011).
The lifetime of large dust particles with size of ~8–10 microns is approximately 1 d (Tegen and Lacis, Citation1996). Smaller dust particles with size less than 1 micron have a lifetime of approximately 10 d (Tegen and Lacis, Citation1996). Therefore, particles from local but also remote sources can affect the mineral dust aerosol budget in the Dead Sea region. Ganor (Citation1991) showed that the main remote source regions are the Ahaggar Massif Mountains (Algeria), the Tibesti (Chad, Lybia), deserts in Egypt and the Arabian Desert (Jordan, Saudi Arabia). He showed that transport is governed by strong westerly to south-westerly boundary layer winds especially by cold fronts, driven by low-pressure systems (1) arriving from Europe over Greece, (2) arriving from the North African dessert or (3) developing over the eastern Mediterranean (Cyprus). The last one is the case in this study. Modelling studies accomplished by Kishcha et al. (Citation2008) reinforced the results, that large dust particles reached the Dead Sea region from the Eastern Sahara, along their route through Egypt to Israel and Jordan. As verified in previous studies, the strength of Saharan dust transport is determined by two factors: (1) seasonal dependence on dust source strength in Africa (Barkan and Alpert, Citation2008), and (2) seasonal changes in the atmospheric circulation, i.e. the enhanced cyclonic activity of the eastern Mediterranean basin in winter (Moulin et al., Citation1998; Israelevich et al., Citation2002; Barkan et al., Citation2004; Dayan et al., Citation2007). Especially in the transition seasons (spring and autumn), increased dust transport from remote sources to the Dead Sea, in the form of dust storms, can be observed (Singer et al., Citation2003).
As the Jordan Rift valley is north–south oriented, Saharan Desert dust, which is transported by southerly wind, is able to pass the Dead Sea valley without major obstacles along this complex terrain. However, wind blowing perpendicularly to the above-mentioned mountain ridges and the Dead Sea valley, as observed mostly in winter (Ganor, Citation1991) can cause distinct spatiotemporal variations in dust concentration. Most previous studies (e.g. Nickovic et al., Citation2001; Alpert et al., Citation2002; Perez et al., Citation2006; Kishcha et al., Citation2007, Citation2008; Spyrou et al., Citation2013) carried out numerical simulations of dust transport and dust radiative effects over the Mediterranean region using models with a horizontal grid spacing of more than 20 km. Therefore, these model studies were not able to resolve the orographic features of the Dead Sea basin.
Vogel et al. (Citation2006) applied a mesoscale model with 2-km grid spacing to a case study of medium range dust transport over the Dead Sea valley. A limited region including the western Negev in Israel and neighbouring areas of the Sinai Peninsula was chosen as the potential source area for mineral dust aerosol. Therefore, long-range transport of dust was excluded and a further investigation of local sources was not included.
The purpose of the current study is to quantify the impact of remote (i.e. the Sahara Desert) as well as local sources on the mineral dust aerosol budget over the Dead Sea valley. A case associated with very high near-surface aerosol concentrations measured in the Dead Sea basin was chosen, where a Cyprus low and its frontal system caused favourable conditions for long-range transport from the Saharan Desert. The Cyprus low also induced high local dust emissions in the Dead Sea region by a severe gust front, which crossed Israel on that day. As gust fronts with their strong winds are often responsible for considerable dust uplifting in desert regions (Williams et al., Citation2006) local sources can be studied. We are using the comprehensive online-coupled model system COSMO-ART (Vogel et al., Citation2009) with a horizontal grid spacing of 0.025 ° (~3 km), which is necessary due to the complex orography of the Dead Sea valley.
Specifically, we are addressing the following questions: Is it possible to reproduce the observed high concentrations of mineral dust with model simulations? What are the physical processes that determine the spatiotemporal variation of the mineral dust concentration in the Dead Sea valley? What is the contribution of local and remote source regions to the total mineral dust concentration?
2. Model description
The COSMO-ART model is based on the COSMO (Consortium for Small-scale Modelling) model (Baldauf et al., Citation2011), which is used by several European weather services for numerical weather prediction. The ART (Aerosols and Reactive Trace gases) extension (Vogel et al., Citation2009) describes the spatiotemporal evolution of trace gases and aerosol particles and their interaction with the state of the atmosphere. COSMO-ART was used in recent studies to investigate the direct impact of aerosol on radiation (e.g. Lundgren et al., Citation2013; Athanasopoulou et al., Citation2014) as well as the interaction between aerosol, clouds, and precipitation (e.g. Bangert et al., Citation2012; Rieger et al., Citation2014).
Mineral dust aerosol is represented by prognostic mass and number densities of three overlapping log-normally distributed modes (Vogel et al., Citation2006). The emission scheme of Vogel et al. (Citation2006) combines the formulation of White (Citation1979) for the horizontal saltation flux of soil particles with the parameterisation of Shao and Lu (Citation2000) for the threshold friction velocity of wind erosion. The threshold friction velocity is corrected by factors taking into account soil-water content and surface roughness. By using a roughness correction, the impact of vegetation on dust production is considered. Dust is produced when the friction velocity exceeds the corrected threshold friction velocity. For the conversion of the saltation flux of soil particles into a mineral dust aerosol emission flux, the available kinetic energy is partitioned into the three mineral dust modes following the approach of Alfaro and Gomes (Citation2001).
In summary, dust productive areas in COSMO-ART are defined by soil properties (particle size distribution, residual soil moisture and surface roughness) and the environmental conditions (friction velocity, soil moisture). Accordingly, a data set of soil properties by Marticorena et al. (Citation1997) and Callot et al. (Citation2000) covering Sahara, Sahel, the Arabian Peninsula and the Middle East with a 1 °×1 ° grid spacing is used.
2.1. Model setup
The model simulations performed for this study need to capture mineral dust from remote sources as well as from the complex terrain bordering the valley, in particular taking into account the extreme elevation gradient around the Dead Sea valley. We therefore chose to perform a multiple nested simulation with the COSMO-ART model from 21 March 2013, 12 UTC, to 23 March 2013, 12 UTC. The simulation with the coarsest grid spacing receives its initial and boundary conditions from the German Weather Service's (DWD) global model GME. The extent of the three simulation domains is shown in .
Fig. 1 Map of the three COSMO-ART model domains CA-25, CA-7 and CA-3. The colours indicate the model terrain height.
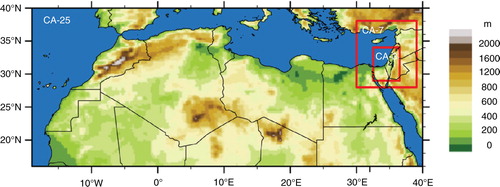
The simulation for the large domain (CA-25) is performed with 0.25 ° (~25 km) horizontal grid spacing and 40 non-equidistant vertical layers up to 22 km height. It includes remote dust sources located in the Sahara desert and in the Middle East. Mineral dust aerosol initial values are obtained from daily simulations starting 19 March 2013 with a dust-free atmosphere. Each of these daily simulations starts with the corresponding GME analysis and dust concentrations from the previous simulation. The middle domain (CA-7) with 0.0625 ° (~7 km) horizontal grid spacing and 40 vertical layers covers the eastern Mediterranean using initial and boundary conditions from the CA-25 simulation. The finest domain (CA-3) with its 0.025 ° (~3 km) horizontal grid spacing and 50 vertical layers uses initial and boundary conditions from the CA-7 simulation. The CA-3 simulation is capable of resolving the complex terrain in the Dead Sea area. The terrain height of the model domain and the extent of the CA-3 simulation are shown in .
Fig. 2 Left: CA-3 simulation domain and the positions of measurement stations outside of the Dead Sea valley. The red box shows domain of the additional simulations S2 and S3 (). Right: Same as left with zoom in on the Dead Sea region and the positions of the measurement stations. The colours indicate the model terrain height.
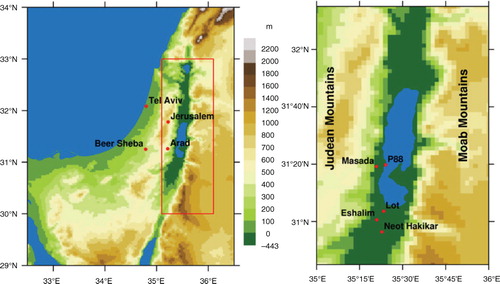
For this study, we performed additional model experiments in the immediate region of the Dead Sea valley (as will discussed in Section 5) covering the domain within the red box () with its western boundary roughly at the top of the Judean Mts.
3. Case study data
3.1. Aerosol observations
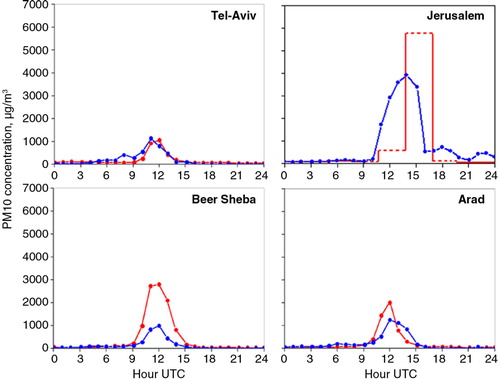
To study dust transport over the region under consideration, we used measurements of near-surface aerosol concentration from seven monitoring sites and three meteorological stations in Israel (). The aerosol measurement sites can be divided into the following two groups (): (1) Total suspended particle (TSP) monitoring sites in Lot, Eshelim and Neot Hakikar, which measure concentration of TSP. These sites are located in the south of the Dead Sea valley, at the artificial evaporation ponds. (2) PM10 monitoring sites in Beer-Sheba, Arad, Tel Aviv, and Jerusalem, which measure concentration of aerosol particles smaller than 10 µm. Beer-Sheba and Arad are in the southwest of Israel, but outside the valley. Arad is situated right on top of the Judean Mountains at approximately 600 m above mean sea level (amsl) and Beer-Sheba is located 40 km further to the west. Tel Aviv and Jerusalem are in the northwest of the Dead Sea, but also outside the valley. Tel Aviv is located directly at the coast of the Mediterranean Sea and Jerusalem is situated on top of the Judean Mountains at approximately 800 m amsl.
Table 1. TSP and PM10 monitoring sites together with meteorological stations are shown. The maximal measured surface aerosol concentration (C) on 22 March 2013, is given together with the annual 5 %, 50 %, and 95 % percentiles of surface aerosol concentration in the year 2013 (P5, P50, and P95) at the specified monitoring sites. Hourly TSP and PM10 data from January to December 2013 were used. For the station Jerusalem, 3-hourly data are presented
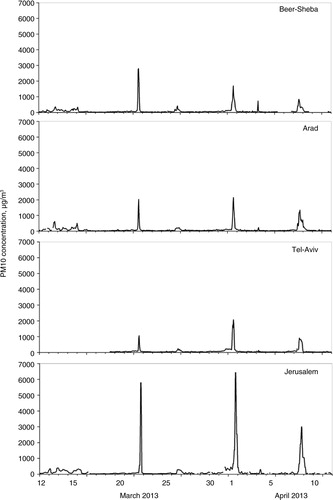
In irregular intervals, TSP/PM10 measurements show extremely high near-surface aerosol concentrations. This is illustrated in and , representing hourly TSP and PM10 measurements at the aforementioned monitoring sites during the 32-d period from 12 March to 11 April 2013. The observed peaks of near-surface aerosol concentration are almost coincident at all monitoring sites. These peaks significantly exceeded the annual 5 %, 50 % and 95 % percentiles (P5, P50 and P95) of measured surface aerosol concentration at the specified monitoring sites in the year 2013 (). This indicates the extraordinary high level of the dust events detected in the specified period.
Fig. 3 Time series of hourly concentration measurements of total suspended particles (TSPs) during the 32-d period from 12 March to 11 April 2013, at three stations in the Dead Sea valley.
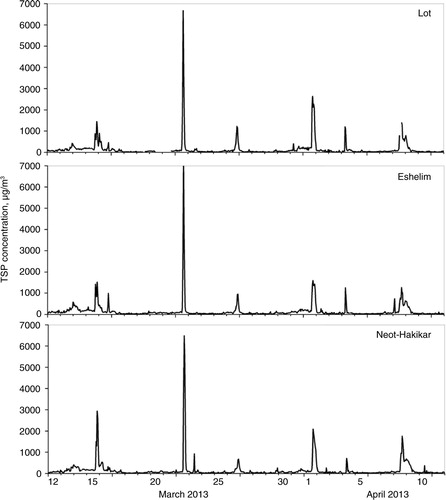
Extreme near-surface aerosol concentrations were observed simultaneously at all specified monitoring sites on 22 March 2013. In particular, at TSP monitoring sites in Lot, Eshelim and Neot Hakikar, TSP concentrations between ~6500 and ~7150 µg m−3 were measured on that date. These values were two orders of magnitude higher than their P50 (~50 µg m−3) and even approximately 30 times higher than their P95 (~200 µg m−3) (). Similarly, the observed PM10 concentration in Jerusalem was two orders of magnitude higher than its annual P50 (37 µg m−3) and 30 times higher than its P95 (169 µg m−3). The observed PM10 concentration in Tel Aviv was 1064 µg m−3 and therefore was one order of magnitude higher than its annual P95 (127 µg m−3) ().
and represent TSP and PM10 concentrations measured on 22 March 2013, at the specified seven aerosol monitoring sites. In the Dead Sea valley at 10 UTC, TSP concentrations started to increase slowly, but after 11 UTC concentrations increased rapidly from around 100 µg m−3 up to 7000 µg m−3 at 13 UTC and then decreased again to below 100 µg m−3 at 17 UTC (, red line). PM10 concentrations outside the valley in Beer-Sheba, Arad and Tel Aviv started to increase at 9 UTC: from below 100 µg m−3 up to 3000 µg m−3 in Beer-Sheba, up to 2000 µg m−3 in Arad and up to 1100 µg m−3 in Tel Aviv at 12 UTC (, red line). After the maximum was reached, the concentrations decreased to values below 100 µg m−3 within 3 hours. By contrast to other PM10 sites (where PM10 measurements were presented as 1-hour averaged data), at the Jerusalem site, PM10 measurements were presented as 3-hour averaged data (). In Jerusalem, PM10 concentrations started to increase slightly up to 500 µm m−3 at 11 UTC until 14 UTC, and then abruptly increased up to 5800 µg m−3 at 14 UTC. At 17 UTC, PM10 concentrations decreased down to 100 µm m−3 ().
Fig. 4 Time series of hourly PM10 measurements at four stations outside the Dead Sea valley are shown during the 32-d period from 12 March to 11 April 2013. At the Jerusalem site, PM10 measurements are presented as 3-hour averaged data.
3.2. Meteorological observations
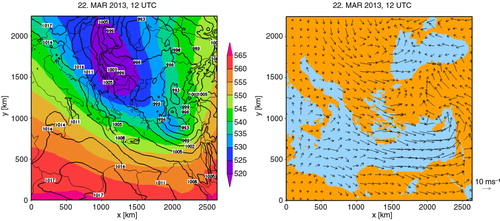
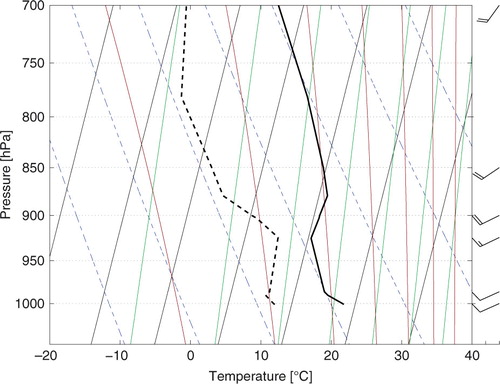
To understand the processes, which cause these extreme TSP and PM10 concentrations, we analyse the atmospheric conditions. On 22 March 2013, a low-pressure system with surface pressure below 995 hPa was located over the eastern Mediterranean, as illustrated by the spatial distribution of sea level pressure based on COSMO-EU analysis data (). At 6 UTC, this system created favourable conditions for dust uplifting from the Eastern Sahara and dust transport to the northwest into the eastern Mediterranean by mean wind velocities of up to 15 m s−1 near the surface (10 m height; not shown). At 12 UTC, the low-pressure system and its frontal system shifted eastwards, with increasing strong south-westerly to westerly wind with mean wind velocities up to 20 m s−1 (). The horizontal wind measured by soundings of the Israel Meteorological Service (IMS) at Bet Dagan near Tel Aviv increased within 24 hours decisively: On March 21, 12 UTC the wind in the whole layer below 700 hPa was between 1 and 5 m s−1. When the gust front originating from the Cyprus low reached Israel the mean wind increased up to 21 m s−1 and a temperature inversion between 925 hPa and 875 hPa stabilised the atmosphere (). A gust front accompanied by north–south-oriented medium-level clouds and remote dust transport from the southwest (satellite image, not shown) penetrated inland, reached Jerusalem, and caused severe downslope wind at the western coast of the Dead Sea. The frontal system with its high wind velocities did not only transport dust from remote locations but also caused local dust emission, depending on the availability of local dust sources. In Beer-Sheba and Arad located at the northern edge of the Negev, as well as in the Dead Sea valley, local dust sources are well available. The waterfront location of Tel Aviv and the agricultural and industrial land use around Tel Aviv suppresses local dust mobilisation. However, around Jerusalem located on top of the Judean Mountains, local dust sources are available as well.
Fig. 5 Surface TSP concentrations: COSMO-ART model results (blue) and observations (red) on 22 March 2013, are shown.
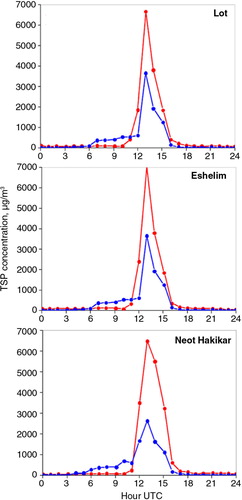
Fig. 6 Surface PM10 concentrations: COSMO-ART model results (blue) and observations (red) on 22 March 2013, are given. At the Jerusalem site, PM10 measurements are presented as 3-hour averaged data.
For further analysis of the dust episode under consideration, the meteorological conditions in Jerusalem and in the Dead Sea valley are investigated. Therefore, data of three meteorological stations are used. One station is operated by the IMS in Jerusalem at 810 m amsl. The other two meteorological stations are operated by the Institute of Meteorology and Climate Research (IMK) of the Karlsruhe Institute of Technology (KIT), at Masada and P88, both located in the Dead Sea valley, approx. 30–40 km north of the TSP measurement sites Lot, Eshelim, and Neot Hakikar (). Measurements in Jerusalem are shown in . The front passes Jerusalem at approximately 10 UTC on 22 March. At this time, the air pressure reaches its minimum and temperature reaches its maximum at 26.1 °C. At the same time, wind direction changes from south to west and wind speed increases suddenly from 5 to 10 m s−1. After 10 UTC temperature decreases rapidly, westerly wind with persistent high wind speed around 10 m s−1 is measured and pressure increases slowly. With the front passage, PM10 concentration starts to increase at 11 UTC.
Fig. 7 Left: Sea level pressure (hPa) (black contour lines) and 500 hPa geopotential (gpdam) (coloured). Right: 10-m wind vectors (m s−1). Both figures show data of COSMO-EU analysis at 22 March 2013, 12:00 UTC.
The meteorological conditions in the valley can be analysed by using data of the meteorological stations at Masada and P88. The observations at those two stations can well explain the far above average increasing dust concentrations at the Dead Sea, compared to the measurements at sites closer to the Mediterranean Sea. and shows measurements at the two meteorological stations.
The arrival of the gust front can be detected first at the Masada station, located 5 km to the west of the Dead Sea shoreline, at −7 m amsl. At 09:30 UTC, the shortwave downward radiation starts to decrease by 90 % from 800 to 80 W m−2 at 10:40 UTC (). Simultaneously the longwave downward radiation increases from 380 to 470 W m−2. Within 70 minutes the sky changed from blue sky to low visibility due to overcast sky with deep, low clouds. This is the time (10:40 UTC) where the gust front reaches the Masada site. The 10-minute mean wind speed increases during the next 70 minutes from 1 to 13 m s−1 (). Common gust factors, which are used to estimate wind gusts from 10 minute mean wind speed, vary in the range of 1.5–2 (e.g. Davis and Newstein, Citation1968; Choi and Hidayat, Citation2002). This indicates gusts of up to 25 m s−1, which the WMO classifies as a severe storm. The wind direction swaps from south-east to west at 10:50 UTC. As the Masada station is located at the hill slope, the downward vertical wind increases from 0.0 up to 2.8 m s−1 on 10 minutes average between 10:50 UTC and 11:40 UTC. Within the gust front a high load of dust is transported from the west (high dust concentrations are observed at Arad and Beer-Sheba) but additional local dust raise is plausible due to the local dust sources near Masada and the extreme gusty wind, which explains the maximum TSP concentrations of about 7000 µg m−3 in the valley.
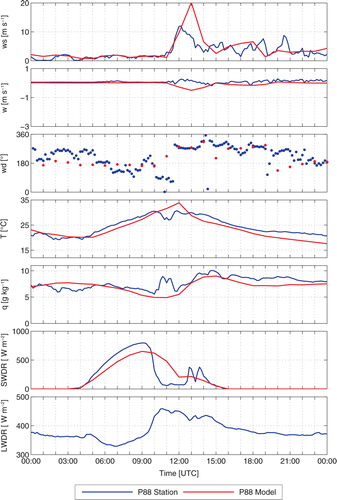
At 10:00 UTC, the air temperature stops increasing at 28 °C at Masada caused by further reduced incoming shortwave radiation and by simultaneously increasing longwave downward radiation due to increasing cloud cover and high concentrations of mineral dust. This is 30 minutes after the beginning of the solar radiation reduction. Afterwards the temperature keeps constant until 10:40 UTC and increases within 10 minutes up to 32 °C at 10:50 UTC, when the downslope windstorm starts. This sudden increase is assumed to be caused by adiabatic heating of the descending dry air. At P88 station, located very close to the Dead Sea shore (150 m), an increase of the wind speed and turning to west is detected approximately 60 minutes later than at Masada (). Taking the propagation speed of the gust front into account, this is much too late for the 5-km short distance. Due to the local conditions at the station and the stratification of the boundary layer, a lifted flow (gust front) is expected at P88. When wind speed is at its maximum at Masada, the flow reaches the surface level at P88 as well and the wind turns from east-southeast to west. The station is located within a plain near the Dead Sea, so the mean vertical wind remains close to zero.
4. Comparison with observations
In the following, we describe the results of numerical simulations. Those results will help to interpret the physical processes that lead to the observed patterns of meteorological variables and dust concentration. Further on, we will use the model simulations to determine the source regions of mineral dust that lead to the high concentrations and quantify the contribution of long-range transport and local dust emissions.
As mentioned before, the complex topography of the Dead Sea region is a challenge for numerical models we want to tackle with a comparatively fine horizontal grid spacing of 0.025 ° (~3 km). We first compare the results of the CA-3 simulation with the meteorological measurements at Jerusalem, Masada, and P88 and with the PM10 measurements at four stations located west of the Dead Sea region and three TSP stations located on the floor of the Dead Sea valley (for the locations of the stations, see ).
4.1. Meteorological variables
shows a spatial distribution of the simulated 10 m wind on 22 March, 13:00 UTC. Every tenth wind arrow is presented. While in the western and the northern part of the model domain westerly to north-westerly wind is simulated, southerly wind is still present in the south-eastern part of the model domain indicating the position of the front at that time.
Fig. 8 SkewT–logP diagram of measured temperature (solid line), dew point (dashed line), and wind (in m s−1) on 22 March, 2013, 12:00 UTC at Bet Dagan.
The comparison of the simulated wind speed, wind direction and temperature at Jerusalem shows in general a very good agreement with the observations (). However, the simulated wind speed increases with a time delay of about 1 hour. The simulated wind maximum is reached at 14:00 UTC while the observations show a more plateau like structure. The wind direction and its shift starting after 09:00 UTC are perfectly reproduced by the model. The measured daily variation of the temperature at two meter height is reproduced quite well by the model, but the temperature maximum is simulated about 1 hour later than the observed one. The simulated pressure reproduces the time series of the observations with a slight time shift. The offset of the absolute values is due to the difference between real terrain height and terrain height used in the model.
The comparison of the time series of horizontal wind speed measurements at the Masada station (, blue line) with simulated wind speed (red line) shows in general a very good agreement. However, the maximum measured wind speed of about 13 m s−1 occurring at 22 March, 12 UTC, is shifted to 13 UTC in the model simulation and the value of about 18.5 m s−1 is off by 40 %. This is probably due to the smoothed orography in the model, which is not able to resolve the small-scale inhomogeneity around the measurement site. The Masada station is situated at the slope of the Judean Mountains. The measured as well as the simulated wind directions () show a clear westerly direction when the maxima occur. That means that the maximum horizontal wind speed is associated with a downslope accelerated gust front. For the P88 station, which is located close to the Dead Sea shoreline downhill of the Masada station, the general conclusions are similar as for Masada.
The descent of the airflow becomes obvious in the time series of the vertical wind speed at the Masada station (). Around 22 March, 12 UTC, a vertical downward wind speed of more than 2 m s−1 is measured. This maximum in downward motion is also simulated by COSMO-ART, although it is not as pronounced as in the measurements and it is shifted by about 1 hour. The latter is directly connected to the shift in the horizontal wind speed, i.e. the arrival of the gust front is delayed in the simulation in comparison to the observations.
With the gust front setting in on 22 March, 12 UTC, the temperature drops much faster in the simulation leading to an underestimation of the temperature for the following.
The observed incoming shortwave radiation at the surface shows a sharp drop when the wind speed increases. This decrease is less pronounced in the simulation results and happens more slowly.
4.2. Dust concentration
We validate the simulated mineral dust concentrations by using TSP and PM10 measurements at the specified measurement sites mentioned in Section 3. For this purpose, we assume that the measured maximum concentrations on 22 March are exclusively caused by mineral dust. This is justified by the very low background concentrations before and after the gust front reached the stations ( and ).
Modelled (~10 m above ground) and measured near-surface dust concentrations on 22 March 2013, are shown in and . At Lot, Eshelim and Neot Hakikar, the model underestimates the observed TSP concentrations by a factor of 1.5–2.0 (). The time, when the maximum occurs (13:00 UTC), is well captured by the model. There could be two factors responsible for this underestimation, such as (a) the contribution of large dust particles (>20 µm), which are not taken into consideration by the model; and (b) the insufficient information of soil data which is important input data for the dust emission scheme (discussed below in this section).
At Tel Aviv, the simulated and observed PM10 concentrations are in good agreement (). The maximum occurs 1 hour earlier in the simulation. At Beer-Sheba and Arad, the model underestimates the measured concentrations. The maximum concentration is reached at both stations at 12:00 UTC in perfect agreement with the observations. In Jerusalem, although the simulated dust maximum is comparable to the observed one, the simulated maximum is reached 1 hour earlier than the observation (). It is also interesting to see that the maximum concentration at Jerusalem occurs quite late in the simulations as well as in the observations.
The model results — especially the strong correlation of the dust concentration and the wind speed — give an indication that mainly local emissions are responsible for the concentration peaks at all stations. The increasing wind speed is caused by the passage of a gust front, as illustrated in Section 3. Particularly at the slopes down to the Dead Sea for a short period of time the flow is even accelerated by the stable stratification at the crest height (). For a better understanding of the underestimation of the concentration level at the stations Beer-Sheba, Lot, Eshelim, and Neot Hakikar, shows the spatial distribution of the simulated dust concentration at 22 March, 13:00 UTC, in the lowest model layer. In an area between 30.5 °N–31.5 °N and 32.5 °E–35.5 °E, much lower dust concentrations are simulated than in the adjacent regions. We attribute this to the deviations of the soil properties used as input data for the dust emission scheme (Section 2). These obviously missing sources of mineral dust explain the underestimation of the dust concentrations in the southern part of the model domain. It highlights the necessity for a further improvement of the soil data set. This was originally established for climate simulations at a much coarser resolution than we used in our study here.
5. Long-range versus short-range transport of dust
As the synoptic situation as well as the general behavior of TSP and PM10 concentrations is reproduced satisfactorily by COSMO-ART, we use model simulations to investigate the contribution of long-range and short-range transport.
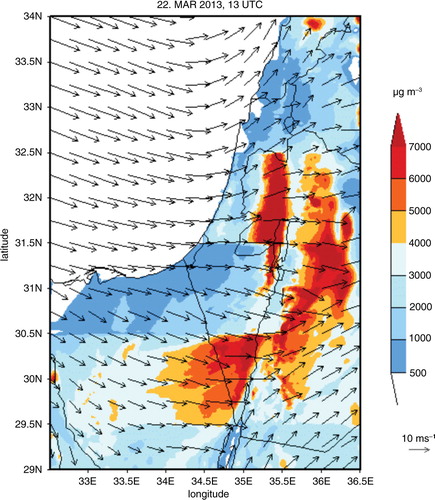
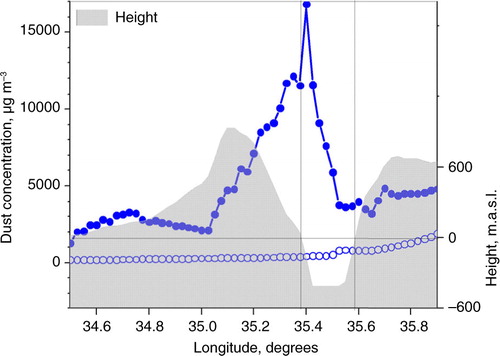
For this purpose, we carried out an additional simulation S1 () where we did not allow any dust emissions in area CA-3. Based on the results of this simulation, we can quantify the contribution of long-range transport from the Saharan Desert. provides the variability of the total dust concentration in the lowest model layer in west–east direction for the standard simulation CA-3 and for simulation S1 on 22 March, 13:00 UTC, at 31.6 ° N. The results clearly show that, at this specific situation, the contribution of Saharan dust to the near-surface concentration is negligible. Therefore, local dust sources have to be responsible for the high dust concentrations in the Dead Sea valley. represents west–east cross-sections over the Dead Sea valley of simulated near-surface dust concentration in the lowest model level on 22 March 2013, at 13:00 UTC, at several latitudes. Here, the modelled total dust mass concentration is given, i.e. including particles with sizes larger than 10 µm. In all cross-sections, the maximum dust concentration is obtained close to the western part of the valley floor (). To explain this dust distribution in the valley, we analysed the relationship between the modelled wind velocity along the lee side of the Judean Mts. during the passage of the gust front and the modelled near-surface dust concentration. gives the spatial distribution of the horizontal wind vectors at 13:00 UTC at approximately 10 m above surface. It shows that wind speeds well above 10 m s−1 at the western crests and slopes are simulated.
Fig. 9 Measurements and model results of surface meteorological parameters: wind speed (ws), wind direction (wd), temperature (T) and air pressure (P) at the meteorological station of the IMS in Jerusalem on 22 March 2013.
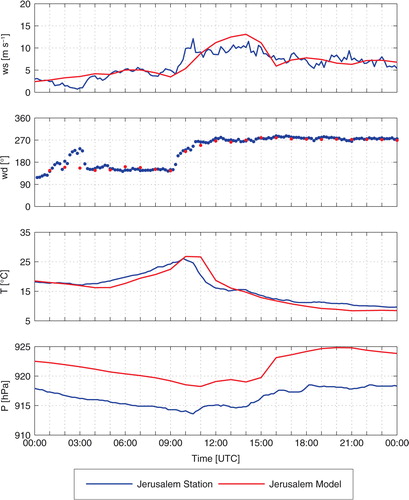
Fig. 10 Measurements and model results of surface meteorological parameters: wind speed (ws), vertical wind speed (w), wind direction (wd), temperature (T), specific humidity (q), shortwave downward radiation (SWDR) and longwave downward radiation (LWDR) at the meteorological station Masada on 22 March 2013.
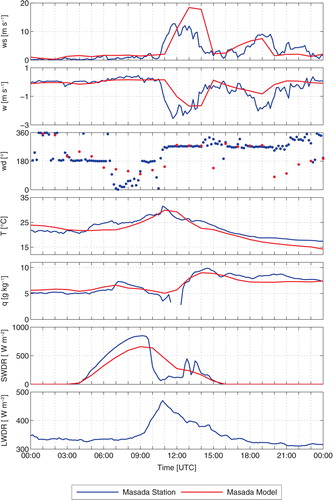
Table 2. Overview of all simulations performed for this study. The simulations cover 21 March, 12 UTC, to 23 March, 12 UTC. For further details, see Section 2
In order to demonstrate the effect of the gust front passage on vertical airflows over the Judean Mts. and over the Dead Sea valley, shows west–east vertical cross-sections of modelled vertical wind at latitude 31.6 ° N on 22 March 2013, at different times. While before 12:00 UTC only moderate vertical wind is simulated, it increases dramatically when the gust front passes the area. The most intensive descending and ascending airflows in the Dead Sea valley occur at 13:00 UTC. These are characterised by a maximum downward velocity of over 1.5 m s−1 on the lee side of the Judean Mountains. A maximum upward velocity of over 2 m s−1 is simulated in the centre of the Dead Sea valley (d). The strong ascending airflow, produced by the gust front in the centre of the valley, attained an altitude of over 4500 m.
Fig. 11 Measurements and model results of surface meteorological parameters: wind speed (ws), vertical wind speed (w), wind direction (wd), temperature (T), specific humidity (q), shortwave downward radiation (SWDR) and longwave downward radiation (LWDR) at the meteorological station P88 on 22 March 2013.
High horizontal wind speed () that enhanced local dust emissions and descending flow on the lee side of the Judean Mts. () explains the high dust concentrations close to the western part of the valley floor. Both descending and ascending flow have an impact on the vertical distribution of mineral dust in the Dead Sea valley as will be shown below.
a gives a vertical cross-section of the total dust concentration at latitude 31.6 °N on 22 March 2013, at 13:00 UTC. The model shows an important effect of the passage of the gust front on the vertical distribution of the dust layer over the Judean Mts. and over the Dead Sea valley. In the western Dead Sea valley, close to the Judean Mts., a pronounced near-surface as well as an elevated secondary maximum is simulated (a). In the eastern Dead Sea valley, an ascending airflow lifted dust particles up to approximately 7 km, contributing to the pronounced maximum in modelled dust aerosol optical depth (AOD) of approximately 3 over the valley (b). Therefore, while the maximum near-surface dust concentration was reached in the western part of the Dead Sea valley, the maximum AOD (and, consequently, the maximum effect on surface shortwave radiation) was reached in the eastern part of the Dead Sea valley.
Fig. 12 Spatial distribution of the simulated dust concentration (µg m−3) in the lowest model layer on 22 March 2013, 13:00 UTC is shown. Additionally, wind speed and direction are indicated by every tenth 10-m wind arrow.
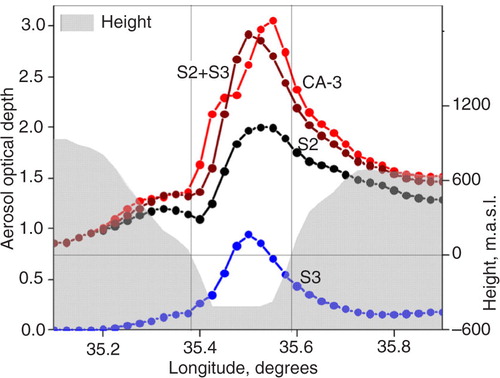
In order to further quantify the contributions of different local dust sources to the dust concentrations in the Dead Sea valley, it is essential to estimate separately the contribution of dust in the Dead Sea valley made by local dust emissions on the lee side of the Judean Mts., and that, made by incoming dust from the upwind side of the Judean Mountains. This was carried out by two additional sensitivity runs as explained in the following. Both simulations S2 and S3 () were performed with a horizontal grid spacing of 0.025 ° (~3 km) in the model domain, depicted by the red rectangle in . This rectangle was nested in model domain CA-3. In simulation S2, no emissions were allowed within the rectangle. By contrast, in simulation S3, emissions were allowed only within the red rectangle, while zero lateral boundary conditions were prescribed for mineral dust.
shows vertical cross-sections of the total dust concentration for simulations S2 (a) and S3 (b) on March 22, at 13:00 UTC, at latitude 31.6 °N. In simulation S2 (when we turned off all dust emissions within the red rectangle), the secondary elevated maximum in the western Dead Sea valley as well as the large vertical extent at the AOD maximum in the eastern Dead Sea valley can be seen (a and c). In simulation S3 (when only dust emissions within the red rectangle were allowed), we can identify very high near-surface concentrations at the lee side of the Judean Mts. (b). From that, we can conclude that the near-surface concentration was mainly determined by local emissions in the valley, caused by the strong surface wind on the lee side of the Judean Mts. At higher elevation, transport from the upwind side of the Judean Mts. comes into play and produces an essential impact on the vertical distribution of dust over the Dead Sea valley.
Fig. 13 West-east cross-section of COSMO-ART modelled dust concentration in the lowest model layer (~ 10 m above surface) at 31.6 °N, on 22 March 2013, at 13 UTC. The line with closed circles represents surface dust concentration of the standard simulation CA-3, while the line with open circles represents near-surface dust concentration for simulation S1 (when no dust emissions were allowed inside the CA-3 domain). The horizontal line represents the sea level. The two vertical lines show the interval of longitudes with topographic heights below sea level.
Furthermore, based on data from simulation S2, incoming dust from the upwind side of the Judean Mts. is responsible for the maximum in dust AOD of approximately two over the valley (c). Based on data from simulation S3, dust from local dust emissions along the lee side of the Judean Mts. is responsible for the AOD maximum of one, which is only half of that produced by incoming dust (d).
The superposition of AOD values from simulation S2 and S3 shows similarity to the AOD distribution based on simulations CA-3: the superposition was capable of reproducing the pronounced maximum of AOD over the Dead Sea valley from simulation CA-3 (). This permitted us to quantify the contribution of various source regions to the pronounced maximum of dust AOD in the Dead Sea valley. Overall 30 % of the maximum dust AOD over the Dead Sea valley stems from local emissions and about 70 % from more remote ones from the upwind side of the Judean Mountains.
Fig. 14 West-east cross-sections over the Dead Sea valley of (blue lines) modelled near-surface dust concentration and (grey colour) orography at specified latitudes from 31.05 °N to 31.7 °N on 22 March, 2013, at 13:00 UTC. In each cross-section, the horizontal line represents the sea level, while the two vertical lines show the interval of longitude with topographic height below sea level. The right panel represents the Google map of the Dead Sea valley, indicating the locations of the cross-sections (white lines).
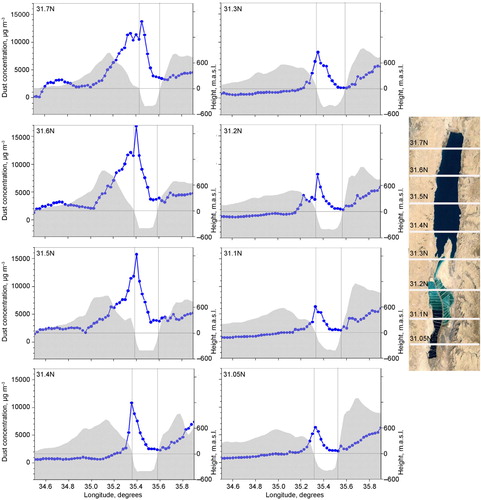
Fig. 15 The diagram shows the west–east cross-sections of modelled vertical wind speed (m s−1) at latitude 31.6 °N over the north of the Dead Sea valley from 10 UTC to 13 UTC on 22 March 2013. Positive values of the vertical velocity correspond to an ascending airflow, while negative values correspond to a descending airflow.
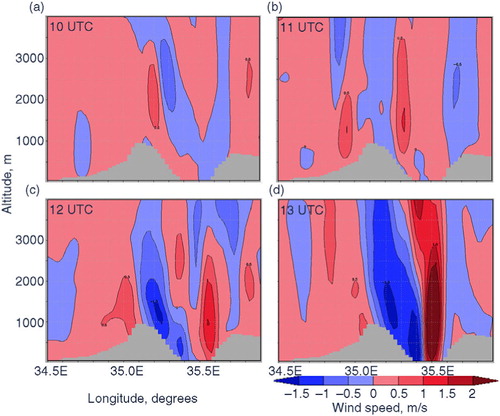
Fig. 16 West–east cross-sections of modelled (a) dust concentration and (b) dust aerosol optical depth (AOD) at latitude 31.6 °N over the north of the Dead Sea valley on 22 March 2013, at 13 UTC.
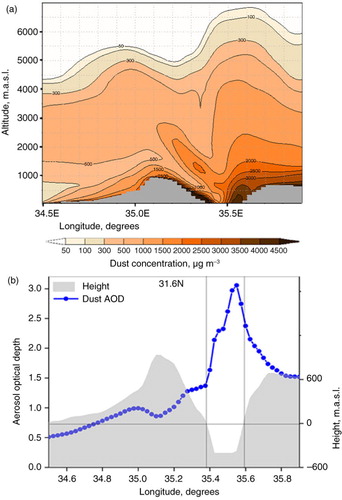
Fig. 17 West–east cross-sections of modelled dust concentration for simulations (a) S2 and (b) S3 over the north of the Dead Sea valley at latitude 31.6 °N on 22 March 2013, at 13 UTC. Lower panel: modelled dust AOD for (c) S2 and (d) S3 in the same cross-section as in (a) and (b).
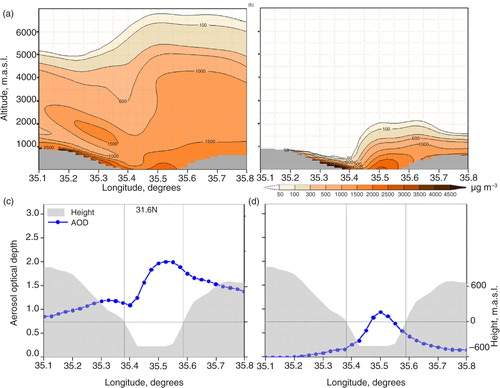
Fig. 18 Comparisons of modelled dust AOD for simulations CA-3, S2, S3, as well as for the superposition of S2 and S3 (S2 + S3), over the north of the Dead Sea valley (at latitude 31.6 °N) on 22 March 2013, at 13 UTC.
6. Conclusions
The area of the Dead Sea valley and the adjacent regions are often influenced by high mass concentrations of mineral dust and thus affecting atmospheric processes, human health and technical infrastructure. Therefore, there is an increasing interest in forecasting such events.
This study focuses on an extreme dust event occurring on 22 March 2013 where near-surface dust concentrations of up to 7000 µg m−3 were encountered in the Dead Sea region. This near-surface dust concentration was two orders of magnitude higher than the annual averaged surface dust concentration in the Dead Sea valley.
This event is of great interest as both long-range and short-range transport can be investigated. The event was driven by a Cyprus low and its frontal system, causing favourable conditions for long-range transport to the investigation area. It was accompanied by high wind speeds and a gust front that rapidly passed the Judean Mountains on 22 March 2013. Wind was even accelerated on the lee side of the Judean Mountains leading to a severe downslope wind. We simulated this situation with the comprehensive online-coupled weather forecast model COSMO-ART.
Reasonable agreement was found between the simulated meteorological variables and the observations. The model also reproduced the spatiotemporal distribution of near-surface dust concentration, consistent with available measurements, in the Dead Sea valley and the surrounding areas. With respect to the time of the maximum near-surface dust concentration in the Dead Sea valley, the model captured it almost perfectly when compared with the observed TSP concentrations.
We used the results of the model simulations, including sensitivity studies, to get a more complete three-dimensional picture of this dust episode and to quantify the contribution of different source regions. COSMO-ART showed that the high near-surface dust concentration up to 7000 µg m−3 in the Dead Sea valley was mainly determined by local emissions, and long-range transport was negligible in this case. These emissions were caused by the strong downslope wind on the lee side of the Judean Mts.
Model simulations S2 and S3 () permitted us to quantify the contribution of various source regions to the pronounced maximum of dust AOD in the Dead Sea valley. Specifically 30 % of the maximum dust AOD stems from local emissions and about 70 % from more remote ones from the upwind side of the Judean Mountains. The model showed that an ascending airflow in the Dead Sea valley lifted dust particles (originated mainly from the upwind side of the Judean Mts.) up to approximately 7 km. These dust particles contributed to the pronounced maximum in modelled dust AOD of approximately the value of three over the valley. This highlights an important point that the maximum dust AOD was reached in the eastern part of the Dead Sea valley, while the maximum surface dust concentration was reached in the western part of the valley.
7. Acknowledgements
The current study was carried out in the framework of the Virtual Institute DEad SEa Research Venue (DESERVE; www.deserve-vi.net), funded by the German Helmholtz Association under VH-VI-527. The project DESERVE aims at studying coupled atmospheric, hydrological, and lithospheric processes in the Dead Sea region. Furthermore, it enables risk assessments with respect to environmental risk, water availability, and climate change. Special thanks to Israel Meteorological Service (IMS) for providing the meteorological data taken in Jerusalem, and to the Israel Ministry of the Environment Protection for providing us with TSP and PM10 measurements of surface aerosol concentration.
References
- Alfaro S. C., Gomes L. Modelling mineral aerosol production by wind erosion: Emission intensities and aerosol size distributions in source areas. J. Geophys. Res.-Atmos. 2001; 106(D16):18075–18084. DOI: http://dx.doi.org/10.1029/2000JD900339.
- Alpert P., Krichak S., Tsidulko M., Shafir H., Joseph J. H. A dust prediction system with TOMS initialization. Mon. Weather Rev. 2002; 130: 2335–2345. DOI: http://dx.doi.org/10.1175/1520-0493(2002)130<2335:ADPSWT>2.0.CO;2.
- Athanasopoulou E., Rieger D., Walter C., Vogel H., Karali A., co-authors. Fire risk, atmospheric chemistry and radiative forcing assessment of wildfires in eastern Mediterranean. Atmos. Environ. 2014; 95: 113–125. DOI: http://dx.doi.org/10.1016/j.atmosenv.2014.05.077.
- Baldauf M., Seifert A., Förstner J., Majewski D., Raschendorfer M., co-authors. Operational convective-scale numerical weather prediction with the COSMO model: Description and sensitivities. Mon. Weather Rev. 2011; 139(12):3887–3905. DOI: http://dx.doi.org/10.1175/MWR-D-10-05013.1.
- Bangert M., Nenes A., Vogel B., Vogel H., Barahona D., co-authors. Saharan dust event impacts on cloud formation and radiation over Western Europe. Atmos. Chem. Phys. 2012; 12(9):4045–4063. DOI: http://dx.doi.org/10.5194/acp-12-4045-2012,2012.
- Barkan J., Alpert P. Synoptic patterns associated with dusty and non-dusty seasons in the Sahara. Theor. Appl. Climatol. 2008; 94: 153–162. DOI: http://dx.doi.org/10.1007/s00704-007-0354-9.
- Barkan J., Kutiel H., Alpert P., Kishcha P. Synoptics of dust intrusion days from the African continent into the Atlantic Ocean. J. Geophys. Res. 2004; 109: D08201. DOI: http://dx.doi.org/10.1029/2003JD004416.
- Callot Y., Marticorena B., Bergametti G. Geomorphologic approach for modelling the surface features of arid environments in a model of dust emissions: Application to the Sahara desert. Geodinamica Acta. 2000; 13(5):245–270. DOI: http://dx.doi.org/10.1016/S0985-3111(00)01044-5.
- Carslaw K. S., Boucher O., Spracklen D. V., Mann G. W., Rae J. G. L., co-authors. A review of natural aerosol interactions and feedbacks within the Earth system. Atmos. Chem. Phys. 2010; 10(4):1701–1737. DOI: http://dx.doi.org/10.5194/acp-10-1701-2010.
- Choi E. C. C., Hidayat F. A. Gust factors for thunderstorm and non-thunderstorm winds. J. Wind Eng. Ind. Aerodyn. 2002; 90: 1683–1696. DOI: http://dx.doi.org/10.1016/S0167-6105(02)00279-9.
- Davis F. K., Newstein H. The variation of gust factors with mean wind speed and with height. J. Appl. Meteor. 1968; 7: 372–378. DOI: http://dx.doi.org/http://dx.doi.org/10.1175/1520-0450(1968)007<0372:TVOGFW>2.0.CO;2.
- Dayan U., Ziv B., Shoob T., Enzel Y. Suspended dust over southeastern Mediterranean and its relation to atmospheric circulations. Int. J. Climatol. 2007; 28: 915–924. DOI: http://dx.doi.org/10.1002/joc.1587.
- Ganor E. The composition of clay minerals transported to Israel as indicators of Saharan dust emission. Atmos. Environ. 1991; 25: 2657–2664. DOI: http://dx.doi.org/10.1016/0960-1686(91)90195-D.
- Israelevich P. L., Levin Z., Joseph J. H., Ganor E. Desert aerosol transport in the Mediterranean region as inferred from the TOMS aerosol index. J. Geophys. Res. 2002; 107(D21):4572. DOI: http://dx.doi.org/10.1029/2001JD002011.
- Kishcha P., Alpert P., Shtivelman A., Krichak S., Joseph J. H., co-authors. Forecast errors in dust vertical distributions over Rome (Italy): Multiple particle size representation and cloud contributions. J. Geophys. Res. 2007; 112: 15205. DOI: http://dx.doi.org/10.1029/2006JD007427.
- Kishcha P., Nickovic S., Ganor E., Kordova L., Alpert P. Saharan dust over the Eastern Mediterranean: Model sensitivity. 2008. Air Pollution Modelling and Its Application XIX (eds. C. Borego and A. M. Miranda). Chapter 4.2, Springer Publisher, Netherlands, pp. 1874–6519. DOI: http://dx.doi.org/10.1007/978-1-4020-8453-9_39, 358–366.
- Lundgren K., Vogel B., Vogel H., Kottmeier C. Direct radiative effects of sea salt for the Mediterranean region under conditions of low to moderate wind speeds. J. Geophys. Res.-Atmos. 2013; 118(4):1906–1923. DOI: http://dx.doi.org/10.1029/2012JD018629.
- Mahowald N. M., Baker A. R., Bergametti G., Brooks N., Duce R. A., co-authors. Atmospheric global dust cycle and iron inputs to the ocean. Global Biogeochem Cy. 2005; 19(4): GB4025. DOI: http://dx.doi.org/10.1029/2004GB002402.
- Marticorena B., Bergametti G., Aumont B., Callot Y., N'doumé C., co-authors. Modeling the atmospheric dust cycle: 2. Simulation of Saharan dust sources. J. Geophys. Res.-Atmos. 1997; 102(D4):4387–4404. DOI: http://dx.doi.org/10.1029/96JD02964.
- Moulin C., Lambert C. E., Dayan U., Masson M., Ramonet P., co-authors. Satellite climatology of African dust transport in the Mediterranean atmosphere. J. Geophys. Res. 1998; 103 13,137–13,144. DOI: http://dx.doi.org/10.1029/98JD00171.
- Neev D. , Emery K. O . The Dead Sea, depositional processes and environments of evaporites. Geol. Surv. Isr. Bull. 1967; 41: 1–147.
- Nickovic S., Kallos G., Papadopoulos A., Kakaliagou O. A model for prediction of desert dust cycle in the atmosphere. J. Geophys. Res. 2001; 106: 18113–18129. DOI: http://dx.doi.org/10.1029/2000JD900794.
- Perez C., Nickovic S., Baldasano J. M., Sicard M., Rocadenbosch F., co-authors. A long Saharan dust event over the western Mediterranean: Lidar, sun photometer observations, and regional dust modelling. J. Geophys. Res. 2006; 111: D15214. DOI: http://dx.doi.org/10.1029/2005JD006579.
- Rieger D., Bangert M., Kottmeier C., Vogel H., Vogel B. Impact of aerosol on post-frontal convective clouds over Germany. Tellus B. 2014; 66: 22528. DOI: http://dx.doi.org/10.3402/tellusb.v66.22528.
- Shafir H., Alpert P. Regional and local climatic effects on the Dead Sea evaporation. Clim. Change. 2011; 105: 455–468. DOI: http://dx.doi.org/10.1007/s10584-010-9892-8.
- Shao Y. , Lu H . A simple expression for wind erosion threshold friction velocity, J. Geophys. Res. Atmos. 2000; 105(D17): 22437–22443.
- Shao Y., Wyrwoll K. H., Chappell A., Huang J., Lin Z., co-authors. Dust cycle: An emerging core theme in Earth system science. Aeolian Res. 2011; 2(4):181–204. DOI: http://dx.doi.org/10.1016/j.aeolia.2011.02.001.
- Singer A., Dultz S., Argaman E. Properties of the non-soluble fractions of suspended dust over the Dead Sea. Atmos. Environ. 2004; 38: 1745–1753. DOI: http://dx.doi.org/10.1016/j.atmosenv.2003.12.026.
- Singer A., Ganor E., Dultz S., Fischer W. Dust deposition over the Dead Sea. J. Arid Environ. 2003; 53: 41–59. DOI: http://dx.doi.org/10.1006/jare.2002.1023.
- Spyrou C., Kallos G., Mitsakou C., Athanasiadis P., Kalogeri C., co-authors. Modeling the radiative effects of desert dust on weather and regional climate. Atmos. Chem. Phys. 2013; 13: 5489–5504. DOI: http://dx.doi.org/10.5194/acp-13-5489-2013.
- Tegen I., Lacis A. A. Modeling of particle size distribution and its influence on the radiative properties of mineral dust aerosol. J. Geophys. Res. 1996; 101: 19237–19244. DOI: http://dx.doi.org/10.1029/95JD03610.
- Vogel B., Hoose C., Vogel H., Kottmeier C. A model of dust transport applied to the Dead Sea area. Meteorologische Zeitschrift. 2006; 15: 611–624. DOI: http://dx.doi.org/10.1127/0941-2948/2006/0168.
- Vogel B., Vogel H., Bäumer D., Bangert M., Lundgren K., co-authors. The comprehensive model system COSMO-ART – Radiative impact of aerosol on the state of the atmosphere on the regional scale. Atmos. Chem. Phys. 2009; 9: 8661–8680. DOI: http://dx.doi.org/10.5194/acp-9-8661-2009.
- Williams E. , Machado L. , Nathou N. , Hicks E. , Pontikis C. , co-authors . The lofting of aerosol by gust fronts in the West African Sahel, Eos Trans. AGU, 87(52), Fall Meet. 2006. Suppl., Abstract A43B–0133.
- White B. R. Soil transport by winds on Mars. J. Geophys. Res. 1979; 84(B8):4643–4651. DOI: http://dx.doi.org/10.1029/JB084iB09p04643.