Abstract
Background: Thermal pretreatment of biomass ranges from simple (nondestructive) drying to more severe treatments that cause devolatization, depolymerization and carbonization. These pretreatments have demonstrated promise for transforming raw biomass into feedstock material that has improved milling, handling, storage and conversion properties. In this work, southern pine material was pretreated at 120, 180, 230 and 270°C, and then subjected to pyrolysis tests in a continuous-feed bubbling-fluid bed pyrolysis system. Results: High pretreatment temperatures were associated with lower specific grinding energies, higher grinding rates and lower hydrogen and oxygen contents. Higher pretreatment temperatures were also correlated with increased char production, decreased total acid number and slight decrease in the oxygen content of the pyrolysis liquid fraction. Conclusion: Thermal pretreatment has both beneficial and detrimental impacts on fast pyrolysis conversion of pine material to bio-oil, and the effect of thermal pretreatment on upgrading of pyrolysis bio-oil requires further attention.
Approximate conditions for important changes in the various components are marked and include (1) simple drying; (2) glass transition/softening; (3) depolymerization and recondensation; (4) limited devolatilization and carbonization; and (5) extensive devolatilization and carbonization Citation[17].
Adapted with permission from Industrial BiotechnologyCitation[17]. Published by Mary Ann Liebert, Inc., New Rochelle, NY, USA.
![Figure 1. Impacts of thermal pretreatments on the primary components that are found in biomass.Approximate conditions for important changes in the various components are marked and include (1) simple drying; (2) glass transition/softening; (3) depolymerization and recondensation; (4) limited devolatilization and carbonization; and (5) extensive devolatilization and carbonization Citation[17].Adapted with permission from Industrial BiotechnologyCitation[17]. Published by Mary Ann Liebert, Inc., New Rochelle, NY, USA.](/cms/asset/466c288f-729b-464f-82e2-4f9fdc0f797e/tbfu_a_10816030_f0001.gif)
(A) Grinder power consumption and (B) cumulative ground material mass for thermally treated pine chips as functions of time. (C) Specific grinding energy in kWh/metric ton as functions of the material grinding rate. Small solid symbols were calculated over short time periods of approximately 25 s, over which the material grinding rate appeared constant. Large hollow symbols were calculated as the average over longer time intervals as marked in (A). Green circles and red diamonds represent the start and end, respectively, of the long time intervals used to calculate the large hollow symbols in (B).
Untreated biomass has a wide range of moisture content (25–60%), large particle-size distribution depending upon drying and grinding/chipping conditions, low energy density (8–14 MJ/kg), and low bulk density (60–100 kg/m3) coupled with fibrous interlocking particles that tend to resist flow. These biomass characteristics introduce challenges for handling and conversion processes. Ensuring that biomass feedstock materials consistently meet established specifications appears critical for optimizing conversion processes Citation[1]. Thermochemical processes include a wide range of technologies to break down lignocellulosic matter at elevated temperatures under oxygen-limited conditions to control or prevent the oxidation reactions that are characteristic of complete combustion Citation[2]. Gasification carefully controls the amount of oxygen present to produce primarily syngas (which consists mostly of CO, hydrogen, water vapor and CH4) and is generally considered the most complete form of thermochemical conversion in the sense that most of the solid feedstock is converted into gaseous product Citation[2,3]. Pyrolysis, which has conflicting definitions, is the thermal decomposition of materials in the absence of molecular oxygen and can result in a predominantly solid or liquid product, depending upon the process conditions, such as temperature, heating rate and catalysts Citation[2,3].
Fast pyrolysis, in which the heating rate is very high and the residence time of the material in the reactor is typically less than 5 s Citation[4], has been reported to produce liquid bio-oil with a yield as high as 60–80 wt% on a dry feed basis Citation[5,6]. Some reports indicate that fast pyrolysis may be more cost-effective for transforming biomass into hydrocarbon fuels than gasification or biochemical fermentation Citation[7,8]. Bio-oil from fast pyrolysis is a potential fuel substitute for boilers, furnaces and engines, or alternatively as a source for high-value chemicals Citation[9,10]. However, widespread use of bio-oil has been hindered by its complex chemistry, which includes hundreds of oxygenated organic compounds with overall high acid and water contents, and low heating values Citation[6]. High water content not only lowers its heating value but also increases ignition delay, reduces combustion rates and may lead to phase separation of the bio-oil Citation[10,11]. High acid content contributes to corrosion in storage and transport containers, and instability of the bio-oil Citation[11]. Research efforts are currently focused on pathways to upgrade the bio-oil quality through thermal Citation[6,12] and chemical pretreatment of the biomass Citation[13], optimization of the pyrolysis conditions and catalytic upgrading Citation[14,15].
Thermochemical pretreatment of biomass alters and potentially improves many important characteristics, including handling and grinding properties, hydrophobicity, volatiles content and energy density. The diversity of potential feedstock sources with different fuel and handling properties creates substantial challenges in thermochemical conversion processes. In addition, the dilute distribution and seasonal harvesting of many feedstock materials introduces significant transportation and storage costs and complicates the logistics of reliable feedstock availability. These challenges can be addressed by pretreatment processes that transform lignocellulosic feedstocks into more uniform formats that have simpler handling, transportation and storage requirements.
Thermal pretreatment processes are primarily divided into two approaches that employ wet or dry processes, respectively. The wet processes involve treatment using hot, pressurized steam and are known by various names such as hydrothermal pretreatment, wet torrefaction and hydrothermal carbonization (HTC) Citation[16]. The dry approach, which is employed in this study, can be divided into three different regimes: nonreactive drying (50–150°C), reactive drying (150–200°C) and destructive thermochemical preconversion, or torrefaction, which is executed under atmospheric conditions in the relative absence of oxygen in the temperature range of 200–300°C. defines these ranges and describes the intensity of physical and chemical changes that occur within each range Citation[17]. Thermal treatment process variables that can influence the structural and chemical compositional changes include biomass composition, particle size, process temperature and time, and heating rate, as well as the environmental (inert) gas composition, pressure and flow rate.
As illustrates, at nonreactive drying temperatures of 50–150°C (regions marked as ‘1’), biomass dries, resulting in shrinkage and reduced porosity. At this stage, rewetting can typically cause the biomass to regain its structure. At 120–150°C (marked ‘2’), the lignin softens and acts as a binder, which facilitates densification. Hotter temperatures of 150–200°C result in reactive drying (marked as ‘3’ in ) that is associated with the onset of thermal degradation of the biomass hydrogen and carbon, as bonds begin to break and lipophilic extractives and other volatile compounds begin to off-gas. Exposure to this temperature range causes structural deformity that cannot be reversed by rewetting, such as depolymerization of hemicellulose. Further increasing the process temperature to the torrefaction/destructive drying temperatures of 200–320°C (marked as ‘4’) results in carbonization and devolatilization of the biomass. At the hottest temperatures, most inter- and intra-molecular hydrogen, C-C and C-O bonds are disrupted, producing hydrophilic extractives, carboxylic acids, alcohols, aldehydes, ether and fixed gases such as CO, CO2 and CH4. Cell structure is completely destroyed, and biomass loses its fibrous nature and becomes brittle Citation[17]. The blue line in at 250°C suggest that at temperatures below 250°C, mass loss is minimal because decomposition is primarily restricted to partial devolatilization and carbonization of hemicellulose. As temperature increases above 250°C, the hemicellulose rapidly decomposes into volatiles and a solid product, known as char, while lignin and cellulose experience limited devolatilization and carbonization Citation[17]. Of course, the above statements are generalizations, and each biomass type behaves somewhat differently depending upon its specific composition.
Thermal pretreatment of biomass results in beneficial and detrimental effects, as summarized in Supplementary Table 1. Several studies have found that torrefaction increases mass energy density by as much as 40%, which allows for more efficient supply chain logistics Citation[18,19]. Several studies have found that torrefaction increases mass energy density by as much as 40%, which allows for more efficient supply chain logistics Citation[18,19]. As much as 30% of the initial energy content, which is stored in volatile compounds, can be lost during torrefaction. This energy can be recovered by capturing the effluent gases/chemicals and using them for specific purposes, such as heating the reactor or for drying. Torrefaction has been reported to have a process efficiency as high as 92%, which compares favorably with that of pyrolysis, which is approximately 68% Citation[20]. In this work, it is the combined efficiency of thermal treatment and pyrolysis that is of utmost importance.
The embrittlement of biomass tissue associated with thermal treatment reduces energy requirements during grinding Citation[18]. Changes in glass transition and weakening of lignin (representing change in the material stiffness) may also contribute to the ease in grindability. Interestingly, high temperatures are not always required to induce brittle behavior. Drying studies currently underway at Idaho National Laboratory (ID, USA) indicate that drying corn stover in the temperature range 120–180°C achieves approximately a 60% reduction in grinding energy compared with nontreated material. Additionally, damage to the cell structure also manifests itself in reduced particle size, a more uniform particle-size distribution, increased specific surface area and generally improved flowability.
In addition to the grinding (size reduction) advantages discussed above, thermal pretreatment alters other biomass physical properties, most notably moisture content (<3%) and water activity. Reduction of moisture content has several direct benefits including reduced transportation costs due to increased dry mass payloads, increased biomass stability in storage due to reduced biological activity and improved conversion efficiencies in thermochemical conversion due to higher energy densities.
Depending on the distance to the biorefinery, biomass that is thermally treated prior to arriving at the biorefinery may need to be densified to increase volumetric energy density, improve transportability and reduce the risk of combustion in transport. Studies have shown that pellets of torrefied biomass have consistent bulk densities of 750–859 kg/m3Citation[21], which is greater than that of conventional wood pellets (500–650 kg/m3) Citation[20]. Furthermore, torrefied pellets from a wide variety of biomass materials (sawdust, willow, larch, verge grass, demolition wood and straw) have been shown to have similar physical properties, which is not true for conventional biopellets, which can have bulk densities as low as 230 kg/m3Citation[20]. The energy density of bulk pellets of torrefied biomass has been reported as 17.7 GJ/m3, which is approximately 20% higher than commercial wood pellets Citation[21]. The total cost of torrefaction combined with pelletization has been reported to be lower than the sum of each individual process alone Citation[2,20].
Currently, torrefaction is going through the commercial demonstration phase. The market potential of thermally treated material includes large-scale power production, industrial heating and residential/district heating, where cost-effective and secure supplies of biomass are available Citation[22]. There are also challenges that need to be resolved before the benefits of torrefaction can be fully realized in a bioenergy industry, and particularly as a pretreatment for fast pyrolysis. Such challenges are primarily economical. Providing an inert atmosphere and cleaning/reforming the evolved process gases are both costly compared with the value of the final product. Further challenges include energy losses associated with severe (high temperature) torrefaction, the potential explosivity of finely divided torrefied particles, the increased friability of torrefied materials and treating hazardous gas or liquids that are generated during torrefaction.
Depending upon the feedstock and conversion conditions, the challenges described above may be mitigated using wet thermal pretreatment methods, such as HTC. For example, the production rate of HTC is higher than that of torrefaction and, because initial moisture content is not critical, HTC may accommodate a broader range of feedstocks Citation[16]. The solid product of HTC may also be more amenable for use in high-value applications, such as catalysts, surface adsorption and energy storage, as discussed in a recent review Citation[23]. However, because HTC requires pressurized conditions, process equipment may be more costly and complicated than that of dry thermal treatment. The economic advantages of combining HTC with fast pyrolysis have not been thoroughly assessed in the literature, and it is not yet entirely clear whether dry or wet thermal treatment will be advantageous in particular cases because the economics of thermal pretreatment combined with fast pyrolysis depend upon many variables that relate to both the supply chain and the conversion process, including upgrading of the bio-oil to a stable, noncorrosive form. Important items to consider include the impact of thermal pretreatment on grinding, handling, transportation and storage, conversion, and oil upgrading costs. These issues are complex and are being considered in a separate but related project at Idaho National Laboratory. The present work focuses on the impacts of dry thermochemical pretreatments on the yield and quality of bio-oil obtained using fast pyrolysis.
Materials & methods
▪ Sample preparation & characterization
Approximately 6000 lbs (2700 kg) of clean (debarked) 2-inch (50.8-mm) southern pine chips were obtained from Corley Land Service (AL, USA). The wood chips in the as-received condition had a moisture content of approximately 50% wet basis, and were further ground using a Bliss HG480 hammer mill fitted with a 2-inch (50.8-mm) screen. After grinding the chips were dried in a rotary drum dryer at 120–150°C for approximately 15 min to a moisture content of approximately 4% and then stored in super sacks with sealed plastic liners. Because the grinding and drying processes tend to segregate large and small particles in the material, all material from the super sacks were recombined and mixed to obtain a single sample that was as homogeneous as possible. The mixed sample was then split into representative specimens using a combination of fractional shoveling and a custom-built rotary splitter. Separate results (not shown here) demonstrate that the splitting procedure resulted in samples with similar chemical compositions and particle-size distributions. Sub-samples of the initial material were subjected to thermal pretreatments at 180, 230 and 270°C using a range of instruments, including thermogravimetric (sample size of ∼1.5 g), fixed bed (FB; ∼3 kg per batch) and continuous feed (CF; ∼25 kg/h). Tests were conducted on all of the thermally treated materials to determine moisture content, particle-size distribution, bulk density, fuel properties, chemical composition, ash composition and specific grinding energy (SGE). The methods employed to conduct these tests and the results are presented in the following sections.
▪ CF thermal pretreatment experiments
The CF thermal treatment system consists of horizontal auger-driven sections to feed material into and out of a vertical, central reactor, as illustrated in . Homogenized material is weighed and manually loaded into the input hopper. The biomass is metered into the system via a rotary airlock, and subsequently moved horizontally where it then drops into the thermal treatment section. During start-up, this process continues until the entire thermal section is filled. For continuous operation, maintaining a constant level of material inside the reactor is critical to process consistency. In order to provide the necessary sensing capability, a commercial bin level indicator was modified to operate in a potentially harsh chemical environment at temperatures in excess of 300°C. The sensor unit is installed at the top of the reactor and provides feedback to the in-feed mechanism to maintain the top of material level with the lower surface of the in-feed section. The reactor section is a 0.305-m diameter cylinder that is 1.68 m tall. Six individually controlled band heaters located on the outer circumference of the reactor provide treatment heat. The temperature of material in the reactor is monitored at six points near the band heaters.
Stirring mechanisms inside the reactor slowly rotate to mix the material to more uniformly treat all particles. Even with stirring, temperature gradients inside the thermal treatment section can be quite large; however, with proper stirring, it is estimated that the temperature of 95% of the heated material is within 10°C of the target temperature. Once the process temperature is reached in the lower part of the thermal section, the horizontal out-feed auger begins removing material from the bottom of the reactor allowing material to feed down through the reactor by gravity. The residence time of material in the reactor can be controlled between 15 min to 1 h by adjusting the rotational speed of the out-feed section to provide a material velocity between 1 and 10 cm per min. Material cools as it flows through the out-feed section and exits from twin knife-blade air locks at a temperature of approximately 50°C.
Clean nitrogen gas is injected into the sides and bottom of the vertical thermal section of the system and is removed at the top of the thermal section. After exiting the thermal section, the process gas passes through a heated cyclone separator to remove small particulates and is then fed into a heated thermal oxidizer (equipped with separate air injection as required) to burn combustibles and to scavenge heat. After exiting from the thermal oxidizer, the gas stream passes through an enlarged knockout vessel that provides velocity reduction and slight cooling to allow condensable constituents to drop out of the steam for separate collection. The authors have found it difficult to exactly balance the input of air to the thermal oxidizer to burn the combustible constituents without introducing excess oxygen into the system. Also, other components in the process gas, such as moisture and nitrogen, absorb heat and limit the temperature rise in the thermal oxidizer due to burning of combustible materials. A recirculation blower located downstream of the knockout vessel moves the process gas through heaters that bring the temperature up to the desired process point prior to reinjection into the bottom of the reactor. System pressure is maintained slightly above atmospheric pressure by nitrogen addition, exhaust system backpressure and recirculation blower boost.
A continuous gas analysis stream is drawn at the top of the reactor providing measurement of various gases in the recirculation gas stream. CO, CO2, O2 and H2 are measured using a Transportable Gas Analyzer (NOVA Model 7600-6 [NY, USA]); CO and CH4 are analyzed using an infrared analyzer (California Analytical Instruments Model 200 [CA, USA]) and total hydrocarbons (THC) are measured using a heated flame ionization detection analyzer (California Analytical Instruments Model 300). These data, combined with infeed and outfeed information, provide a record of the time, temperature, offgas and mass balance of the material being processed. The mass flow rate of the exhaust stream is measured upon exit from the system. The off-gas is also sampled periodically for subsequent offline analysis.
Experiments demonstrated that uniformity of the thermally treated products could be improved by treating the material in stages. Consequently, the material treated at 230°C was actually treated in two stages, first at 180°C and then at 230°C. Similarly, the material treated at 270°C was actually treated in three stages, consisting of separate consecutive pretreatments at 180, 230 and 270°C. Starting and stopping an inherently continuous process and also handling large numbers of small samples resulted in a significant uncertainty in the solid mass yield of the CF system. The uncertainty associated with each pretreatment operation was estimated at 2%, and this uncertainty propagated forward as the material was treated in consecutive steps, so that the total mass yield uncertainty for producing material at 180, 230 and 270°C are estimated as ±2, 3 and 4%, respectively.
▪ FB thermal pretreatment experiments
The FB thermal treatment system consists of nitrogen gas supply, a reactor vessel and a gas condenser system. The reactor vessel consists of enclosed concentric aluminum cylinders. The outer cylinder has a wall thickness of 0.64 cm and a diameter of 25.4 cm, and is 71 cm tall. The inner cylinder has a wall thickness of 3 mm and a diameter of 12.7 cm. Six band heaters provided heat to the outer cylinder and a single core heater heats the nitrogen gas inside the small cylinder. Biomass was placed between the concentric cylinders and was purged by a continuous flow of preheated nitrogen gas at approximately 10 l/min to remove oxygen and avoid oxidation and ignition. The exhaust gas from the reactor vessel was passed through a copper coil immersed in an ice bath before being trapped in a separate cylindrical condenser. The off-gas stream was analyzed for CO2, O2, CH4, H2, THC and other gases similar to the effluent from the CF thermal treatment system.
A measured quantity of sample (3–4 kg) was charged into the reactor at room temperature and the reactor was heated at approximately 10°C/min under atmospheric pressure. Clean pine chips were thermally treated at different temperatures (180, 230 and 270°C) at 30 min residence time. To improve the temperature uniformity throughout the sample, the thermal pretreatment was performed in multiple steps that involved incrementally increasing the wall temperature and holding that wall temperature for a set time before the wall temperature was increased further. After the treatment, samples were cooled and weighed to determine the solid yields. The condensable compounds were collected to calculate the mass yield of all products.
▪ Thermogravimetric analyses
The samples were first ground using a Retsch 100 grinder equipped with a 0.2-mm screen, and then thermogravimetric analysis (TGA) was performed in a batch procedure (TGA701, LECO Corporation, St. Joseph, MI, USA). Experiments were conducted in a temperature range of 180, 230 and 270°C and at residence times of 30 min. The heating rate was 10°C/min and the temperature was held at each target temperature (180, 230 and 270°C) for 30 min.
▪ Grinding experiments
SGE experiments were performed using a laboratory knife mill (Thomas Wiley® Laboratory Mill, Model 4, 1 hp; Thomas Scientific, NJ, USA) equipped with a screen with 2 mm circular openings. The mill was modified to accept a pulley-mounted combination torque sensor (200 lbf-in model MCRT 3120TA and model 721 mechanical signal transducer; S. Himmelstein and Co. Hoffman Estates, IL, USA). Approximately 1 kg of sample from each temperature was hand-fed to the mill. Ground material exiting the mill was collected on a digital scale (Mettler-Toledo XS6002S [Greifensee, Switzerland]) interfaced to a personal computer. The data on motor torque, mill rotational speed and mass output were simultaneously recorded on a computer every 1 s. The specific energy consumed in grinding was reported in kWh/dry ton and calculated in the . Replications were performed as explained in the experimental section. SGE for each sample was calculated as:
Equation 1
▪ Fast pyrolysis conversion experiments
A series of tests were performed to evaluate the thermally pretreated biomass for the production of bio-oil via continuous bench-scale fast pyrolysis. The samples were ground using a Retsch impingement mill (Haan, Germany) at 1000–1500 rpm with a screen size of 2 mm to reduce the particles to a suitable size for the bench-scale pyrolysis unit. It was observed that during grinding of the feed, both medium and highest temperature torrefied feeds displayed more brittleness, and thus ground faster by the mill. For example, the size distribution of the ground low torrefied feed was 38% above mesh 20, 51% between 20 and 40 mesh, 7% between 40 and 60 mesh, and 3% below 60 mesh. All fractions were retained for testing in the pyrolysis reactor, and no size segregation was performed on the feed.
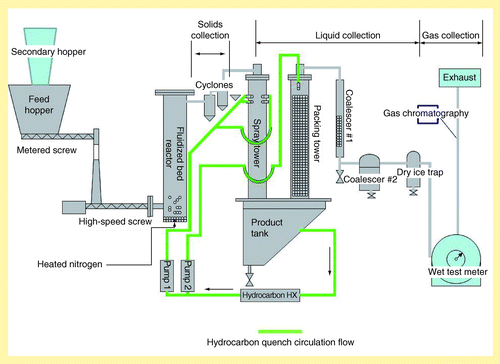
The pyrolysis experiments were conducted using a continuous fluid bed pyrolysis system at the Chemical Engineering Laboratory at the Pacific Northwest National Laboratory (PNNL), that operates at a nominal rate of 1 kg/h . Pyrolysis tests were performed on each feed type using similar conditions. The biomass fed to the pyrolyzer is metered using a Schenck AccuRate (WI, USA) with a modified sealed hopper and a metering auger. The metering auger delivered biomass to a water-jacketed, high-speed auger that quickly feeds into the bottom of the bubbling fluidized bed. The fluidized bed reactor is an externally heated, 5 cm diameter and 86 cm tall shell containing approximately 300 g of 40–70 mesh round, borosilicate glass beads as a fluidization media. Vapor residence time in the reactor is 1.6 s. As the vapor exits the reactor, char is separated in cyclones (C1, C2). The vapor is then quenched in an open spray tower. Eight cone nozzles positioned at the top of the spray tower spray chilled hydrocarbon (Isopar V) perpendicular to the gas flow. The cooled vapor then passes through a separation (product) tank and up through a tower packed with polypropylene pall rings. Chilled hydrocarbon (Isopar V) is also sprayed in a counter-current pattern in the packing tower to scavenge aerosols. In the product tank, bio-oil and hydrocarbon phase separate such that the hydrocarbon can be continuously drawn off the top before it is filtered, chilled and pumped back into the towers. The hydrocarbon circulation loop is shown as bold green lines in . Additional aerosols are scavenged through a series of modified coalescing units, and residual moisture is scavenged in a 1L flask filled with packing and surrounded by dry ice. The exhaust gas volume is measured by a 25-l Ritter wet test meter prior to exiting to exhaust.
Temperature, pressure and the exhaust volume are read at 30 min intervals. Char is collected at 30-min intervals. Bio-oil is collected at the 5T coalescer at 60 min intervals. The bio-oil is collected from all traps at the end of the experiment and combined with all samples into a single phase, with the exception of the moisture scavenger that is primarily water. Exhaust gas samples are taken at approximately 30 min intervals and analyzed by gas chromatography/flame ionization detector and thermal conductivity detector.
▪ Characterization of solid products
Moisture content
American Society of Agricultural and Biological Engineers S358.2 was followed to measure moisture content of the thermally treated materials. A sample of 50–100 g was placed in a horizontal convective oven at an approximate temperature of 105°C for a period of 24–30 h. The mass loss of the samples was assumed to be primarily moisture and was reported as wet basis. Each test was repeated three times.
Bulk density
American Society for Testing and Materials (ASTM) E873-82 for densified particulate biomass was followed to measure the bulk density of thermally treated materials. The samples were poured into a 195-mm diameter polycarbonate cylinder to fill the cylinder approximately 70% full. The pour height was 0.6 m above the top edge of the cylinder, and the average loose material height was estimated as the mean material height at four equally spaced places around the perimeter of the container. For some cases, in which four measurements did not appear adequate to obtain an acceptable average, the height of the material at the center of the cylinder was also measured using a load frame with a calibrated plunger. The tapped material height was measured in a similar manner after the filled cylinder had been dropped five-times from a height of 0.15 m onto a hard surface to promote settling. The loose and tapped densities were calculated by dividing the mass of the sample by the measured sample volume.
Particle-size distributions before grinding
A standard sieve analysis following American Society of Agricultural Engineers S319.3 was employed to assess the particle-size distributions of the thermally treated materials. The cumulative particle passing distributions (CPDs) and the associated probability density distributions (PDDs), which represent the derivative of the CPDs, were calculated. For all of the analyses, the 50% cumulative passing percentile sieve size (t50) was calculated by interpolation to find the theoretical sieve size that corresponds to retaining 50% of the particles by mass. This sieve size corresponds to the 50% height on the CPD. Similarly, the 16 and 84% cumulative passing percentile sieve sizes (t16 and t84, respectively) were also calculated and reported.
Particle-size distributions after grinding
Portions of the thermally treated materials were further ground in a Thomas Wiley bench-scale knife mill equipped with a 2-mm screen to obtain materials with particle-size distributions that are convenient for gasification and pyrolysis experiments conducted at National Renewable Energy Laboratory and PNNL. After the additional grinding step, a Horiba CAMSIZER® (Kyoto, Japan) digital image processing system was employed to characterize the particle-size distributions of the materials. A vibratory feeder automatically controlled the feed rate to drop approximately 60 g of sample in the focal plane of the cameras, and an ultrasonic probe positioned near the end of the feeder minimized the effects of electric charge build-up on the material particles. The CPDs and the associated PDDs were calculated using software in a similar manner to the standard sieve analysis described in the section entitled ‘Particle-size distributions before grinding’. Software in the CAMSIZER approximates each analyzed particle as an ellipsoid silhouette. Aspect ratio for each particle is defined as the ratio of the width to the length of the ellipsoid silhouette and indicates the elongation of particles relative to their widths. The reciprocal (1/sphericity [dimensionless]) is also reported and is a measure of the mean particle surface roughness.
Fuel properties
ASTM D5142-04 for coal and coke was employed for proximate analysis (ash, volatiles, fixed carbon [FC] and moisture content) using a micro thermo-gravimetric analyzer (Model TGA701). The material was first ground in a Retch 100 grinder using a 0.2-mm screen, and then approximately 1.5 g of sample was heated in a muffle furnace using an aluminum crucible. Ash content, volatile matter (VM) and FC were reported in dry basis with FC being calculated from the balance of ash and VM. ASTM D 3176-89 for coal and coke was followed for elemental analysis for C, H, N and S contents (ultimate analysis) of the samples using an elemental analyzer (LECO C, H, N and S 932, LECO Corporation). Oxygen was estimated by difference amd all thermal and chemical measurements were conducted in at least triplicate. Oxygen of char was attempted by ASTM D5373 but in most cases reported by difference. Sulfur was determined by ASTM D4239 and water content was determined by oven drying at approximately 105°C for 24 h.
Chemical composition
Chemical composition of biomass samples was determined using sequential detergent methods Citation[24]. The insoluble residues were neutral detergent fiber, hemicellulose, cellulose and lignin. Cellulose and lignin were separated from hemicellulose as after digestion, the hemicelluloses dissolved were filtered out. The acid detergent lignin (ADL) was measured by further treating the acid detergent fiber ([ADF], the insoluble fiber residues remaining after digesting, which consisted mainly of cellulose and lignin) with 72% H2SO4, which dissolved cellulose. The cellulose content was derived by subtracting ADF values from ADL values. Calculations of cellulose and hemicellulose percentages are given by:
Equation 2
Equation 3
▪ Characterization of liquid products
C, H and N analysis of the liquid pyrolysis products were performed using ASTM D5291. Oxygen of bio-oil and liquid of thermal pretreatment was attempted by ASTM D5373 but in most cases reported by difference. Sulfur was determined by D1552 and water content was determined by Karl Fischer method using ASTM E1064. Total acid number (TAN) was determined by ASTM D3339 in mgKOH/g.
▪ Characterization of gaseous products
Off-gas data was collected using multiple analyzers for reading O2, CO, CO2, H2, THC and CH4 constituents in a gas stream. The analyzers are integrated into the CF and FB thermal treatment systems and are shown as a gas analysis system in . Multiple sample locations are available for capturing off-gas from the CF thermal treatment system. Primary sample locations include before the thermal oxidizer and at the exit of the recirculation blower. Sample locations vary depending on the ability to pull adequate off-gas sample for analyzers. The FB system is fitted to draw off-gas sample from the exhaust stream.
Results & discussion
▪ Mass & energy yields of thermal pretreatments
Energy yield data represents the ratio of actual energy retained after the thermal pretreatment process to initial energy content (measured as a lower heating value [LHV]) of the feedstock biomass. Mass and energy yield are calculated as:
Equation 4
Equation 5
Equation 6
Mass and energy yields of pine chips at various process temperatures are shown in . Energy yield data represents the ratio of actual energy retained after the torrefaction process to initial energy content of biomass. As noted in , the mass yield of torrefied pine chips decreased with increase in temperature. The mass loss was likely primary due to thermal decomposition of hemicellulose and some short-chain lignin compounds. The mass yield of material obtained from the FB system was found comparable with the results obtained by other research using similar materials and FB reactors Citation[18]. Similar studies for wood fuels Citation[25] and wood briquettes Citation[26] have reported comparative mass and energy yields. Note that thermal pretreatment using the CF system was performed in stages, so that the total mass yield for each final treatment temperature is the product of the individual mass yields from each previous stage (marked in parenthesis in ). For example, the mass yield for thermal treatment at 230°C (92%) is the product of the mass yield at 180°C (99%) and that of treatment from 180 to 230°C (93%).
All three processes appeared to result in similar mass yields for treatments at 180 and 230°C; however, the mass yields are substantially different for the treatment at 270°C. The very low mass yield of the product treated in the thermogravimetric (49%) is much lower than expected. Repeated measurements using the same and a different instrument (Q500, TA Instruments [DE, USA]) yielded similar results, which depended somewhat upon the quantity of material used in the TGA instrument. Finely ground material, such as that treated in the TGA, does tend to experience higher mass losses, but it is doubtful that particle size can fully explain the unexpectedly high mass loss in the TGA at 270°C. The authors note that material treated in the CF system was lighter in color than that of the FB system, which indicates that the CF system may have resulted in milder treatment compared with that of the FB system, although the solid mass yields appear to suggest otherwise. Supplementary Figure 1 shows the physical (color) changes that occurred during heat treatment of wood chips at various temperatures.
▪ Mass & energy yields of fast pyrolysis conversion experiments
Solid and liquid mass yields were calculated for each of the tests by analyzing the mass of liquid and char collected per the total mass fed. Gas yield was calculated by measuring the volume of off-gas during reactor feeding and an average composition of the off-gas as measured by gas chromatography/flame ionization detector and thermal conductivity detector over the sample intervals. Summarized results are shown in . After treatment at Idaho National Laboratory, the feeds had moisture content of less than 2%; however, during shipping some feeds absorbed some moisture during transport and handling to PNNL.
The severity of thermal pretreatment (increasing temperature) appears to reduce the overall liquid mass yield from the pyrolysis process. The outlier is the 120°C CF feed that demonstrates a lower than expected liquid yield and a low mass balance, which was presumed due to issues with the aerosol capture system resulting in a loss of condensable liquids. The feed was consumed in this test and was unable to be repeated. The reduction in liquid yield of pretreated versus pine flour can be partially explained by the lower moisture content of the incoming biomass, which would naturally express itself in the form of lower water content of the oil.
▪ Characterization of solid products
Moisture content & bulk density
Measured bulk densities of the thermally treated materials are presented in Supplementary Table 2, which also includes the moisture contents of the samples at the time that the bulk densities were measured. Carr’s compressibility index, which is defined as the percent change in bulk volume upon tapping, is also calculated in Supplementary Table 2. The Carr’s indices indicate that the material settled very little and in some cases expanded slightly during the tapping process. Notably, the bulk density increased as the pretreatment temperature increased from 105 to 180°C and to 230°C, but decreased for the material treated at 270°C.
Particle-size distributions before grinding
Supplementary Figure 2 displays the CPDs for the four classes of pine chips thermally treated in the FB reactor. Typically, torrefaction is reported to cause particles to shrink; however, Supplementary Figure 2 clearly demonstrates that thermal pretreatment had very little effect on the particle-size distributions. Size distribution analyses of the material treated in the CF system are not shown in Supplementary Figure 2 but are similar. The associated PDDs, which represent the derivative of the CPDs, are also shown with dashed lines to connect the data points. The cumulative passing percentiles t16, t50 and t84 were similar for the four material classes and were approximately 1.55, 3.95 and 6.8, respectively.
Particle-size distributions after grinding
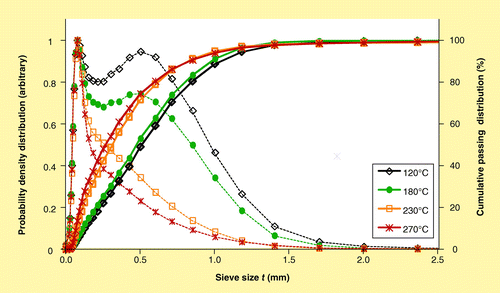
The CPDs and associated PDDs for the four thermally treated pine samples ground with a 2-mm screen in the bench-scale Thomas Wiley mill are shown in and reveal that the grinding operation results in significantly smaller particles for material processed at higher temperatures, particularly as the pretreatment temperature increases from 180 to 230°C. The cumulative passing percentile sieve sizes are summarized in Supplementary Table 3 along with summaries of the mean aspect ratio and sphericity of all particles. CAMSIZER results indicate that elongation and surface roughness (1/sphericity [dimensionless]) of the thermally treated and ground pine samples is fairly comparable.
Grinding energy of pretreated materials
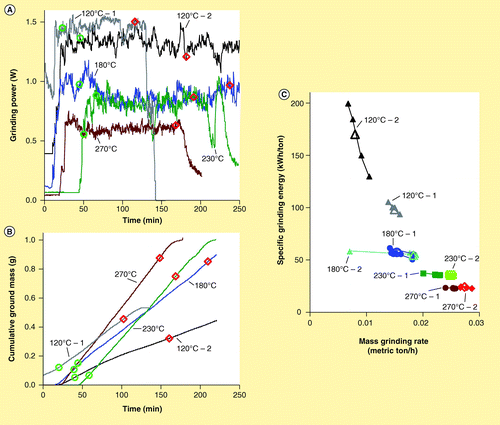
Preliminary experiments indicated that SGE for the pine chips dried at 120°C was very sensitive to the rate that material was manually fed into the grinder because SGE is the quotient of grinding power (a large number) and material feed rate (a small number). During an experiment, material is fed into the grinder manually to maintain the grinding power as constant and large as possible without plugging the grinding chamber. This can be challenging for hard-to-grind materials, which easily plug the grinding chamber and choke the motor. Consequently, several experiments were conducted in which the material feed rate was intentionally and unintentionally varied. shows the grinder power consumption and cumulative ground material mass, respectively, as functions of time for four experiments involving thermally treated pine chips. Note that the second experiment involving material treated at 120°C (labeled ‘120°C – 2’) exhibits regions of distinctly different grinding mass rates in , although the corresponding power consumption in only slowly decreases (i.e., the relationship between SGE and grinding mass rate is nonlinear).
The mean specific grinding energies calculated for the intervals contained within the green circles and red diamonds in are shown as large hollow symbols in . The specific grinding energies for smaller time intervals of approximately 25 s, over which the power consumption and material grinding rate are reasonably constant, are shown as small solid symbols in . Note how the SGE decreases rapidly with increasing material grinding rate even though the power consumption is nearly constant. The grinding energy was repeated two-times for all of the thermally treated pine chips. Whole oats were also ground under the same conditions before and after the experiments to verify that wear of the grinder blades did not significantly affect the grinding power consumption. Some of the power consumption and material grinding rates of the thermally treated materials are shown in , respectively, and all of the calculated specific grinding energies are shown in .
Interestingly, the dependence of SGE on material grinding rate is much weaker for the material treated at higher temperatures, indicating that power consumption has a nearly linear relationship to material grinding rate for these materials. Another trend is clear in : higher thermal pretreatment temperatures result in materials that have much higher grinding rates. In fact, the pretreatment at 270°C appears to nearly double the material grinding rate while reducing the SGE by a factor of approximately four. These results are similar to other values reported in the literature which indicate that grinding efficiency can increase four-times as thermal treatment temperature increases Citation[18] and that the increase in grinding capacity is similar in magnitude to the increase in grinding efficiency Citation[27].
Fuel properties
Data from proximate, ultimate and heating value analyses of thermally treated pine chips are given in . Moisture content of all process temperature samples decreased to less than 1%. The VM in the sample was comparable between temperatures 180 and 120°C, while noticeable reduction was observed at torrefaction temperatures of 230 and 270°C. The reduction in VM results in the relative increase of FC. Similarly, the increase in ash content of torrefied material was mainly due to the loss of volatiles and concentration effect during pretreatment.
indicates that as the process temperature increased, the elemental carbon content of biomass was increased, and at the same time hydrogen and oxygen contents decreased, resulting in decreased H/C and O/C ratios. As expected, the reduction of oxygen in the thermally treated material correlates to increased energy density (i.e., higher heating value). Compared with HTC at similar temperatures, the molecular carbon contents in do not exhibit as much increase with process temperature Citation[28]. Similarly, the oxygen content of the pine chips thermally treated under dry conditions here does not decrease as much with increasing process temperature as was reported for HTC Citation[27]. The liquid products from the thermal pretreatments were also analyzed and the results are presented in Supplementary Table 4. For all treatments, the liquid yield consisted of 90% or more water. The carbon (organic) content and TAN increased with increasing treatment temperature.
Chemical composition
The change in chemical composition of thermally treated pine chips is shown in Supplementary Table 5. Hemicellulose and cellulose decreased, while lignin increased with increasing process temperatures above 230°C. As it is well established that cellulose decomposition is minimal below 300°C, the reduction in cellulose content with increasing temperature is believed to be due mainly to reduction in acid soluble cellulose Citation[29]. Hemicellulose and cellulose decreased, while lignin increased with increasing process temperatures above 230°C. As it is well established that cellulose decomposition is minimal below 300°C, the reduction in cellulose content with increasing temperature is believed to be due mainly to reduction in acid soluble cellulose Citation[29]. The acid insoluble cellulose was counted as part of the lignin fibers present in thermally treated biomass. As a result, the acid insoluble fiber content of thermally pretreated feedstock increased with increasing pretreatment temperature. This suggests that heat-treated biomass may not be suitable for extracting simple sugars for further conversion into ethanol. The relative increase of lignin content also contributed to the higher heating values of thermally pretreated product.
▪ Characterization of gaseous products
CF system
The thermal treatment of the material at 180°C began using a nitrogen purge gas flowing at approximately 1.5 kg/h. Approximately halfway through the experiment, the purge gas was changed to air at the same flow rate, for either atmosphere, CO, THC and CH4, were below the measurable limit of approximately 0.015 kg/h. The flow rate of CO2 at the exhaust, however, increased from 0.03 kg/h (2% of exhaust gases) to 0.086 kg/h (6% of exhaust gases), and the flow of oxygen increased from 0.036 kg/h (2.5%) to 0.2 kg/h (13%), which is closer to the oxygen content of ambient air. These numbers indicate that low levels of oxygen and CO2 were present in the exhaust gas even while the reactor was purged with nitrogen, likely due to oxygen and CO2brought into the reactor with material at the inlet. The increase of CO2 concentration when the purge gas was changed to air is attributed to burning of fines or combustible gases in the off-gas that is enhanced in the presence of oxygen. The feed rate of material into the thermal treatment system was approximately 45 kg/h, so that the production of CO2 in the air atmosphere was approximately 0.086/45 = 0.001 kg CO2 per kg of treated woody material.
The material thermally treated at 180°C was split using a custom-built rotary splitter, and a portion of the material was thermally treated again at 230°C. Processing the material at 180°C before it is treated at 230°C makes it possible to use less nitrogen purge gas at the higher temperature to remove moisture and volatiles, which facilitates gas analysis. The flow rate of nitrogen into the reactor during 230°C treatment was approximately 12 kg/h. Initially, the thermal oxidizer was left inactive by depriving it of oxygen. A steady supply of 25 kg/h of nitrogen and off-gas was pulled from the reactor, through the thermal oxidizer and inserted back into the reactor. Approximately halfway through the experiment, the thermal oxidizer was fired by feeding it a small amount of air. Supplementary Figure 3 displays the average reactor temperature and analyses of the fixed gases at the reactor exhaust for a time period encompassing approximately 65 min before and after the thermal oxidizer was fired. Note that the average reactor temperature was fairly constant, and only oxygen and CO2 have sufficient concentrations to be measured, similar to the treatment at 180°C. Firing the thermal oxidizer caused the amount of oxygen in the exhaust gas to increase from approximately 0 to 0.22 kg/h while CO2 increased from approximately 0.05 to 0.14 kg/h. The large concentration of oxygen in the effluent gas indicates that more air than was necessary was fed into the thermal oxidizer. The feed rate of material into the thermal treatment system was approximately 61 kg/h, so that the production of CO2 with the thermal oxidizer operating was approximately 0.22/61 = 0.004 kg CO2 per kg of treated woody material.
The material thermally treated at 230°C was further split using a custom-built rotary splitter, and a portion of the material was thermally treated again at 270°C. Supplementary Figure 4 displays the average reactor temperature and analyses of the fixed gases at the reactor exhaust for the thermal treatment in the CF system operating at 270°C with the thermal oxidizer operating. An increase in concentration of fixed gases is expected as torrefaction temperature increases, and this is the trend that is observed in Supplementary Figure 4, although the instantaneous gas production appears to vary widely. The feed rate of material into the thermal treatment system was slower than that of the milder treatments and was only approximately 26 kg/h. At approximately 70 min in Supplementary Figure 4, the gas analysis system was stopped to clean a filter, and for this reason 10 min of gas data are missing. The mean flow of CO2 in the exhaust gas after the filter was cleaned was 0.67 kg/h, yielding approximately 0.67/26 = 0.026 kg CO2 per kg of treated woody material.
FB & thermogravimetric systems
Gas analysis was also performed for the thermal treatments involving the FB system. Similar to experiments with the CF system, the evolution of fixed gases at the 180°C treatment temperature was very low and is not reported. It was observed for treatments at 230 and 270°C that the peak gas production occurred shortly before the reactor attained the target temperature, likely because the heating rate of the reactor slowed as it approached the target temperature. Supplementary Figures 5 & 6 display the average reactor temperature and analyses of the fixed gases at the reactor exhaust for the 230 and 270°C thermal treatments. Similar to the treatments with the CF systems, CO2 dominated the off-gas constituents and all fixed gases increased dramatically for the thermal treatment at 270°C compared with that at 230°C.
▪ Chemical & fuel characterizations of pyrolysis solid, liquid & gaseous products
The chemical and fuel characterization results of the pyrolysis bio-oil and liquid captured in the aqueous trap are summarized in . The water content of the bio-oil produced from thermally treated material is reduced compared with that from pine flour because the incoming feed material has a lower moisture content. The result is a slightly lower concentration of water in the final bio-oil product and a smaller percentage of mass collected in the aqueous traps. However, there does not appear to be an impact on the final bio-oil water content or the mass yield of the aqueous fraction correlating with the severity of the thermal pretreatment. It does appear, however, that there is a correlation between the severity of thermal pretreatment and the TAN of the liquid fractions, as well as a very slight decrease in the oxygen content with a corresponding slight increase in the carbon content of the product oil. This corresponds to the higher mass yield to char during the pyrolysis process trending with pretreatment severity. Comparing this to other components of this study, this suggests that these effects observed in the pyrolysis are also due to the reaction of the hemicellulose species in the thermal pretreatment step.
For pyrolytic gas analysis, as nitrogen is used for sweep gas, more than 95% of the gas analyzes as nitrogen. The remaining gas is biomass derived, thus the analysis has been reported on a nitrogen-free basis to capture the variations in noncondensable gas. Analysis of the pyrolysis gas was performed and is summarized in Supplementary Table 6, although the results are highly variable due to significant dilution by the sweep nitrogen. Besides increased CH4 production for the 270°C – CF feed, the ratios of lighter hydrocarbons formed during pyrolysis do not trend significantly with increased torrefaction temperature of the feed. Also, in pyrolyzing the 270°C – CF feed, the ratio of CO/CO2 ratio in the noncondensable pyrolysis gas in increased over the lower temperature torrefied feeds.
When evaluating this range of thermal treatment as a pretreatment for the pyrolysis process, on the bench scale it appears that there are positive and negative effects. While the overall yield to liquid is lower, the quality of the liquid has been slightly improved when looking at the acid number and the oxygen content. However, as pyrolysis oil is an intermediate step in the conversion chain to liquid transportation fuels, there are other factors that must be considered to determine if the severity of thermal pretreatment can provide additional positive impacts on the oil quality. Without examining the bio-oil for compatibility with catalytic hydrodeoxygenation and hydrocracking, it is difficult to fully assess the quality of these oils. However, the slight deoxygenation and reduction in acid content suggests that the reactive, oxygenated compounds in bio-oil that make catalytic upgrading difficult are, in part, being reduced due to thermal pretreatment of the biomass prior to pyrolysis. Additional evaluation of these oils is recommended to explore the impact on the conversion of bio-oil to liquid transportation fuels.
Future perspective
Thermochemical preconversion is expected to have an important role in transforming raw biomass into quality feedstock that meets consistent specifications. The properties that are enhanced by thermochemical preconversion are summarized in Supplementary Table 1 and include handling and grinding properties, hydrophobicity, volatiles content and energy density. There are technical challenges that need to be addressed for thermal preconversion to be broadly implemented in feedstock supply chains Citation[22] and include handling and grinding properties, hydrophobicity, volatiles content and energy density. There are technical challenges that need to be addressed for thermal preconversion to be broadly implemented in feedstock supply chains Citation[22]:
▪ Resource types: initial stage of the technology is limited to woody biomass, as agricultural biomass tends to nest and plug in processing equipment. Herbaceous materials are also more inclined to ignite or carbonize during the treatment. Operational experience with initial commercial demonstration plants will be crucial to find the optimum technical and economical treatment conditions for various types of biomass; | |||||
▪ Emissions: liberated gases, including water, acid-based compounds and tars can be problematic to environment, and the system itself. Appropriate technology is needed for separation, utilization and elimination of the waste compounds; | |||||
▪ Up-scaling: while throughput and feed issues observed in smaller scale tests may be minimized by scaling up, other factors, such as uniformity of product treatment, can be challenging and may require process and design modifications in order to meet expectations; | |||||
▪ Process validation: temperature, residence time and feed particle size are co-dependent parameters that are crucial to thermal treatment performance. Optimum operating conditions can vary for different biomass types and need to be empirically determined. | |||||
Table 1. Effect of treatment temperature on mass (solid, liquid and gas) and energy percent yields of pine chips treated in the continuous-feed, fixed bed and thermogravimetric analysis systems (dry basis)†.
Table 2. Feed materials, operating parameters and yields of pyrolysis experiments†.
Table 3. Proximate properties and heat content of pine chips thermally treated in the fixed bed, continuous-feed and thermogravimetric analysis systems.
Table 4. Elemental properties of thermally treated pine†.
Table 5. Yields and elemental analysis of bio-oil fractions and aqueous trap.
Thermal decomposition of organic matter with controlled amounts of oxygen to produce primarily syngas (which is composed primarily of CO, hydrogen, water vapor and CH4).
Thermal decomposition of organic matter in the absence of molecular oxygen.
Form of pyrolysis in which the material heating rate is very high and the residence time in the reactor is typically less than 5 s. Fast pyrolysis yields a higher percentage of liquid product that conventional or slow pyrolysis.
Thermal treatment in the temperature range of 200–300°C in an atmosphere with reduced levels of oxygen.
The actual grinding work energy that goes into grinding, including drive chain inefficiencies, electrical power factor losses and friction.
Challenges associated with thermochemical conversion of lignocellulosic biomass
▪ The diversity of potential feedstock sources with different fuel and handling properties creates substantial challenges in thermochemical conversion processes, including gasification and pyrolysis. | |||||
▪ Thermochemical pretreatment of biomass alters and potentially improves many important characteristics, including handling and grinding properties, hydrophobicity, volatiles content and energy density. | |||||
Impact of dry thermal pretreatment on the properties of southern pine chips
▪ Southern pine chips were thermally pretreated in different equipment systems, including fixed bed (FB; ∼7 kg per batch), continuous-feed (CF; ∼25 kg per h) and thermogravimetric analysis (∼1 g) systems. Material thermally pretreated using CF system was subjected to fast pyrolysis tests in a CF bubbling bed pyrolysis system. | |||||
▪ Higher thermal pretreatment temperature resulted in material with substantially lower specific grinding energies and higher grinding rates; in fact, the pretreatment at 270°C appears to nearly double the material grinding rate while reducing the specific grinding energy by a factor of approximately four. | |||||
▪ CF or FB thermal treatment did not significantly affect the particle-size distribution, although grinding of thermally treated materials resulted in finer particle sizes compared with ground material that had not been thermally treated. | |||||
▪ Liquid from thermal pretreatment process consisted of 90% or more water in all cases. | |||||
▪ Gas analysis of the off-gases from thermal treatments in both the CF and FB system was dominated by CO2, and all fixed gases increased dramatically for the thermal treatment at 270°C compared with the treatment at 230°C. | |||||
▪ Thermal treatment did not appear to significantly impact the final bio-oil water content after fast pyrolysis or the mass yield of the aqueous fraction. It does appear, however, that there is a correlation between the severity of thermal pretreatment and the total acid number of the liquid fractions, as well as a very slight decrease in the oxygen content with a corresponding slight increase in the carbon content of the product oil. This corresponds to the higher mass yield to char during the pyrolysis process trending with pretreatment severity. | |||||
tbfu_a_10816030_sm0001.doc
Download MS Word (1,017.5 KB)Acknowledgements
The authors are indebted to CT Wright and RD Boardman for discussions in planning these experiments, and to B Hancock for performing the bulk density measurements.
Disclaimer
This information was prepared as an account of work sponsored by an agency of the US Government. Neither the US Government nor any agency thereof, nor any of their employees, makes any warranty, express or implied, or assumes any legal liability or responsibility for the accuracy, completeness, or usefulness of any information, apparatus, product, or process disclosed, or represents that its use would not infringe privately owned rights. References herein to any specific commercial product, process, or service by trade name, trademark, manufacturer, or otherwise, does not necessarily constitute or imply its endorsement, recommendation, or favoring by the US Government or any agency thereof. The views and opinions of authors expressed herein do not necessarily state or reflect those of the US Government or any agency thereof.
Financial & competing interests disclosure
This work is supported by the US Department of Energy under Department of Energy Idaho Operations Office Contract No. DE-AC07-05ID14517. The US Government retains and the publisher, by accepting the article for publication, acknowledges that the US Government retains a nonexclusive, paid-up, irrevocable, worldwide license to publish or reproduce the published form of this manuscript, or allow others to do so, for US Government purposes. The authors have no other relevant affiliations or financial involvement with any organization or entity with a financial interest in or financial conflict with the subject matter or materials discussed in the manuscript apart from those disclosed. No writing assistance was utilized in the production of this manuscript.
Related Research Data
References
- Sokhansanj S, Mani S, Turhollow A et al. Large-scale production, harvest and transport of switchgrass (Panicum virgatum L.) – current technology and visioning a mature technology. Biofuels Bioprod. Bioref.3,124–141 (2009).
- Ciolkosz D, Wallace R. A review of torrefaction for bioenergy feedstock production. Biofuels Bioprod. Bioref.5(3),317–329 (2011).
- Mohan D, Pittman CU Jr., Steele PH. Pyrolysis of wood/biomass for bio-oil: a critical review. Energy Fuels20(3),848–889 (2006).
- Demirbas A. Pyrolysis mechanisms of biomass materials. Energ. Source. Part A31(13),1186–1193 (2009).
- Bridgwater AV, Peacocke GVC. A review of fast pyrolysis of biomass and product upgrading. Biomass Bioenergy38,64–94 (2012).
- Zheng A, Zhao Z, Chang S et al. Effect of torrefaction temperature on product distribution from two-staged pyrolysis of biomass. Energy Fuels26(5),2698–2974 (2012).
- Vispute TP, Zhang H, Sanna A et al. Renewable chemical commodity feedstocks from integrated catalytic processing of pyrolysis oils. Science330(6008),1222–1227 (2010).
- Zhang H, Xiao R, Huang H, Xiao G. Comparison of non-catalytic and catalytic fast pyrolysis of corncob in a fluidized bed reactor. Bioresour. Technol.100(3),1428–1434 (2009).
- Lappas AA, Dimitropoulos V, Antonakou EV et al. Design, construction, and operation of a transported fluid bed process development unit for biomass fast pyrolysis: effect of pyrolysis temperature. Ind. Eng. Chem. Res.47(3),742–747 (2008).
- Czernik S, Bridgwater AV. Overview of applications of biomass fast pyrolysis oil. Energy Fuels18(2),590–598 (2004).
- Zhang Q, Chang J, Wang T. Review of biomass pyrolysis oil properties and upgrading research. Energy Convers. Manage.48(1),87–92 (2007).
- Kasparbauer RD. The Effects of Biomass Pretreatments on the Products of Fast Pyrolysis. PhD Dissertation. Iowa State University, IA, USA (2009).
- Hassan E-B, Steele P, Ingram L. Characterization of fast pyrolysis bio-oils produced from pretreated pine wood. Appl. Biochem. Biotechnol.154(1),3–13 (2009).
- Kang B-S, Lee KH, Park HJ et al. Fast pyrolysis of radiata pine in a bench scale plant with a fluidized bed: influence of a char separation system and reaction conditions on the production of bio-oil. J. Anal. Appl. Pyrolysis76(1–2),32–37 (2006).
- Carlson TR, Cheng Y-T, Jae J et al. Production of green aromatics and olefins by catalytic fast pyrolysis of wood sawdust. Energy Environ. Sci.4(1),145–161 (2011).
- Hoekman S, Broch A, Robbins C. Hydrothermal carbonization (HTC) of lignocellulosic biomass. Energy Fuels25(4),1802–1810 (2011).
- Tumuluru JS, Sokhansanj S, Hess JR et al. A review on biomass torrefaction process and product properties for energy applications. Indust. Biotechnol.7(5),384–401 (2011).
- Phanphanich M, Mani S. Impact of torrefaction on the grindability and fuel characteristics of forest biomass. Bioresour. Technol.102(2),1246–1253 (2011).
- Prins MJ, Ptasinski KJ, Janssen FJJG. More efficient biomass gasification via torrefaction. Energy31(15),3458–3470 (2006).
- Uslu A, Faaij APC, Bergman PCA. Pre-treatment technologies, and their effect on international bioenergy supply chain logistics. Techno-economic evaluation of torrefaction, fast pyrolysis and pelletisation. Energy33(8),1206–1223 (2008).
- Bergman PCA, Boersma AR, Zwart RWR, Kiel JHA. Torrefaction for Biomass Co-Firing in Existing Coal-Fired Power Stations ‘BIOCOAL’. Energy Research Centre of The Netherlands, Utrecht, The Netherlands (2005).
- Kleinschmidt C. Overview of international developments in torrefaction. Presented at: Central European Biomass Conference. Graz, Austria, 26–29 January 2011.
- Titrici M-M, Antonietti M. Chemistry and materials options of sustainable carbon materials made by hydrothermal carbonization. Chem. Soc. Rev.39,103–116 (2010).
- Sluiter A, Sluiter J. Summative Mass Closure: Laboratory Analytical Procedure (LAP) Review and Integration. National Renewable Energy Laboratory, Golden, CO, USA (2011).
- Lipinsky ES, Arcate JR, Reed TR. Enhanced wood fuels via torrefaction. Fuel Chem. Div.47(1),408–410 (2002).
- Felfli FF, Luengo CA, Suárez JA, Beatón PA. Wood briquette torrefaction. Energy Sust. Dev.9(3),19–22 (2005).
- Bergman PCA, Kiel JHA. Torrefaction for biomass upgrading. Presented at: 14th European Biomass Conference and Exhibition. Paris, France, 17–21 October 2005.
- Yan W, Hastings JT, Acharjee TC et al. Mass and energy balance of wet torrefaction of lignocellulosic biomass. Energy Fuels24(9),4738–4742 (2010).
- Bourgeois JP, Doat J. Torrefied wood from temperate and tropical species: advantages and prospects. In: Bioenergy 84. Proceedings of Conference 15-21 June 1984, Goteborg, Sweden. Volume III. Biomass Conversion. Egneus H, Ellegard A, Okeefe P, Kristofferson L (Eds). Elsevier Applied Science, London, UK, 153–159 (1984).