
Abstract
Background: TNO Triskelion has applied its general workflow for the development of quantitative LC–MS methods for proteins in biological matrices to the quantification of infliximab in rat serum using bottom up μLC–MS/MS. Results/methodology: The general workflow consists of sample purification, analyte processing and LC–MS analysis. In the development of a quantitative μLC–MS/MS method for infliximab in rat serum the analyte processing part and the LC–MS part were optimized, in order to meet the different sample requirements of μLC–MS as compared with UPLC–MS. Using the optimized μLC–MS/MS method the LOQ was 75 ng/ml. Conclusion: The present study showed that it is possible to gain sensitivity when going to smaller scale LC–MS (UPLC–MS to μLC–MS). Due to the combination of a modified sample preparation approach and the application of μLC–MS a lower LOQ could be achieved for infliximab compared with a previously developed UPLC–MS method.
The injected iodoacetamide concentration was approximately 100 mM.
The peptides were injected at 50 ng/ml. The obtained peak areas (arbitrary units) are reported per cone flow setting. The injection volume was 0.2 μl and the samples were injected directly on to the analytical column. The color gradient in the table was set per peptide, going from white for the lowest peak area to dark gray for the highest peak area.
†An online tool was used to calculate the hydrophobicity index [Citation27]. In these two references the tool is described [Citation28,Citation29].
NC: Not calculated; X: Undisclosed amino acid.
![Figure 2. Optimization of the cone flow setting, showing peptide-related effects.The peptides were injected at 50 ng/ml. The obtained peak areas (arbitrary units) are reported per cone flow setting. The injection volume was 0.2 μl and the samples were injected directly on to the analytical column. The color gradient in the table was set per peptide, going from white for the lowest peak area to dark gray for the highest peak area. †An online tool was used to calculate the hydrophobicity index [Citation27]. In these two references the tool is described [Citation28,Citation29].NC: Not calculated; X: Undisclosed amino acid.](/cms/asset/5b63895e-85af-4735-967e-2c5ab9b7100a/ibio_a_12354997_f0008.jpg)
A 50 ng/ml 10-peptide solution was injected directly on to the analytical column and the injection volume was 1 μl. The injection solvent was 15% acetonitrile, 0.1% formic acid and 0.1% TFA in milliQ water. The peptide elution order for the HSS column (with increasing retention time) was ASGXXXX, IYPTNGYTR, SLSLSPGK, FTISADTSK, EFVXXXXXXXXX, DTYIHWVR, AIGXXX, YAGFL, DILLTQSPAILSVSPGER and VVSVLTVLHQDWLNGK.
The theoretical DILLTQSPAILSVSPGER end concentrations ranged from 15 pg/ml to 29 ng/ml. The DILLTQSPAILSVSPGER [13C615N4] end concentration was always 909 pg/ml.
![Figure 4. Extracted ion chromatograms of analyte DILLTQSPAILSVSPGER (632.7 ≥ 731.3) on the left and DILLTQSPAILSVSPGER [13C615N4] (636.3 ≥ 741.5) on the right at different load concentrations of infliximab in rat serum: (A) blank, (B) 5 ng/ml, (C) 10 ng/ml, (D) 20 ng/ml, (E) 100 ng/ml, (F) 200 ng/ml, (G) 500 ng/ml, (H) 1 μg/ml, (I) 2 μg/ml and (J) 10 μg/ml, spanning more than 3 orders of magnitude.The theoretical DILLTQSPAILSVSPGER end concentrations ranged from 15 pg/ml to 29 ng/ml. The DILLTQSPAILSVSPGER [13C615N4] end concentration was always 909 pg/ml.](/cms/asset/abfb68e4-b6a5-43c0-ac94-01c4f271aa33/ibio_a_12354997_f0010.jpg)
![Figure 4. Extracted ion chromatograms of analyte DILLTQSPAILSVSPGER (632.7 ≥ 731.3) on the left and DILLTQSPAILSVSPGER [13C615N4] (636.3 ≥ 741.5) on the right at different load concentrations of infliximab in rat serum: (A) blank, (B) 5 ng/ml, (C) 10 ng/ml, (D) 20 ng/ml, (E) 100 ng/ml, (F) 200 ng/ml, (G) 500 ng/ml, (H) 1 μg/ml, (I) 2 μg/ml and (J) 10 μg/ml, spanning more than 3 orders of magnitude.The theoretical DILLTQSPAILSVSPGER end concentrations ranged from 15 pg/ml to 29 ng/ml. The DILLTQSPAILSVSPGER [13C615N4] end concentration was always 909 pg/ml.](/cms/asset/46777aa9-4182-42a4-86d7-466ce333b6da/ibio_a_12354997_f0011.jpg)
Data taken with permission from [Citation14].
![Figure 6. Orbitrap (Q Exactive, Thermo Fischer Scientific) MS spectrum of DILLTQSPAILSVSPGER (left) and DILLTQSPAILSVSPGER [13C615N4] (right) in one view clearly showing their isotopic distributions.Data taken with permission from [Citation14].](/cms/asset/ac351311-b190-4d0c-8a96-6d4b9d7b3a47/ibio_a_12354997_f0013.jpg)
Presently more than 40 monoclonal antibody (mAb) products are on the US and/or European market for the treatment of a wide variety of conditions in therapeutic areas such as oncology, immunology and neuroscience. At the current approval rate of four new products per year, approximately 70 mAb products will be on the market by 2020 [Citation1]. As one of the first therapeutic antibodies, infliximab (Remicade®) was approved in 1998 by the US FDA, followed a year later by approval in the EU [Citation2]. It is a chimeric mAb against TNF-α and used to treat several autoimmune diseases [Citation3,Citation4].
For the successful development of therapeutic mAbs bioanalytical methods are required to allow their quantification in biological matrices and to obtain dose–response and bioavailability data. Traditionally, the ligand-binding assay (LBA), such as ELISA, is the method of choice for determination of mAbs in biological matrices [Citation5,Citation6]. Lately LC–MS has evolved as a useful complementary technique to LBA. Often it involves a hybrid assay where sample pretreatment and purification is performed by immunoaffinity, followed by analyte processing with (tryptic) digestion and finally detection of a signature peptide by LC–MS [Citation7,Citation8]. In the present article ‘analyte processing’ is defined as the modification of the analyte protein to the detection target, which includes denaturation, reduction, alkylation and digestion. LC–MS has shown some advantages compared with LBA such as a larger linear range, availability of internal standards, multiplexing and higher selectivity; however, instrumentation cost remains high compared with LBA [Citation8]. Presently, there are no regulatory guidelines specific to the quantification and validation of biotherapeutics by hybrid LC–MS assays, but recently recommendations were published to address this issue [Citation9–11]. In the meantime, older guidelines remain to be used for validations [Citation8,Citation12].
In 2015 several groups published hybrid LC–MS methods for the determination and quantification of infliximab. These methods have in common that all were performed using conventional (U)HPLC systems. The LOD in these papers ranged from 0.1 to 1 μg/ml [Citation13–15]. Demand for even lower LODs, higher resolution and smaller sample size has led to further miniaturization. Nano-LC and μLC systems have been developed by several vendors and are quickly gaining popularity. One of these is an integrated μLC-electrospray chip MS interface introduced in 2014, the Waters IonKey/MS™ [Citation16,Citation17]. Applications range from steroids and midazolam to peptides [Citation16,Citation18–20]. Due to the smaller dimensions, the sample composition becomes more important. Although a typical plasma/serum sample is depleted of most other plasma components after immunoaffinity purification, it can still contain substantial amounts of reagents used during analyte processing. Most commonly these reagents are glycine, tris(hydroxymethyl)aminomethane (Tris), ammonium bicarbonate (ABC), chaotropic agents, dithiothreitol (DTT), iodoacetamide (IAA), surfactants, trypsin and trifluoroacetic acid (TFA). The different reagents form a complex sample mixture together with the remains of the biological matrix and can influence each other [Citation21–23], which can lead to problems with blockage and ion suppression. Other problems notoriously associated with nano-LC are dead-volume, leakage and carry-over [Citation24].
At TNO Triskelion a general workflow is applied to develop quantitative methods for proteins in biological matrices. The general workflow consists of three parts: sample purification (e.g., by utilizing protein A magnetic beads, immobilized receptors, immobilized anti-idiotypic antibodies, solid phase extraction), analyte processing (e.g., denaturation, deglycosylation, reduction, alkylation, digestion) and LC–MS. In a previous study [Citation14] infliximab was used as a demonstrator molecule and the general workflow was applied for the development of a UPLC–MS method for infliximab in rat serum. The UPLC–MS/MS study of infliximab [Citation14] was mainly focused on the optimization of the sample purification part (using protein A magnetic beads) and the analyte processing part (elution/denaturation, reduction, alkylation). In the latter study the obtained LOQ for infliximab in rat serum was 100–250 ng/ml.
To explore the possible gain in sensitivity when going to smaller scale LC–MS (UPLC–MS to μLC–MS), we evaluated IonKey technology, an integrated μLC-electrospray chip MS interface. The optimization of the μLC–MS/MS method focused on the analyte processing part and the LC–MS part of the general workflow. Infliximab was again used as a demonstrator molecule to assess the performance of μLC–MS. In order to meet the different sample requirements of μLC–MS as compared with UPLC–MS, the reduction and alkylation steps were performed while infliximab resided on-bead, prior to elution/denaturation and digestion. The detection target for infliximab was DILLTQSPAILSVSPGER (DIL), a tryptic peptide originating from the variable N-terminal part of the light chain of infliximab [Citation4]. Its stable isotope-labeled analog DILLTQSPAILSVSPGER [13C615N4] was used as internal standard. Calibration standards were prepared with infliximab in rat serum. Besides adapting the existing UPLC–MS method for infliximab to μLC–MS another goal of the study was to investigate at which concentration levels acceptable repeatability could be obtained (limited evaluation) using μLC–MS. Finally, a formula was derived to calculate the absolute recovery of the method in order to assess the overall method performance.
Materials & methods
Chemicals & reagents
Infliximab was kindly provided by UMC Utrecht as 10 mg/ml solution. The infliximab concentration was verified using Remicade obtained from a local pharmacy using an immunoaffinity/UPLC–MS hybrid assay [Citation14]. TPCK-trypsin was supplied by Thermo Scientific (Breda, The Netherlands). A signature peptide corresponding to a tryptic fragment of infliximab (DILLTQSPAILSVSPGER, C83H142N22O28) and its stable isotope labeled internal standard (SIL IS) analog (DILLTQSPAILSVSPGER [13C615N4]) were synthesized by Sigma-Aldrich (Zwijndrecht, The Netherlands). Harlan (Horst, The Netherlands) supplied rat serum. PureProteome protein A magnetic beads were purchased from Millipore (Amsterdam, The Netherlands). The other used solvents and chemical reagents were supplied by Fluka (Zwijndrecht, The Netherlands; ammonium bicarbonate, calcium chloride and sodium hydroxide), Merck (Amsterdam, The Netherlands; acetic acid, hydrochloric acid, sodium chloride), Biosolve (Valkenswaard, The Netherlands; acetonitrile, formic acid, methanol), Sigma-Aldrich (dithiothreitol, glycine, iodoacetamide, monosodium phosphate, TFA) and Calbiochem (Amsterdam, The Netherlands; TRIS).
Preparation of calibration & QC samples
Calibration samples with nominal concentrations of 5, 10, 20, (50), 100, 200, 500, 1000, 2000 (and 10,000) ng infliximab per ml pooled rat serum were prepared by serial dilution of the 10 mg/ml stock solution. QC samples were prepared at the following concentrations in pooled rat serum: 15, 25, 75, 250 and 800 ng/ml.
Immunoaffinity purification
The sample purification part was performed using protein A magnetic beads. Protein A has affinity for the Fc part of IgGs [Citation25], but affinity for Fab fragments has also been shown [Citation26].
After washing protein A beads (50 μl) with phosphate-buffered saline (PBS) buffer, 25 μl serum sample was loaded on to the beads in 200 μl PBS buffer, followed by 60-min incubation at room temperature under mild agitation (1000 rpm). Surfactant was not added to the PBS because (remains of) serum provided sufficient complexity to the sample solutions. A magnetic stand (Millipore) was used to separate the beads from the supernatant. The beads were washed three-times in PBS prior to the analyte processing.
Analyte processing
The analyte processing part was modified as compared with the previous method [Citation14] to avoid the presence of reagents in the final sample extracts. These components impair chromatographic and mass spectrometric performance, especially when small column dimensions are applied (see , which shows the IAA trace for UPLC–MS vs μLC–MS as an example). After washing, the purified protein was not eluted. Instead the purified protein was reduced on-bead, by addition of 60 μl PBS and 10 μl 1 M DTT. The beads were incubated at 25°C, 1000 rpm. These relatively mild incubation conditions were selected to avoid denaturation or any structural changes in the infliximab at this stage, which could influence the binding affinity with protein A and/or intramolecular interactions, which could result in unwanted elution from the beads. After removal of the DTT supernatant from the magnetic beads, the alkylation step was performed by addition of 70 μl PBS and 35 μl 0.5M IAA, followed by incubation for 30 min in the dark at ambient temperature. After removal of the IAA supernatant, the beads were washed with 100 mM ammonium bicarbonate. Finally, 50 μl 100 mM glycine pH 2.5 was added and the protein was eluted from the beads and denaturated by incubation at 95°C and 1000 rpm for 10 min. To the supernatant 10 μl IS-peptide solution (20 ng/ml), 55 μl ABC and 70 μl of a 267 μg/ml trypsin solution was added. A relatively high trypsin-to-protein ratio was chosen to ensure high digestion efficiency and to limit the digestion time. The trypsin digestion was performed at 37°C for 150 min, under mild agitation.
μLC–MS/MS
After digestion, 35 μl of an 85/10/5 acetonitrile/formic acid/TFA solution was added to the samples to improve the chromatographic and mass spectrometric performance. Finally the samples were spun over an Amicon 10 kDa molecular cut off filter to remove the trypsin. The μLC–MS/MS system consisted of a Waters NanoAcquity UPLC coupled to a XEVO TQ-S mass spectrometer fitted with an IonKey/MS™ separation device (Waters, MA, USA). Mobile phase A was 0.1% formic acid in milliQ water and mobile phase B was 0.1% formic acid in acetonitrile. The ultrafiltrate (20 μl injection volume) was injected on to a trap column (300 μm × 50 mm M-Class Trap Symmetry C18 100 Å, 5 μm) using a trapping flow of 25 μl/min with 100% mobile phase A, for 1.8 min. After trapping, the flow was reversed and directed to a Waters HSS T3 iKey™ analytical column (150 μm × 50 mm, 130 Å, 1.8 μm).
The flow over the analytical column was 3 μl/min and the column was operated at 40°C. Peptides were eluted from the analytical column using the following gradient: 0–10 min: 95–50% A and 5–50% B, 10–10.5 min: 50–15% A and 50–85% B, 10.5–12 min 15% A and 85% B, 12–12.5 min 15–95% A and 85–5% B, 12.5–15 min 95% A and 5% B. Ionization was performed in the positive mode using a voltage of 3 kV. The cone voltage was 30 V and the source temperature 105°C. [M + 3H]3+ ions, with m/z 632.7, of the peptide DIL were selected in the first quadrupole. The collision energy was 18 eV for the quantifier transitions and argon was used as collision gas. In the third quadrupole y7+ ions, with m/z 731.3, were selected for quantification with dwell time 23 ms. For DILLTQSPAILSVSPGER [13C615N4] (DIL IS) the same settings were applied, but the transition was corrected for the incorporated stable isotopes: m/z 636.3 => 741.5. As qualifiers the following transitions were used m/z 632.7 => 545.3 (y5+), m/z 948.5 ([M + 2H]2+) => 545.3 (y5+) and the corresponding DIL IS transitions m/z 636.3 => 555.3 and m/z 953.5 => 555.3.
As calibration model linear regression with 1/x2 weighting was applied. The peak area ratio between the analyte peptide (released from infliximab) and the internal standard peptide was plotted against the infliximab load concentration in serum. The measured concentration in QC samples was calculated using the calibration curve.
Results & discussion
Optimization of LC & MS settings
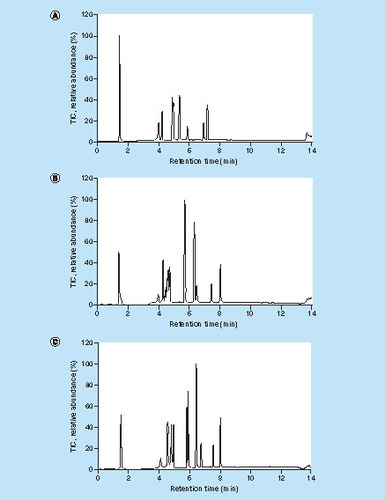
Extensive optimization of LC and MS settings for peptide chromatography and detection was performed before optimization of the analyte processing part, to be able to carefully assess the effect of varying analyte processing parameters. When suboptimal conditions were to be applied the analytical variation would increase, resulting in a decreased parameter optimization assessment power. In order to optimize the peptide chromatography and MS detection, a 10-peptide mixture was prepared with ranging peptide properties (e.g., molecular weight, hydrophobicity, charge). The peptide mixture also contained tryptic peptides from infliximab and trastuzumab. A list of the peptides is provided in . The most important findings of the peptide chromatography and MS/MS detection optimization are summarized below.
TFA is commonly used to enhance chromatographic performance for peptides. It acts as a negative counter ion for positive charges on peptides. TFA improves peak shape but it also causes suppression during electrospray ionization, resulting in a reduced MS/MS sensitivity [Citation30]. For this reason TFA was only added to the injection solvent and not as constituent of the mobile phases. It was observed that the addition of TFA to the injection solvent is sufficient to provide its positive chromatographic effects, in other words, for the 10-peptide mixture a decrease in average peak width and decreased peak tailing was observed. It is postulated that the peptides form ion pairs with TFA in the acidic injection solvent and that these ion pairs survive the LC steps. Even with the use of a trap column loading step and a backflush flow to the analytical column the positive effect of TFA remained.
The addition of acetonitrile to the injection solvent provided positive effects on the chromatography mainly for the more hydrophobic peptides, in other words, a decrease in average peak width. For the early eluting peptides an opposite effect was observed. Therefore the percentage of acetonitrile in the injection solvent should be carefully adjusted in relation to the properties of the target peptide. Furthermore, it was observed that the sensitivity could improve when applying a trapping column, because the injection volume could be increased without compromising the chromatographic performance while simultaneously minimizing injection of nonretained salts and/or other compounds on the analytical column. Of course the injection volume can only be increased when the samples are sufficiently cleaned prior to injection.
With regard to MS settings, the cone flow setting proved to be important and it was found that there was no general, optimal setting which could be applied for all peptides, see . The cone flow was optimized between 0 and 400 l/h. It was observed that for the early-eluting hydrophilic, small peptides a low cone flow was beneficial. For large hydrophobic peptides such as DIL a high cone flow was beneficial with regard to peptide MS signal. It was also noted that the predominant charge state of DIL changed with differing cone flow and therefore always multiple charge states should be monitored during optimization of peptide chromatographic and MS(/MS) settings to obtain the highest possible sensitivity. With regard to quantitative aspects: the application of a SIL IS will correct for charge state distribution shift. To be able to perform absolute recovery calculations the MS(/MS) settings for the analyte and the IS peptides were identical, for example, dwell time, collision energy and precursor and fragment type.
Other varied conditions with minor or general effects were: analytical column (BEH C18 130 Å 1.7 μm, 150 μm × 50 mm iKey [Waters], CSH C18 130 Å, 1.7 μm, 150 μm × 50 mm iKey [Waters] and HSS T3 130 Å 1.8 μm, 150 μm × 50 mm iKey [Waters]). Only the latter HSS column gave complete separation of the 10 peptide mixture with regard to retention time (assessed in TIC [total ion current] mode) which was mainly the result of a lower average peak width, see . Actually the peak shape improvement effect was the lowest for late-eluting peptides such as DIL and highest for early-eluting peptides. However, still the HSS column was selected, because better separation during early elution will also result in less interfering matrix components during late elution. Variation of nano flow (0–2.0 bar), cone voltage (0–150 V) and capillary voltage (2.5–5.0 kV) showed mainly general effects for all 10 peptides in the mixture (data not shown). Therefore the following general settings were selected: 0.25 bar for nano flow, 30 V for cone voltage and 3 kV for capillary voltage. After having optimized the LC and MS(/MS) settings, either generally or specifically for DIL, the analyte processing part was optimized for μLC.
Analyte processing optimization
The UPLC–MS/MS basic method [Citation14] was adapted for the present μLC–MS/MS study. To shortly summarize the UPLC–MS method: infliximab was purified from serum using protein A magnetic beads, followed by elution/denaturation, reduction, alkylation and tryptic digestion prior to UPLC–MS/MS analysis. In this method the reagents used during sample preparation were not specifically removed from the final extract, prior to injection.
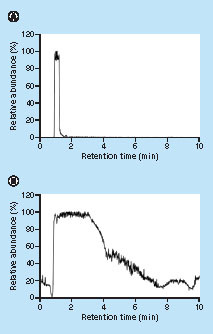
A main difference between UPLC and μLC are the column dimensions. For UPLC, in the previous study [Citation14] an Acquity HSS T3 2.1 mm × 50 mm, 1.8 μm column (Waters) was used, whereas the analytical column in the present study had much smaller dimensions (150 μm × 50 mm, 1.8 μm). In principle the ratio sample volume/chromatographic capacity is higher for μLC–MS and thus the probability of suppression. Therefore reagents should be removed as much as possible prior to injection. This is illustrated in , which shows the iodoacetamide trace at m/z 186 in positive mode when a solution containing approximately 100 mM iodoacetamide was analyzed using a UPLC–MS system (Waters Acquity UPLC, Sciex Qtrap 6500) and a μLC–MS system (Waters M-Class IonKey, XEVO TQS). In μLC–MS the iodoacetamide trace is observed during the whole run and therefore it could interfere with the ionization of target analytes during the whole run. In contrast, in UPLC–MS only a narrow part of the chromatogram contains the iodoacetamide trace.
As mentioned before, the presence of DTT and IAA in the final extract was avoided by the performance of reduction and alkylation on-bead (while the infliximab remained bound) and washing away the reagents after the reaction. Theoretically, reduction and/or alkylation are not required for the release of DIL from infliximab, but these steps were included in our protocol. Another group found that omitting these steps compromises good data accuracy and precision and increases intrarun variability, especially for target peptides, which are located in the Fc region, such as VVSVLTVLHQDWLNGK [Citation31].
The DTT- and IAA-supernatants were subjected to digestion and LC–MS analysis to confirm the absence of infliximab, monitored by DIL. Elution and denaturation were performed after reduction and alkylation. It should be noted that in our experience reduction/alkylation cannot be performed on-bead for each mAb or antibody–drug conjugate as it could result in (partial) elution or loss of payload, depending on the molecular structure. Initially the digestion step was also performed on-bead, but unidentified interferences, which were probably due to digested protein A, deteriorated the performance and robustness (data not shown). Therefore it was decided to perform digestion off-bead, after elution/denaturation. The trypsin was subsequently removed from the samples by spinning down the sample through a 10 kDa spin filter.
Evaluation results & discussion
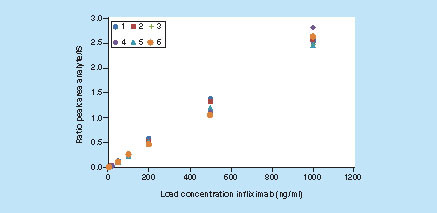
Using the optimized conditions which are described in the ‘Materials & methods’ section an evaluation experiment was performed to determine the LOQ. The QC samples were prepared at 15, 25, 75, 250 and 800 ng/ml in pooled rat serum and calibration samples at nine concentrations between 5 and 2000 (or 10,000) ng/ml, also in pooled rat serum. A calibration curve was analyzed during six runs. During one of these runs the QC samples were analyzed in sixfold and during the other runs in single fold. During 5 runs blank pooled rat serum samples with and without added internal standard were analyzed to assess the specificity. The six runs were performed on four different days. The results of the calibration curves are summarized in . When the deviation in the back-calculated concentration was higher than 20% (25% for the lowest-concentration calibration solution) calibration points were removed, according the recommendations for hybrid assays [Citation10], and the calibration curve equation was recalculated. Furthermore always ≤25% of the calibration points were removed, according to FDA/EMA guidelines [Citation32,Citation33]. The simplest model that adequately described the concentration–response relationship was selected, which was linear regression [Citation32]. It was necessary to apply 1/x2 weighting. Using 1/x or no weighting factor the deviations in the back-calculated concentration of the lower-concentration calibration samples were unacceptably high, due to the large dynamic range of >3 orders of magnitude. In the signals for 5–10,000 ng/ml calibration samples are shown for the analyte peptide and the IS peptide. Even at 5 ng/ml there is a clear additional signal compared with a blank sample. The six obtained calibration curves are shown in in 1 graph, in the 0–1000 ng/ml range.
The results of all the QC samples are provided in and the individual data for run 2 in . From the results it can be concluded that the determined LOQ for infliximab in rat serum is 75 ng/ml, but the actual LOQ for this method will be somewhere between 25 and 75 ng/ml. Going from 75 to 25 ng/ml the RSD increases with decreasing concentration and at 25 ng/ml the relative standard deviation (RSD) is slightly too high to meet (proposed) criteria for LBA/hybrid assays [Citation10,Citation32–33]. As there is still sufficient sensitivity in the 15–75 ng/ml range, it is expected that it is possible to lower the LOQ of the μLC–MS method by further optimization. A striking feature is the relatively low RSD in the slopes of the calibration curves (5.4%), which indicates that the method is robust. The specificity of the method was acceptable as the average signal obtained for blank pooled rat serum samples was approximately 14% of the signal obtained with 25 ng/ml samples. The recoveries presented in & actually represent relative recoveries against calibration samples which were purified, processed and analyzed in exactly the same way as QC samples.
To assess the overall performance of a method the obtained absolute recovery is important. In our experimental set up using infliximab itself as constituent of calibration samples and subjecting the calibration samples to exactly the same procedure as QC samples, the calculated accuracies actually represent relative recoveries: the calibration samples exhibit the same losses/inefficiencies as QC samples during sample preparation and analysis, for example, sample purification, digestion. Although an acceptable and repeatable relative recovery is sufficient for accurate study sample analysis, the absolute recovery should be sufficiently high to avoid suboptimal steps in the protocol, which could lead to more analytical variation and a lower ruggedness of the method. Unforeseen variables can of course affect the performance of a method to a great extent. The known added concentration of SIL IS was used to calculate the absolute recovery, see below.
The absolute recovery was determined by defining a formula for the slope of the calibration curve in case of 100% absolute recovery and comparison of the experimental slopes with this theoretical slope.
The formula consists of the following parts (EquationEquations 1(1) & Equation2
(2) ):
(1)
Where CEpep is end concentration analyte peptide in ng/ml, MWpep is molecular weight analyte peptide (which occurs two-times in the analyte protein) in Da, MWprot is molecular weight analyte protein in Da, VLprot is load volume protein in μl, VEprot is end volume protein in μl and CLprot is load concentration analyte protein in ng/ml.(2)
Where CEis is end concentration peptide internal standard in ng/ml, VLis is load volume peptide internal standard in μl, VEis is end volume peptide internal standard in μl and CLis is load concentration peptide internal standard in ng/ml.
The calibration curve has the following basic equation y = ax + b, where a is the slope and b the intercept. The y value CEpep/CEIS is multiplied by the ratio MWIS/MWpep, to change the formula from concentration-based to molar-based, where MWIS is the molecular weight of the peptide internal standard in Da. The x value is CLprot. When it is assumed that the intercept b is not significant and that there is a linear relationship between concentration and signal, the following formula (EquationEquation 3(3) ) is obtained for the slope.
(3)
The terms CLprot and MWpep both occur in the numerator and the denominator and thus cancel each other out. VEIS and VEprot are the same volume and thus cancel each other out. Therefore the following final, very simple formula is obtained (EquationEquation 4(4) ) for the slope:
(4)
In EquationEquation 4(4) the disturbed isotopic distribution (shown in ) by introduction of an isotopic label in the internal standard is not yet included. Therefore the final formula with inclusion of a labeled internal standard becomes (EquationEquation 5
(5) ):
(5)
where F1pep is fraction of first isotope for analyte peptide and F1IS is fraction of first isotope for IS peptide. It is assumed that the slightly different physical properties of DIL IS as compared with DIL do not have a large effect on the slope. Other factors which could influence the slope are for instance the m/z isolation window, precursor and fragment isotope selection and background signal.
For DIL the first isotope makes up approximately 34.7% of the total DIL signal. For DIL IS the first isotope makes up approximately 37.5% of the total DIL IS signal. Therefore the calculated slope at 100% absolute recovery, corrected for the disturbed isotopic distribution will be:
The absolute recovery using this formula (with correction for the isotopic distribution differences between analyte and IS peptide) was calculated to be 84% on average, because the average experimental slope was 0.00247 (see ). Considering the number of steps in the protocol, the absolute recovery is high. The step where most of the loss occurs, was also identified. In our approach, the eluate from the protein A beads is transferred to a different vial. The remaining protein A beads were digested with trypsin and a significant DIL signal was obtained. The lost infliximab thus resided in the remaining liquid between the beads and perhaps also in part still bound to the beads.
Conclusion
In the present study the possible gain in sensitivity when going to smaller scale LC–MS (UPLC–MS to μLC–MS) was explored for infliximab, as a demonstrator molecule, in rat serum. We evaluated IonKey technology, an integrated μLC-electrospray chip MS interface. The optimization of the μLC–MS/MS method focused on the analyte processing part and the LC–MS part of the presented general workflow. In order to meet the different sample requirements of μLC–MS as compared with UPLC–MS, the reduction and alkylation steps were performed while infliximab resided on-bead, prior to elution/denaturation and digestion. The detection target for infliximab was DILLTQSPAILSVSPGER and its stable isotope labeled analog DILLTQSPAILSVSPGER [13C615N4] was used as internal standard. Calibration standards were prepared with infliximab in rat serum and were subjected to the same procedure as QC samples. Besides adapting the existing UPLC–MS method for infliximab to μLC–MS another goal of the study was to investigate at which concentration levels acceptable repeatability could be obtained (limited evaluation) using μLC–MS.
Compared with the obtained LOQ for infliximab in rat serum of 100–250 ng/ml in a previously performed UPLC–MS study of infliximab in rat serum [Citation14], in the present μLC–MS study a 75 ng/ml LOQ was achieved due to the combination of a modified sample preparation approach and the application of μLC–MS. A disadvantage of the presented μLC–MS/MS method is the relatively long run time (16.8 min) compared with UPLC–MS/MS (typically 4–8 min, e.g., the run time of the aforementioned UPLC–MS method for infliximab was 4 min [Citation14]), which makes the approach less suitable for high-throughput applications. Finally, the importance of absolute recovery in relation to ruggedness was pointed out and a formula to calculate the absolute recovery for the presented application was defined.
If required, the sample purification part can be further optimized as the sensitivity allows an even lower than 75 ng/ml LOQ. In order to measure infliximab in clinical samples, which are expected to contain relatively high IgG levels, the added protein A bead surface area could be increased. Also a more selective purification could be applied, such as purification using immobilized TNF-α or anti-idiotypic antibodies against infliximab.
Future perspective
It is anticipated that the LC–MS field will move to smaller column dimensions when more sensitive methods are required. More and more effort will be put in the optimization of each single step in the sample purification, analyte processing and LC–MS parts to avoid suboptimal conditions.
Table 1. Summary of the calibration curve results.
Table 2. Summary of the quality control results, recoveries in percentage.
Table 3. Back-calculated concentrations, accuracies and intrarun precision data for run 2.
Background
TNO Triskelion has applied its general workflow for the development of quantitative LC–MS methods for proteins in biological matrices, to the quantification of infliximab in serum using bottom up μLC–MS/MS. The method from the present study is based on an existing UPLC–MS/MS method.
Experimental
First, LC and MS settings were optimized, primarily composition of the injection solvent, LC approach and MS source settings. Subsequently, analyte processing steps were optimized in order to provide clean final extracts for μLC–MS/MS analysis. After having optimized analyte processing and μLC–MS parameters a limited evaluation experiment was performed with infliximab.
Results/methodology
It was found that part of the settings could be generally optimized for peptides and that other settings should be optimized for each target peptide individually. Due to the combination of a modified sample preparation approach and the application of μLC–MS the LOQ was 75 ng/ml.
Conclusion
In the present study μLC–MS/MS with improved sample clean-up was shown to be more sensitive than conventional UPLC–MS/MS for the quantitative analysis of infliximab in rat serum.
Ethical conduct of research
The authors state that they have obtained appropriate institutional review board approval or have followed the principles outlined in the Declaration of Helsinki for all human or animal experimental investigations. In addition, for investigations involving human subjects, informed consent has been obtained from the participants involved.
Financial & competing interests disclosure
The work was financed by TNO Triskelion. The authors have no other relevant affiliations or financial involvement with any organization or entity with a financial interest in or financial conflict with the subject matter or materials discussed in the manuscript apart from those disclosed.
No writing assistance was utilized in the production of this manuscript.
References
- Ecker DM , JonesSD, LevineHL. The therapeutic monoclonal antibody market. MAbs7 (1), 9–14 (2015).
- Reichert JM . Therapeutic monoclonal antibodies approved or in review in the European Union or the United States. Update 26 May2015. www.antibodysociety.org.
- Danese S , ColombelJF, ReinischW, RutgeertsPJ. Review article: in?iximab for Crohn’s disease treatment shifting therapeutic strategies after 10 years of clinical experience. Aliment. Pharmacol. Ther. 33 (8), 857–869 (2011).
- Stadlmann J . Applications of a Mass-spectrometric Method for the N-glycosylation Analysis of Immunoglobulin G molecules, in Department of Chemistry. University of Natural Resources and Applied Life Sciences, 31 (2009).
- Damen CW , SchellensJH, BeijnenJH. Bioanalytical methods for the quantification of therapeutic monoclonal antibodies and their application in clinical pharmacokinetic studies. Hum. Antibodies18 (3), 47–73 (2009).
- Schmitz EM , van de KerkhofD, HamannDet al. Therapeutic drug monitoring of infliximab: performance evaluation of three commercial ELISA kits. Clin. Chem. Lab. Med. doi: 10.1515/cclm-2015–0987 (2015) ( Epub ahead of print).
- Van Den Broek I , NiessenWM, van DongenWD. Bioanalytical LC–MS/MS of protein based biopharmaceuticals. J. Chromatogr. B Analyt. Technol. Biomed. Life Sci. 929, 161–179 (2013).
- Jiang H , ZengJ, TitschCet al. Fully validated LC–MS/MS assay for the simultaneous quantitation of coadministered therapeutic antibodies in cynomolgus monkey serum. Anal. Chem. 85 (20), 9859–9867 (2013).
- Jenkins R , DugganJX, AubryAFet al. Recommendations for validation of LC–MS/MS bioanalytical methods for protein biotherapeutics. AAPS J. 17 (1), 1–16 (2015).
- Dufield D , NeubertH, GarofoloFet al. 2014 White paper on recent issues in bioanalysis: a full immersion in bioanalysis (Part 2 – hybrid LBA/LCMS, ELN & regulatory agencies’ input). Bioanalysis6 (23), 3237–3249 (2014).
- Knutsson M , SchmidtR, TimmermanP. LC–MS/MS of large molecules in a regulated bioanalytical environment – which acceptance criteria to apply?Bioanalysis5 (18), 2211–2214 (2013).
- Liu A , KozhichA, PassmoreDet al. Quantitative bioanalysis of antibody-conjugated payload in monkey plasma using a hybrid immuno-capture LC–MS/MS approach: Assay development, validation, and a case study. J. Chromatogr. B Analyt. Technol. Biomed. Life Sci. 1002, 54–62 (2015).
- Willrich MA , MurrayDL, BarnidgeDR, LadwigPM, SnyderMR. Quantitation of infliximab using clonotypic peptides and selective reaction monitoring by LC–MS/MS. Int. Immunopharmacol. 28 (1), 513–520 (2015).
- Kleinnijenhuis AJ , ToerscheJH, van HolthoonFL, BasRC, van DongenWD. A generic sample preparation approach for LC–MS/MS bioanalysis of therapeutic monoclonal antibodies in serum applied to infliximab. J. Appl. Bioanal. 1 (1), 26–34 (2015).
- Peng X , LiuB, LiYet al. Development and validation of LC–MS/MS method for the quantitation of infliximab in human serum. Chromatographia78 (7–8), 521–531 (2015).
- Gallagher R , DillonL, GrimsleyA, MurphyJ, SamuelssonK, DouceD. The application of a new microfluidic device for the simultaneous identification and quantitation of midazolam metabolites obtained from a single micro-litre of chimeric mice blood. Rapid Commun. Mass Spectrom. 28 (11), 1293–1302 (2014).
- Alelyunas YW , RomanGT, JohnsonJ, DoneanuC, WronaMD. High throughput analysis at microscale: performance of ionKey/MS with Xevo G2-XS QTof under rapid gradient conditions. J. Appl. Bioanal. 1 (4), 128–135 (2015).
- Broccardo CJ , SchauerKL, KohrtWM, SchwartzRS, MurphyJP, PrenniJE. Multiplexed analysis of steroid hormones in human serum using novel microflow tile technology and LC–MS/MS. J. Chromatogr. B934, 16–21 (2013).
- Foster MW , ThompsonJW, LedfordJGet al. Identification and quantitation of coding variants and isoforms of pulmonary surfactant protein A. J. Proteome Res. 13 (8), 3722–3732 (2014).
- Faria M , HalquistMS, YuanM, MylottWJr., KarnesRH. Comparison of a stable isotope labeled (SIL) peptide and an extended SIL peptide as internal standards to track digestion variability of an unstable signature peptide during quantification of a cancer biomarker, human osteopontin, from plasma using capillary microflow LC–MS/MS. J. Chromatogr. B1001, 156–168 (2015).
- Waas M , BhattacharyaS, ChuppaSet al. Combine and conquer: surfactants, solvents, and chaotropes for robust mass spectrometry based analyses of membrane proteins. Anal. Chem. 86 (3), 1551–1559 (2014).
- Hedrick VE , LaLandMN, NakayasuES, PaulLN. Digestion, purification, and enrichment of protein samples for mass spectrometry. Curr. Protoc. Chem. Biol. 7 (3), 201–222 (2015).
- Leon IR , SchwämmleV, JensenON, SprengerRR. Quantitative assessment of in-solution digestion efficiency identifies optimal protocols for unbiased protein analysis. Mol. Cell Proteomics12 (10), 2992–3005 (2013).
- Noga M , SucharskiF, SuderP, SilberringJ. A practical guide to nano-LC troubleshooting. J. Sep. Sci. 30 (14), 2179–2189 (2007).
- Bergmann-Leitner ES , MeaseRM, DuncanEH, KhanF, WaitumbiJ, AngovE. Evaluation of immunoglobulin purification methods and their impact on quality and yield of antigen-specific antibodies. Malar. J. 7, 129 (2008).
- Jansson B , UhlenM, NygrenPA. All individual domains of staphylococcal protein A show Fab binding. FEMS Immunol. Med. Microbiol. 20 (1), 69–78 (1998).
- LSS Slope Calculator . http://hs2.proteome.ca/SSRCalc/Slope.
- Spicer V , GrigoryanM, GotfridA, StandingKG, KrokhinOV. Predicting retention time shifts associated with variation of the gradient slope in peptide RP-HPLC. Anal. Chem. 82 (23), 9678–9685 (2010).
- Vu H , SpicerV, GotfridA, KrokhinOV. A model for predicting slopes S in the basic equation for the linear-solvent-strength theory of peptide separation by reversed-phase high-performance liquid chromatography. J. Chromatogr. A1217, 489–497 (2010).
- Gustavsson SÅ , SamskogJ, MarkidesKE, LångströmB. Studies of signal suppression in liquid chromatography-electrospray ionization mass spectrometry using volatile ion-pairing reagents. J. Chromatogr. A937, 41–47 (2001).
- Jiang H , XuW, TitschCet al. Innovative use of LC–MS/MS for simultaneous quantitation of neutralizing antibody, residual drug, and human immunoglobulin G in immunogenicity assay development. Anal. Chem. 86 (5), 2673–2680 (2014).
- Guidance for Industry Bioanalytical Method Validation . US Department of Health and Human Services, US FDA, Rockville, MD, USA (2001). www.fda.gov/downloads/Drugs/Guidances/ucm070107.pdf.
- Guideline On Bioanalytical Method Validation . European Medicines Agency, London, UK (2011). www.ema.europa.eu/docs/en_GB/document_library/Scientific_guideline/2011/08/WC500109686.pdf.