Abstract
Carbon reduction is a critical global priority this century. Cities have grown rapidly in the age of cheap oil, creating a landscape of major and megacities, and emerging megaregions. In this rapidly urbanizing world, cities now consume 75% of the world’s energy and emit 80% of the world’s GHGs and are presently growing globally at the rate of 2% per year. Reducing oil use is both an environmental and political necessity. However, it is not without economic and social ramifications, which may be different at different locations, and at different time periods in the same location. This article discusses the need for considering carbon management in the context of local socioeconomic conditions and constraints in different countries and regions. The sustainability footprint model is presented and applied to highlight differences in the marginal costs of development with respect to carbon reduction and the implications for effective carbon management. The study findings indicate that the marginal costs of human development, with respect to carbon footprint reduction, tend to be higher as human development increases. This implies that a comprehensive approach to carbon management is necessary and that exploring different standards and targets for different typologies of countries based on their present levels of development may be helpful in developing the consensus needed for global standards for effective carbon management.
SF: Sustainability footprint; QOL: Quality of life.
Reproduced with permission from Citation[4].
![Figure 1. The sustainability footprint model (environmentally centered).SF: Sustainability footprint; QOL: Quality of life.Reproduced with permission from Citation[4].](/cms/asset/ac9fc1d0-f027-4ab2-8be1-4757b0cf94d2/tcmt_a_10816207_f0001.gif)
SF: Sustainability footprint.
Figure was presented at the Annual Meeting of the Transportation Research Board Citation[5].
![Figure 2. The sustainability footprint model.SF: Sustainability footprint.Figure was presented at the Annual Meeting of the Transportation Research Board Citation[5].](/cms/asset/5db786fb-b8f1-4bf4-a37a-904d1d7bdd2e/tcmt_a_10816207_f0002.gif)
Figure was presented at the Annual Meeting of the Transportation Research Board Citation[5].
![Figure 3. Human development index versus ecological footprint.Figure was presented at the Annual Meeting of the Transportation Research Board Citation[5].](/cms/asset/0e77ed65-68ad-40b8-aed9-5b30140311a2/tcmt_a_10816207_f0003.gif)
HDI: Human development index; QOL: Quality of life.
Figure was presented at the Annual Meeting of the Transportation Research Board Citation[5].
![Figure 4. Logical pathways to sustainability.HDI: Human development index; QOL: Quality of life.Figure was presented at the Annual Meeting of the Transportation Research Board Citation[5].](/cms/asset/bd67d533-ecfa-4115-8532-e503be76321d/tcmt_a_10816207_f0004.gif)
Achieving global carbon reduction must involve the development of broad consensus on carbon reduction standards and targets. However, approximately 25 years after the UN’s global blueprint to sustainability: ‘Our Common Future’ also known as the ‘Brundtland Report’ Citation[1], binding standards for sustainability, for example, GHG reduction, have been very difficult to achieve at the global level, depite several attempts. Indeed, a review of the academic and popular literature reveals that several attempts to develop consensus among heads of states for binding standards on global priorities for sustainable development have been unsuccessful. For example, over 100 heads of states met at the 2002 World Summit in Johannesburg, South Africa, to develop standards for sustainable development and approved an ambitious 70-page plan; however, that plan was non-binding Citation[2]. In June 2007, at the G8 Meeting of leaders of the world’s most economically developed nations in Germany, failed to produce any hard goals on climate change Citation[101]. In December 2009, several national leaders met in Copenhagen, Denmark, to adopt standards for GHG emissions and left without any quantitative, binding standards Citation[3]. Yet again, in November and December 2010, the UN Conference on Climate Change took place in Cancun, Mexico, with an agreement but no binding treaty for GHG reduction Citation[102]. At other times when global leaders have met, the aftermath has found rich and poor countries in particular in disagreement and blaming each other for their unwillingness to compromise Citation[103].
One of the reasons for the difficulties in achieving consensus on binding standards for climate change and other sustainable development priorities can be the lack of explicit acknowledgement and consideration of differences in local development needs, priorities and constraints Citation[4]. While it is perhaps not simple to address the tension between local development priorities and articulated global sustainability priorities, it is necessary to do so in order to achieve consensus and make sustained progress toward global priorities. This article presents a model developed to help address this issue: the sustainability footprint (SF) model Citation[4,5], and applies the model to demonstrate differences and similarities in critical sustainable development issues in developing and developed countries, as well as their implications for operational definitions of sustainable development, logical pathways to sustainability, and consensus development on global sustainability issues, including carbon management.
Sustained progress toward carbon reduction will ultimately require the engagement of a critical mass of developed and developing countries, particularly as developing countries enter into the phase of rapid development with the potential of placing significant burdens on the natural environment, and, thus, on the global community. Most of the growth anticipated in the first half of this century will occur in developing regions. A population ratio of 6:1 is expected for developing regions compared with developed regions in the year 2050, which is in contrast with a 2:1 ratio in 1950 Citation[6]. Along with this growth may arrive a growing middle class with higher demands for goods and services, and increased consumption with associated environmental impacts. A good understanding of the basic differences and similarities in the sustainable development priorities in developed and developing regions can be helpful in achieving the much-needed consensus on carbon reduction and other sustainability targets at the global level. In essence, efforts that attempt to consider local sustainable development priorities while setting global standards and targets, will have a higher chance of gaining the consensus necessary for the much needed progress.
This article uses the Brundtland definition of sustainable development: development that meets the needs (and aspirations) of current generations without compromising the ability of future generations to meet their own needs Citation[1]. While sustainable development can be viewed as a process that has environmental sustainability and human development as end goals, environmental (or any other type of) sustainability can be viewed as a state or condition rather than a process. The American Society of Civil Engineers defines sustainability as a set of environmental, economic and social conditions in which all of society has the capacity and opportunity to maintain and improve its quality of life indefinitely without degrading the quantity, quality or availability of natural, economic and social resources Citation[7].
The SF model: accounting for capital
The SF model was first developed in 2007 by Amekudzi, Khisty and Khayesi in response to the difficulties present in achieving consensus for global standards for sustainability Citation[4]. A review of the literature indicated that significantly more work had been implemented on the environmental and economic, compared with the social elements of sustainability. However, several historic and current development initiatives worldwide are centered on creating and sustaining thriving communities and, thus, the authors felt that the social quality of life element was critical for any tool to effectively measure sustainable development or progress toward sustainability. The SF, developed as a socioenvironmental capital resource accounting tool and initially applied to infrastructure systems, was originally defined as the rate of change of some measure of civil infrastructure system performance as it pertains to the well being of system users (e.g., quality of life), as a function of the environmental costs associated with attaining that system performance (e.g., the consumption of natural resources and generation of wastes) . This concept can be formulated using calculus and applied to evaluate the relative progress of different infrastructure-and-community systems with respect to developing sustainably or moving toward sustainability in given time frames. Amekudzi et al. apply this model to evaluate the sustainable value generated by the Atlanta and Chicago metro highway networks using data from the Texas Transportation Institute’s Urban Mobility Report series and the Global Footprint Network’s (GFN) Ecological Footprint database, and demonstrate that while both systems moved away from sustainability in the 1990–2000 decade, the Atlanta metro area system seemed to move away more significantly from sustainability than the Chicago area network Citation[5].
The original SF model is environmentally centered and lacks an economic dimension. The model has since been revised and expanded to incorporate an economic dimension Citation[5]. In the revised model, the SF relative to a civil infrastructure system is defined as the rate of change of some measure of system performance (related to the quality of life of system users) as a function of the environmental and economic costs and benefits associated with attaining that system performance . Under the revised and expanded construct, the SF of entity C (e.g., municipality, metropolitan area or nation) between two finite points in time, t=i and t=i+n can be formulated as the vector of quantities below :
Equation 1
where:
is the SF of city C between time t=i and t=i+n (where n is some finite amount of time); Zc is the system performance of the infrastructure related to the quality of life or some other measure of human capital of the city’s inhabitants (a subset of which is the system’s users); Xc is the wastes generated and output to the environment, and resources used or inputs taken from the environment by the city, associated with the infrastructure system, and Yc is the economic net benefits (i.e., economic benefits less costs), of the city associated with the infrastructure system.
In essence, the equation states that the SF of an entity in a given time frame can be captured by examining the rate of change of system performance (as it relates to quality of life or some other measure of human capital) with respect to the environmental impacts and economic net benefits accruing from progress in human development in that time frame (i.e., first element in vector). The second, third and fourth elements in the vector provide assessments of the change in quality of life with respect to time, environmental capital with respect to time, and economic net benefits with respect to time. These measures can help decision makers diagnose the most critical issues for any particular community or other entity being evaluated. The final three elements of the vector capture base values of quality of life, environmental capital and economic capital, showing the snapshot current conditions of the entity being evaluated.
Under this construct, entities that generate the highest human capital value with the lowest ecological footprint (EF) and the highest net benefits can be viewed as superior in terms of sustainable developement. Viewed generally, the SF can be considered as a resource accounting tool that can be used to track capital transformations (i.e., environmental capital to economic capital and economic capital to human capital) that are made over time by municipalities, countries and other decision-making entities, in their pursuit and sustenance of thriving communities. More details including model strengths, weaknesses and evolution are available in Amekudzi et al.Citation[4,5]. The strengths and weaknesses of the EF have been critiqued elsewhere (e.g., Citation[8] and Citation[9]). The EF in particular does not take into account trade and the possibility that environmental impacts can be outsourced while achieving a high quality of life. As with other relatively new and evolving measures, the EF should continue to undergo critical examination and refinement, and can be used in conjunction with other measures.
Application of the SF to determining local sustainable development priorities
Using EF data from the GFN, and human development index (HDI) data from the UN’s Human Development Reports, the SF construct was applied to explore and better understand how the status of human capital development and natural environmental capital usage should influence sustainable development priorities and hence pathways to sustainability.
The UN pioneered the HDI in the early 1990s. In 1990, the first human development report introduced a new way of measuring development by combining indicators of life expectancy, educational attainment and income (i.e., measures of health, knowledge and standard of living) into a composite HDI, the HDI. The HDI uses a single statistic to serve as a frame of reference for both social and economic development. It sets a minimum and a maximum for each dimension, called goalposts, and then shows where each country stands in relation to these goalposts, expressed as a value between zero (least desirable) and one (most desirable) Citation[10]. Very high, high, medium and low HDI groups are country classifications based on HDI quartiles. A country is in the very high group if its HDI is in the top quartile (e.g., Australia and USA); is in the high group if its HDI is in the 51st to 75th percentile (e.g., Malaysia) and so on. Citation[11]. The HDI has been critiqued elsewhere (e.g., Citation[12] and Citation[13]).
Ecological footprint data can be obtained from the GFN’s database. The GFN measures human impact on the earth to provide the necessary data for informed choices that promote sustainable development and sustainability. The EF is an environmental resource accounting tool and data-driven metric that measures how much natural resources are available, how much are being used and who is using what. Footprint accounts functions like bank statements. The GFN documents whether we are living within our ecological budget or consuming nature’s resources faster than the planet can renew them. Developed by Wackernagel and Rees, the EF measures the amount of biologically productive land and water area required to produce all the resources an individual, population or activity consumes, and to absorb the waste they generate, given prevailing technology and resource management practices. It is measured in global hectares. A global hectare is a common unit that encompasses the average productivity of all the biologically productive land and sea area in the world in a given year. Biologically productive areas include cropland, forest and fishing grounds, and do not include deserts, glaciers and the open ocean. The EF of a person is calculated by considering all of the biological materials consumed and all of the biological wastes generated by that person in a given year. All these materials and wastes are then individually translated into an equivalent number of global hectares. Measured EFs are compared with the biocapacity, which is the total amount of area available to generate resources and absorb wastes. When the human demand exceeds available biocapacity, this is referred to as overshoot Citation[104,14]. A comprehensive critique of the EF can be found elsewhere Citation[8]. In this discussion, the EF is used as a measure for capturing the environmental impacts of community decision making. Various environmental impact measures may be used in place of or in conjunction with the EF depending on the issues under consideration.
Combining measures of human development and the EF can give us some insights about major opportunities and constraints for sustainable development in various societies or local contexts. plots EF data against HDI data, showing the snapshot SFs for various nations in 2009 Citation[15]. The figure shows that there is a set of countries with more of a deficit as far as human development is concerned (e.g., Niger, Sierra Leone and Haiti) operating at relatively less expense to the natural environment; while there are other countries (e.g., the UAE and USA) operating with relatively high levels of human development and with a relatively high impact on the natural environment. A third set of countries (e.g., Norway and Japan) can be isolated for their success at generating relatively high levels of human development at a relatively lower expense to the natural environment. Based on this data, one could view these snapshot SFs as indicating that the primary sustainable development priorities of countries in the Niger–Sierra Leone–Haiti group are related to improving the living standards of their communities while leapfrogging the historic natural environment burdens of development. Conversely, the UAE––USA group of countries could be viewed as having primary sustainability priorities related to environmental impact reduction while continuing to make progress in improving the quality of life of their communities. The third group of countries in the Norway–Japan group could be viewed as having set the current standard for sustainable development and sustainability in the sense that they have been most successful at generating some of the highest levels of quality of life for their communities with the least impacts on the natural environment. Determining whether they are actually environmentally sustainable on an absolute scale, however, would entail an analysis to determine whether their relative EFs have exceeded their relative biocapacities, and whether they are moving toward or away from sustainability. These current statuses in socialeconomic-environmental capital usage and human development hint at different sustainable development pathways to the same destination of sustainability (i.e., sustainability in continued human and economic development or progress) , and indicate that local risks of failure to achieve sustainability can be different for different countries moving toward the same goal of global sustainability.
Pursuing contextually appropriate carbon management
This section applies the SF concept to carbon management. Owing to the focus of this discussion on carbon management, carbon footprint data are used as the environmental impact measure in the model. summarizes carbon footprint and HDI data for selected high-, middle- and low-income countries for the years 2000 and 2005. The countries were selected to include low-, medium- and high-HDI conditions, to capture the full range of general living conditions in various countries around the world. The following analysis is conducted to illustrate that there are potentially important differences in development priorities that are linked with carbon management, and that considering these differences when developing global standards for carbon reduction would facilitate the achievement of consensus. HDI data was obtained from the human development reports, produced annually by the UN development programme since 1990. Human development is a development paradigm that is more than just the rise and fall of national incomes. It is about creating an environment in which people can develop their full potential and lead productive, creative lives in accord with their needs and interests. The HDI paradigm considers people as the real wealth of nations. This, development is about expanding the choices people have to live the lives that they value Citation[10,11]. National carbon footprint data was obtained from the Carbon Dioxide Information Analysis Center, the primary climate-change data and information analysis center of the US Department of Energy Citation[105]. The data were normalized to produce per capita footprint data by Gapminder (a non-profit venture focused on sustainable global development) for educational purposes. The carbon footprint or per capita CO2 emissions (metric tons of carbon per person during the given year) is calculated by dividing the total CO2 emitted by the population of the countries.
Analysis & results
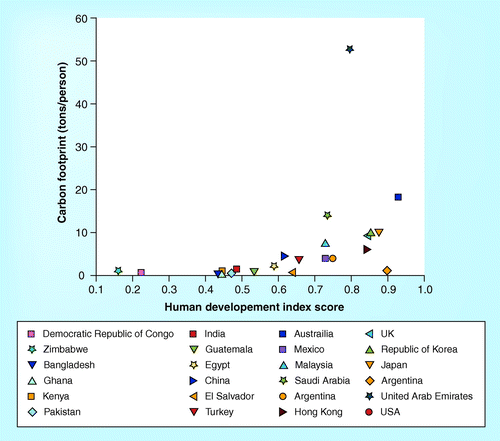
shows 22 countries ranging from low-income to high-income status with HDIs ranging from 0.16 to 0.93 (from the year 2005), indicating the wide disparity in the general living conditions in these countries. The HDI is measured from 0 to 1 indicating the lowest and highest levels of human development, respectively. At the same time, the data shows that per capita carbon footprints range from as low as 0.3–53.5 metric tons per capita.
Closer examination of the data seems to indicate that the ‘low-HDI’ countries are also those where the per capita carbon footprint is relatively low. In the context of sustainable development, ‘low-HDI’ countries with relatively low carbon footprints (e.g., Bangladesh, Ghana, Democratic Republic of Congo and Kenya) are likely to place a greater emphasis on improving very basic conditions such as access to clean water, sanitation, food, health and education. Carbon reduction, when considered as a policy objective, will probably be considered simultaneously with achieving basic human development goals, such as those articulated above and in the millennium development goals, or considered as a constraint in achieving these objectives. Considering the snapshot SFs of these countries , many would agree that carbon reduction strategies that do not simultaneously prioritize basic human development initiatives can have high opportunity costs and are not ideal for these communities.
Countries with relatively low HDI and yet a relatively high per capita carbon footprint, would raise a red flag concerning their relative inefficiency of carbon management in achieving development objectives. None of the countries shown in or shows susceptibility to this risk.
Examination of the snapshot SFs for the low-HDI, medium-HDI and high/very high-HDI countries, show that the marginal costs of human development, with respect to carbon consumption and emissions, increase with respect to the HDI level. In other words, for these countries, the same HDI increases do not occur with the same levels of carbon consumption. The amount of carbon usage per unit increase in HDI appears to increase as the level of human development increases within a community. Snapshot SFs for the very high HDI countries range from 7 to 71 metric tons of carbon per capita per unit of human development as measured by the HDI, for both 2000 and 2005 data. Snapshot SFs for medium HDI range of 1.5–7 metric tons of carbon per capita per unit of human development as measured by the HDI (2000 and 2005 data). Low HDI countries show a range of 0.5–2 metric tons of carbon per capita per unit of human development as measured by the HDI for the same years (treating Zimbabwe as an outlier). These data seem to suggest that in the development of carbon reduction standards, to gain broad consensus, it may be necessary to consider the marginal costs of development for typologies of countries with similar development conditions. Setting homogeneous time-sensitive targets for countries with significantly different marginal costs of development would appear to ignore the relative costs to human development and the fact that the marginal costs relative to human development are not equal.
Analysis of the data also suggests that low-HDI countries may have opportunities to leapfrog the historic natural environment burdens of human development, by reducing their marginal carbon costs of development as they proceed up the HDI ladder. In addition, considering that the nature of development in low-HDI countries is somewhat different than that in high-HDI countries, failure to acknowledge the marginal costs of human development, would also be a failure to acknowledge that the nature of development for the two typologies of countries tends to have a different focus. Setting uniform global carbon reduction standards may come with the risk of recommending standards that are unrealistic relative to the marginal costs of human/economic development for various typologies of countries, and therefore result in significantly different impacts on development. Analysis of the data would also suggests that countries whose marginal costs of development tend to differ significantly from the average in their typology of development have either achieved higher cost efficiencies or are lagging behind in the cost efficiencies of human/economic development. All of these observations seem to suggest that carbon management must occur in a contextually appropriate manner relative to sustainable development, rather than in a general manner that assumes that development conditions are uniform or have little or no relationship to carbon management.
The ideas presented in the previous sections support the concept of ‘common but differentiated responsibilities (CDR), which is receiving increasing recognition in international law. The UN Framework Convention on Climate Change (UNFCCC) explicitly includes CDR. Other conventions that do not adopt the term but do differentiate explicitly include the Montreal Protocol on Substances that Deplete the Ozone Layer, the UN Framework Convention on Biological Diversity, the UN Convention on the Law of the Sea and trade law. CDR suggests that certain risks affect every nation on earth, including climate change, ozone depletion and every risk-related global public good. In reducing mutual risks, all nations should cooperate in a spirit of global partnership with ‘differentiated’ responsibilities Citation[16]. Full implementation of CDR at the regional and local levels will require proper accounting and consideration of human, environmental and economic capital interactions to determine appropriate levels of responsibility for different stakeholders: responsibilities that would be considered ‘fair’ from the viewpoint of prior use of natural resources in generating human development, present needs and future opportunities. The SF framework or similar frameworks that allow for credible accounting of different types of capital can be useful in advancing CDR discussions to address factors such as prior development efficiencies, critical constraints to development, marginal costs of human development and marginal costs of carbon reduction, more systemically.
Implications
With respect to framing global carbon reduction initiatives and applying appropriate analytic models for determining standards and assessing progress, the prior analysis has the following implications:
▪ Goal setting
The analysis suggests that carbon reduction cannot be properly pursued as a goal independent of the human development goals of a country, city or other political decision-making entity. By acknowledging that the marginal costs of development are higher or lower, depending on the prevailing levels of development, global decision-making bodies can reduce the risk of putting forward unrealistic global standards for carbon management; communicate that they understand that not all types of carbon reduction initiatives have comparable impact levels on development; and increase the chances for gaining consensus among decision makers from different HDI typologies of countries, regions and municipalities.
▪ Models
The analysis also suggests that with respect to the appropriate application of analytical methods, carbon reduction may be framed more appropriately as a multiple criteria decision making problem, (i.e., either as a multiple attribute decision-making problem or a multiple objective decision-making problem), rather than a single objective problem. If it is framed as a single-objective problem, then the local development conditions must be appropriately incorporated as constraints in the problem. One review of the climate policy failures of 2009 recommends that reframing the climate issue around matters of human dignity is also likely to be more effective than the approach of framing it around human shortcomings Citation[17]. Framings that focus exclusively on the environmental parameters of sustainability without understanding and incorporating the socioeconomic implications may be less realistic or unrealistic contextually and may also ignore and miss the highest human development opportunities.
▪ Carbon reduction & sustainable development
The prior analysis indicates that global carbon management can have significant implications and non-uniform consequences on the development of various typologies of countries at different levels of development. It also implies that the distributive development impacts of uniform carbon reduction standards are most likely to be unequal and that carbon reduction initiatives that reflect an underlying understanding of the development impacts of carbon management have a higher likelihood of achieving carbon reduction while reducing negative impacts and enhancing positive impacts on development. The prior analysis suggests that the opportunity costs of carbon reduction are non-uniform in nature and carbon management cannot be properly approached without considering the development impacts of setting standards (e.g., policy targets). Considering the opportunity costs of carbon reduction in different development contexts will contribute appropriate information for differentiating among different typologies of countries. Furthermore, informed decision makers will intentionally seek to achieve contextually appropriate carbon management, which will prioritize the most critical opportunities for continued and sustained development.
▪ Carbon reduction standards & targets
The finding that, in some cases, the marginal carbon costs of development tend to be closer for countries with similar levels of development indicates that global standards and targets may have to be commensurately non-uniform in order to achieve similar outcomes in different development contexts. The idea of carbon trading based on or related to the marginal costs of development can be explored in more detail as a basis for determining consensus-based shares with respect to associated socioeconomic impacts.
▪ Policies, technologies & infrastructure
Superior policies, technologies and infrastructure for carbon management will be tailored to prioritize the most critical opportunities for development or environmental protection depending on the pressing need. For example, since transportation is a derived good (or a means to an end rather than an end in itself), the critical transportation priorities of a region or country tend to be related to its development priorities. Therefore, while one would expect some overlaps in the transportation priorities of developing and developed countries, one would also expect that there might be some different areas of emphasis, linked with local development priorities and constraints. The five US strategic transportation goals of safety, state of good repair, economic competitiveness, livable communities and environmental sustainability, reflect the critical issues in the nation’s transportation sector Citation[18]. While safety, congestion, air quality and financing are also critical issues in developing countries Citation[19], other more basic human quality of life issues also surface as critical priorities – issues such as eradicating extreme poverty, attaining food sufficiency, reducing childhood mortality and improving maternal health, some of which have been well articulated in the UN’›s millennium development goals. More than 20,000 people, mostly in developing regions, die every day of extreme poverty Citation[20]. Adopting a clinical diagnostic approach to policy making for infrastructure and technological development, transportation investments that will promote development most significantly in developing regions will also prioritize farm-to-market roads to increase food sufficiency, improve access to hospitals in rural areas to reduce childhood mortality and improve maternal health; and prioritize economic development and sufficiency to reduce poverty. These goals must be part of an overall initiative to reduce carbon in transportation to minimize the opportunity costs of such an initiative.
Study limitations & future work
The measures used in the SF construct, the HDI and the EF, are imperfect and yet useful, and have been critiqued elsewhere Citation[8,9,12,13]. Their strengths and limitations can be discussed at length and indeed various publications have done so. This article focuses on offering a construct that can be used to address carbon management within the context of broader sustainable development goals, and offers some examples that indicate the value of doing so. The scope is intentionally defined to exclude discussions about the problems associated with measures, the difficulties with determining boundaries, and other related topics. Future applications to characterize how carbon management should be approached in various contexts, such as applying the Sustainability Footprint in detailed case studies, will be appropriate for discussing such issues in more detail and their impacts on the analysis results. In addition, this discussion is focused at a network or systems level, rather than project level. Future project-level studies that examine individual national circumstances can also offer valuable pointers on context-specific priorities and constraints in carbon management.
Conclusion
This article presents a framework for thinking about carbon reduction in the context of the human development conditions and priorities of different countries and regions. The SF framework can be used to relate environmental, economic and social parameters of development in a way that helps analysts and decision makers to understand the similarities and differences in different development contexts and how these ought to influence the management of any particular resource (environmental, social or economic). Using carbon footprint and HDI data, the article demonstrates that the marginal human development costs of carbon reduction initiatives are not uniform for typologies of countries at different levels of development. This, coupled with the fact that the nature of the most important development initiatives also tend to be different in these different development contexts implies that carbon management, to be properly effective, must be considered in conjunction with the most critical development priorities of a country or region. This implies that the most appropriate global standards or targets for carbon management may not necessarily be uniform when viewed from the perspective of the marginal human development costs, and that similar ranges in the value of per capita carbon footprints may offer a starting point for carbon management in different development contexts. The study findings also imply that carbon management, to be properly effective, must be viewed as a multiple attribute decision-making problem to account for the systems effects of the triple bottom line factors of sustainability: the environment, society and economy.
Table 1. Carbon footprint and human development index data.
▪ Carbon management is a critical global priority this century. | |||||
▪ Developing global standards and targets for carbon reduction is not always an easy task because different stakeholder countries have different costs associated with various carbon management initiatives. | |||||
▪ Lower-HDI countries tend to have basic human development needs. The countries in this typology examined in this paper also tend to have lower marginal per capita carbon costs of human development. | |||||
▪ The higher-HDI countries examined in this paper showed relatively higher marginal per capita carbon footprints per unit of human development. | |||||
▪ These disparities in the opportunity costs in human development of carbon reduction initiatives ought to be considered in the development of contextually appropriate initiatives that allow various countries or other political decision making entities to achieve their most urgent development needs while making progress with carbon reduction. Carbon reduction strategies that do not simultaneously prioritize basic human development initiatives or other local priorities can have unnecessarily high opportunity costs that are not ideal for the communities they affect. | |||||
▪ Carbon management, to be properly effective, must be considered as a multiattribute or multi-objective decision-making problem to account for the systems effects of reducing carbon on the larger human and economic environments. | |||||
Acknowledgements
This paper was presented at a US–China Workshop on Pathways to Low Carbon Cities held in Hong Kong (December 2010), which was sponsored by the US national Science Foundation grant CMMI-1045411. In addition to the peer-review process carried out on the article by reviewers for Carbon Management, we would like to acknowledge that Figures 2, 3 and 4 were peer-reviewed by the Transportation Research Board and presented at the Transportation Research Board annual meeting.
Financial & competing interests disclosure
The author has no relevant affiliations or financial involvement with any organization or entity with a financial interest in or financial conflict with the subject matter or materials discussed in the manuscript. This includes employment, consultancies, honoraria, stock ownership or options, expert testimony, grants or patents received or pending, or royalties.
No writing assistance was utilized in the production of this manuscript.
Bibliography
- World Commission on the Environment and Development, UN. Our Common Future. Oxford University Press, UK, 1987.
- Harman D. Amidst protests, summit ends. Christian Science Monitor, 5 September 2002.
- Lovins HL. The Copenhagen cop out. Sustainability3(1),1–2 (2010).
- Amekudzi A, Khisty CJ, Khayesi M. Using the sustainability footprint model to assess development impacts of transportation systems. Transportation Research Part A: Policy and Practice43(3),339–348 (2009).
- Amekudzi A, Fisher, JM, Khayesi M et al. Risk-theoretical foundations for setting sustainable development priorities: a global perspective. Proceedings of the 2011 Annual Meeting of the Transportation Research Board. Washington, DC, 23–27 January 2011.
- Cohen JE. Human population grows up. Scientific American.293(3),48–55 (2005).
- American Society of Civil Engineers, By laws of the American Society of Civil Engineers, Article 1. April 2011.
- Wiedmann T, Barrett, J. A review of the ecological footprint indicator – perceptions and methods. Sustainability2,1645–1693 (2010).
- Peters GP, Minx JC, Weber CL et al. Growth in emissions transfers via international trade. PNAS USA108(21),8903–8908 (2011).
- UN. Human Development Report, 2009.
- UN. Human Development Report, 2010.
- Gasper D. Is Sen’s capability approach an adequate basis for considering human development?. Review of Political Economy14(4),435–462 (2002).
- Sagar AD, Najam A. The human development index: a critical review. Ecol. Econ.24(3),249–264 (1998).
- Wackernagel M, Rees W. The Ecological Footprint. Reducing Human Impact on the Earth, New Society Publishers, 1996.
- Ewing B, Goldfinger S, Oursler A et al. Ecological Footprint Atlas 2009. Global Footprint Network, Research and Standards Department. Oakland, CA, 2009.
- Stone CD. Common but differentiated resposibilities in international Law. 98 Am. J. Int. Law98(2),276–301 (2004).
- Institute for Science, Innovation and Society, University of Oxford. The Hartwell Paper: A new direction for climate change policy after the crash of 2009, May 2010.
- United States Department of Transportation (USDOT). USDOT Draft Strategic Plan FY-2010–2015. Transportation for a New Generation, April 15, 2010.
- Jeon CM, Amekudzi AA, Vanegas J. transportation system sustainability issues in high-, middle- and low-income countries: case studies from Georgia (US), South Korea, Columbia and Ghana. J. Urban Plan. Develop. American Society of Civil Engineers, 132(3),172–186 (2006).
- Sachs JD. The end of poverty. Economic Possibilities for Our Time. Penguin Books, NY, USA, 2005.
▪ Websites
- CNN, G8 Finale: Africa in the Spotlight. www.cnn.com/2007/WORLD/europe/08/g8.climatechange/index.html?eref=rss_to
- Vidal J. Does the Cancun Agreement show Climate Leadership? Environment, Guardian (2010). www.guardian.co.uk/environment/2010/dec/13/climate-leadership-cancun> (Accessed February 2011).
- Vidal J. Rich and poor countries blame each other for failure of Copenhagen deal. Environment, Guardian (2009). www.guardian.co.uk/environment/2009/dec/19/copenhagen-blame-game?intcmp=239 (Accessed July 2010).
- Global Footprint Network. www.footprintnetwork.org (Accessed March 2010).
- US Department of Energy, Carbon Dioxide Information Analysis Center, Carbon Footprint data. www.gapminder.org/data/ (Accessed April 2011).
- United Nations Development Program, Human Development Index Statistics. http://hdr.undp.org/en/statistics/data/ (Accessed April 2011).