
Abstract
The nucleotide-binding domain, leucine-rich repeat containing family caspase recruitment domain containing 4 (NLRC4) inflammasome can be activated by pathogenic bacteria via products translocated through the microbial type III secretion apparatus (T3SS). Recent work has shown that activation of the NLRP3 inflammasome is downregulated by autophagy, but the influence of autophagy on NLRC4 activation is unclear. We set out to determine how autophagy might influence this process, using the bacterium Pseudomonas aeruginosa, which activates the NLRC4 inflammasome via its T3SS. Infection resulted in T3SS-dependent mitochondrial damage with increased production of reactive oxygen intermediates and release of mitochondrial DNA. Inhibiting mitochondrial reactive oxygen release or degrading intracellular mitochondrial DNA abrogated NLRC4 inflammasome activation. Moreover, macrophages lacking mitochondria failed to activate NLRC4 following infection. Removal of damaged mitochondria by autophagy significantly attenuated NLRC4 inflammasome activation. Mitochondrial DNA bound specifically to NLRC4 immunoprecipitates and transfection of mitochondrial DNA directly activated the NLRC4 inflammasome; oxidation of the DNA enhanced this effect. Manipulation of autophagy altered the degree of inflammasome activation and inflammation in an in vivo model of P. aeruginosa infection. Our results reveal a novel mechanism contributing to NLRC4 activation by P. aeruginosa via mitochondrial damage and release of mitochondrial DNA triggered by the bacterial T3SS that is downregulated by autophagy.
Abbreviations:
- Three-MA, 3-methyladenine
- AIM2, absent in melanoma 2
- ATG, autophagy related
- ATPIF1, ATPase inhibitory factor 1
- BID, BH3 interacting domain death agonist
- BMDM, bone marrow-derived macrophages
- BrdU, 5-bromo-2-deoxyuridine
- CASP, caspase
- GFP, green fluorescent protein
- IL1B, interleukin 1, β
- LC3B, microtubule-associated protein 1 light chain 3 β
- LDH, lactate dehydrogenase
- LPS, lipopolysaccharide
- Mito-TEMPO, (2-(2, 2, 6, 6-tetramethylpiperidin-1-oxyl-4-ylamino)-2-oxoethyl)triphenylphosphonium chloride
- MT-CO1, mitochondrially encoded cytochrome c oxidase I
- mtDNA, mitochondrial DNA
- NAC, N-acetylcysteine
- NAIP, NLR family apoptosis inhibitor
- NGS, normal goat serum
- NLR, nucleotide-binding domain, leucine-rich repeat containing
- NLRC4, NLR family, CARD domain containing 4
- NLRP3, NLR family, pyrin domain containing 3
- PBS, phosphate-buffered saline
- PINK1, PTEN induced putative kinase 1
- Rn18s, 18S rRNA
- T3SS, type III secretion system
- TNF, tumor necrosis factor
- TUBB5, tubulin, β 5 class I
- Vav, vav 1 oncogene
Introduction
One of the main mediators of the innate immune response is the cytokine IL1B (interleukin 1 β). IL1B production is tightly regulated by a multisubunit protein complex termed the inflammasome.Citation1 At its core is CASP1 (caspase 1), which on activation will not only produce mature IL1B from pro-IL1B but also release of active IL18/interleukin 18, a cytokine important in Th1 cell development.Citation2 Understanding the mechanisms regulating inflammasome activation is thus of crucial importance in comprehending its role in innate immune response to infection as well as numerous inflammatory conditions.
The inflammasome based on the NLR protein NLRC4 is activated by a number of bacterial pathogens via their type III secretion system.Citation1 The activation is dependent on bacterial products, notably flagellinCitation3,4 and PrgJ,Citation5,6 one of the rod proteins found in the T3SS. These proteins in murine cells interact with the adaptors NAIP5 (NLR family, apoptosis inhibitorory protein 5) and NAIP2, respectively, leading to NLRC4 inflammasome activation.Citation6,7 T3SS needle proteins have also been described as activators of the NLRC4 inflammasome,Citation8 via NAIP1 and human NAIP. A separate inflammasome based on the NLR protein NLRP3 is activated by a very different set of stimuli, including ATP, pore-forming bacterial toxins, and a variety of particulate matter including silica, asbestos, and alum adjuvants.Citation9 Recent research has attempted to identify a common mechanism of NLRP3 activation underlying such a disparate group of stimuli. A number of studies have highlighted the role of mitochondrial production of reactive oxygen intermediates and release of mitochondrial DNA as essential in the activation of NLRP3.Citation10-12 Autophagy thus downregulates this activation through the removal of damaged mitochondria—mitophagy.Citation13 Release of DNA into the cytosol would be expected to activate the DNA binding protein AIM2 (absent in melanoma 2), which in turn assembles an active inflammasome. However, lipopolysaccharide (LPS) + ATP activation of the NLRP3 inflammasome is independent of AIM2,Citation14 despite mitochondrial damage and release of mitochondrial DNA into the cytoplasm. Thus, additional mechanisms must be operational upon LPS + ATP stimulation to direct an NLRP3-dependent yet AIM2 independent response to cytosolic DNA. One possible mechanism could be through intracellular compartmentalization of NLRP3, which localizes to mitochondria through binding to the adaptor mitochondrial antiviral signaling protein.Citation15 This might explain why release of mitochondrial DNA can activate NLRP3 but not AIM2. This is controversial, however, as a recent paper suggests that the only mechanism underlying NLRP3 activation is a decrease in intracellular K+ ions.Citation10
A previous study of inflammasome activation by the pathogen Vibrio parahaemolyticus suggested that a bacterial effector, VopQ, inhibited NLRC4 inflammasome activation by inducing autophagic degradation, but the mechanism was not determined.Citation16 We have recently found in an in vivo model of Pseudomonas aeruginosa infection in mice that autophagy downregulates inflammasome activation by this microbe.Citation17 We set out therefore to examine in more detail the influence of autophagy on the activation of the NLRC4 inflammasome by the T3SS of P. aeruginosa, which produces a rapid activation of the NLRC4 inflammasome by a mechanism that is entirely dependent on its T3SS.Citation3,4,18,19 Infection with this bacterium also initiates autophagy.Citation17,20 We found that inhibition of autophagy upregulated inflammasome activation following P. aeruginosa infection. This was due to autophagy removing damaged mitochondria that released mitochondrial DNA following infection in a process dependent on production of reactive oxygen intermediates. Released mitochondrial DNA contributed to activation of the NLRC4 inflammasome. Manipulation of the autophagy pathway in vivo following P. aeruginosa infection directly altered levels of IL1B produced. These results demonstrate a novel pathway contributing to activation of the NLRC4 inflammasome through T3SS-induced mitochondrial damage and release of mitochondrial DNA.
Results
Autophagy inhibits inflammasome activation following P. aeruginosa infection
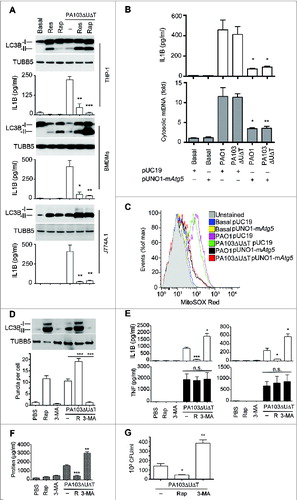
P. aeruginosa infection activates the NLRC4 inflammasome via its T3SS. We have previously demonstrated that P. aeruginosa induces autophagy in bone marrow-derived macrophages (BMDMs) in a toll-like receptor 4 dependent fashion.Citation17 We set out to examine the effect of an absence of autophagy on the activation of the NLRC4 inflammasome by P. aeruginosa using BMDMs from mice with a targeted deletion of the essential gene Atg7 (autophagy-related 7) in marrow precursors (vav 1 oncogene (Vav1)-atg7−/−) mice.Citation21 We assayed for the induction of autophagy by measuring production of the lipidated form of microtubule-associated protein 1 light chain 3B (LC3B-II), and the appearance of LC3B punctaCitation22 (Fig. S1A to C). As we have previously demonstrated,Citation17 following infection of macrophages from the Vav1-atg7−/− mice there was a virtually complete inhibition of autophagy compared to infected cells from wild-type mice (Fig. S1A to C). We then compared inflammasome activation following infection in macrophages from wild-type and Vav1-atg7−/− mice. In the absence of autophagy, we found that inflammasome activation was markedly increased, as shown by enhanced conversion of CASP1 to the active p10 form, greater production of secreted IL1B, but no significant change in secreted TNF (tumor necrosis factor) (). Knockdown of the essential autophagy gene Atg5Citation23 using siRNA significantly attenuated autophagy following infection (Fig. S1D). ATG5 knockdown led to increased production of IL1B but not TNF and enhanced inflammasome activation (). In all these experiments, cell death as assayed by lactate dehydrogenase (LDH) release was less than 10% with the times and conditions of infection stated (data not shown).
Figure 1. Autophagy downregulates activation of the inflammasome by P. aeruginosa. (A) BMDMs from wild-type mice (Vav1-atg7+/+) or mice with a conditional deletion of Atg7 in bone marrow-derived cells (Vav1-atg7−/−) were infected with PA103ΔUΔT and autophagy quantified. Panels show immunoblots for indicated proteins in cells infected as shown. Graphs show secretion of active IL1B and TNF from basal and infected BMDMs as shown. Columns are means of 3 independent determinations; error bars are SEM. * indicates a significant difference between the levels in BMDMs from WT or Vav1-atg7−/− mice, P < 0.05. n.s., not significant. (B) As (A), but in cells depleted of Atg5 by siRNA knockdown as shown. (C) As (A) but in cells depleted of Lc3b by siRNA knockdown as shown and infected as indicated. ** indicates a significant difference between the levels in BMDMs from Lc3b siRNA-treated cells and control, P < 0.01. ((D)to F) Immunoblots of key proteins (including the ATG12&z.vrecto;ATG5 conjugate) of (A) to (C) depleted by knockout or knockdown as shown, with TUBB5/β-tubulin as control. C is control. D, BMDMs from WT or Vav1-atg7 knockout animals as shown probed for ATG7. (E) and (F), BMDMs treated with siRNA or control siRNA to Atg5 (E) and Lc3b (F).
In a similar fashion, knockdown of Lc3b with siRNA in BMDMs also increased production of activated CASP1 and IL1B following infection but not TNF (). We confirmed that macrophages from Vav1-atg7−/− mice lacked ATG7 () and that there was high efficiency of knockdown of LC3B and ATG5 by immunoblot (). Pharmacological inhibition of autophagy with 3-methyladenine (3-MA) also increased inflammasome activation following infection of BMDMs with the PA103ΔUΔT and wild-type PAO1 strains of P. aeruginosa (Fig. S1E and F). We extended these observations to other murine and human cells. 3-MA inhibited autophagy in the human cell line THP-1, murine dendritic cells, and the murine macrophage line J774A.1 and also reduced the induction of LC3B puncta (data not shown). In all these different cells this increased the levels of secreted IL1B (Fig. S2). These data show that in the absence of autophagy, there is an increase in the activation of the NLRC4 inflammasome following P. aeruginosa infection.
Mitochondrial reactive oxygen activates the inflammasome following P. aeruginosa infection
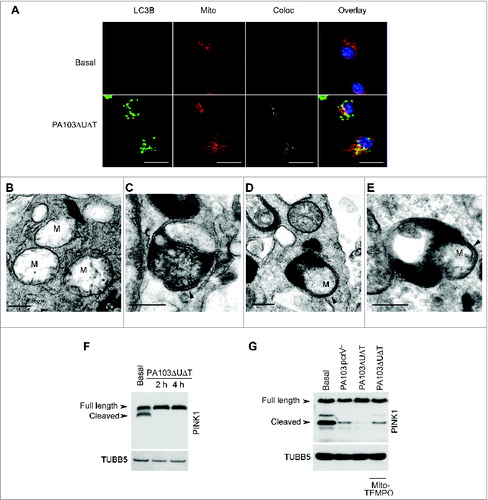
We hypothesized that the increase in inflammasome activation in P. aeruginosa-infected cells after inhibition of autophagy was due to an increase in release of reactive oxygen intermediates from defective mitochondria that failed to be removed by mitophagy. To confirm that mitochondria were being removed by mitophagy following infection, we performed localization studies using immunofluorescent microscopy (). Following infection of BMDMs with PA103ΔUΔT, we found extensive colocalization of mitochondria with the LC3B protein that localizes on autophagic vacuoles. We analyzed cells at much higher resolution using transmission electron microscopy to look for mitochondria within the characteristic double-membrane autophagosomes. In uninfected, mitochondria were easily visualized but we did not detect any within autophagosomes (). Following infection with PA103ΔUΔT, mitochondria were readily visible within autophagosomes with a characteristic double-membrane structure (). In this panel, the cristae of the mitochondria are visible. In other images, we were able to identify double-membrane structures within autophagosomes that are consistent with mitochondria (), although cristae were not readily visible, consistent with the mitochondrial damage described following mitophagy.Citation24 Electron microscopy images are difficult to quantify, thus to assay the level of mitophagy accurately we used a biochemical method. The delivery of damaged mitochondria to autophagic vacuoles is controlled by the mitochondrial protein PINK1 (PTEN induced putative kinase 1).Citation25 This normally undergoes proteolytic processing by healthy mitochondria, but following damage and depolarization, this processing is abrogated and full-length PINK1 accumulates on the surface of mitochondria. Full-length PINK1 then recruits parkin to the mitochondrial surface and initiates mitophagy. Western blotting of BMDM lysates following infection with PA103ΔUΔT showed an accumulation of full length compared to cleaved PINK1 (). This was almost completely reversed by (2-(2,2,6,6-tetramethylpiperidin-1-oxyl-4-ylamino)-2-oxoethyl)triphenylphosphonium chloride (Mito-TEMPO), a specific inhibitor of mitochondrial reactive oxygen productionCitation26 (). PA103 lacking a functional T3SS that does not activate the inflammasome, PA103pcrV−, showed levels of cleaved PINK1 that were increased compared to cells infected with the T3SS intact PA103ΔUΔT strain (). These data show that mitochondria are damaged by the T3SS system in P. aeruginosa infection leading to inhibition of PINK1 cleavage that then initiates mitophagy.
Figure 2. Infected BMDMs undergo mitophagy. (A) Representative confocal images of BMDMs infected with PA103ΔUΔT (MOI 25 for 4 h) and stained for LC3B (green), and mitochondrial ATPIF1 (Mito, red); nuclei are stained blue with DAPI. Coloc shows areas of colocalization of the mitochondrial and LC3B staining in gray. Overlay shows the merged LC3B and mitochondrial signals; colocalizing areas shown as yellow. Scale bar = 5 μm. Repeated 3 times. ((B)to E) Electron micrographs of autophagosomes of untreated BMDM (B) or infected with PA103ΔUΔT(MOI 25) for 4 h (C) to (E). Arrowhead indicates autophagosome with enclosing double membrane, M indicate mitochondria. Scale bar is 500 nm. Representative image from > 10 infected cells. (F) Immunoblot of BMDMs infected at a MOI of 25 with PA103ΔUΔT for the indicated times probed for PINK1. Full-length and cleaved PINK1 are labeled. The blot was reprobed for TUBB5 as a loading control. (G) As (F) but with infections and treatments as shown and is representative of 2 independent experiments.
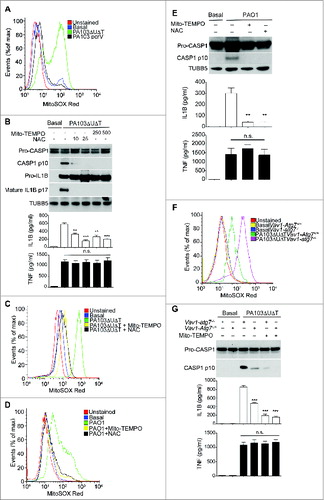
Next, we examined the production of reactive oxygen by mitochondria following infection with P. aeruginosa and the effect of this on inflammasome activation. Following infection with PA103ΔUΔT there was a marked increase in mitochondrial reactive oxygen production (). However, following infection with the PA103pcrV− mutant that does not have a functional T3SS and does not produce inflammasome activation,Citation19 mitochondrial reactive oxygen was not increased (). To test the dependence of inflammasome activation following P. aeruginosa infection on production of mitochondrial reactive oxygen production, we used the general reactive oxygen inhibitor N-acetylcysteine (NAC) as well as Mito-TEMPO. Following infection, these inhibitors produced a dose-dependent reduction in CASP1 activation and production of active IL1B (), but with no effect on secreted TNF. Both inhibitors produced the expected reduction in mitochondrial production of reactive oxygen (). PA103 lacks functional flagella, thus it activates NLRC4 via NAIP2 rather than NAIP5/6.Citation6,27 To determine if reactive oxygen production was important in infections with flagellated P. aeruginosa that can activate NLRC4 via NAIP5/6, we utilized the wild-type strain PAO1. Infection with PAO1 produced an increased output of mitochondrial reactive oxygen that was inhibited by Mito-TEMPO and NAC (). Infection of BMDMs with this strain activated the inflammasome with production of the p10 CASP1 fragment and secreted IL1B. Both NAC and Mito-TEMPO inhibited this activation (). Thus, P. aeruginosa signaling via either NAIP2 or NAIP5/6 produces mitochondrial reactive oxygen intermediates that are important in NLRC4 inflammasome activation.
Figure 3. Production of mitochondrial reactive oxygen following P. aeruginosa infection leads to inflammasome activation. (A) Flow cytometry of untreated BMDMs (basal) or infected as indicated and stained with MitoSOX Red. (B) Immunoblot as in of BMDMs pretreated for 1 h with Mito-TEMPO (250, or 500 μM) or NAC (10 or 25 mM) then infected with PA103ΔUΔT (MOI 25) for 4 h. The lower panels show ELISA of IL1B and TNF secretion as in . ** and *** indicate significant differences between the levels in the presence and absence of the Mito-TEMPO and NAC, P < 0.01 and < 0.001 respectively. (C) Flow cytometry of uninfected BMDM (basal) or pretreated for 1 h with Mito-TEMPO (500 μM) or NAC (25 mM) then infected with PA103ΔUΔT (MOI 25) for 4 h and stained with MitoSOX Red. (D) as in (C), but in cells infected with PAO1. (E) As (B) but in cells infected with PA01 as shown. (F) Flow cytometry of cells from Vav1-atg7−/− or Vav1-atg7+/+ mice left uninfected (basal) or infected with PA103ΔUΔT (MOI 25) for 4 h and stained with MitoSOX Red. (G) Immunoblot and ELISA as in (B) from Vav1-atg7+/+ and Vav1-atg7−/− BMDMs treated as shown. *** indicates significant differences from the levels produced from infected Vav1-atg7−/− cells, P < 0.001. n.s. not significant. All data are representative of 3 independent experiments.
Next, we tested the effect of inhibiting autophagy on the production of mitochondrial reactive oxygen intermediates following infection of BMDMs with P. aeruginosa PA103ΔUΔT. In BMDMs from mice lacking the essential autophagy gene Atg7 in bone-marrow cells (Vav1-atg7−/−) there was an increase in the amount of mitochondrial reactive oxygen produced following infection compared to control wild-type animals (). Production of mitochondrial reactive oxygen intermediates following infection was further increased when autophagy was inhibited with 3-MA (Fig. S3A). We also attenuated autophagy by knockdown of the essential autophagy proteins LC3B and ATG5 using siRNA. Using both these approaches, we observed a marked increase in the production of mitochondrial reactive oxygen intermediates following infection (Fig. S3B and S3C). Taken together, these data show that autophagy reduced the levels of mitochondrial reactive oxygen produced following infection of BMDMs with P. aeruginosa.
We then determined whether increased inflammasome activation following inhibition of autophagy in infected cells was due to increased mitochondrial reactive oxygen production. To provide definitive evidence for the role of autophagy in downregulating inflammasome activation following infection, we used BMDMs from Vav1-atg7−/− mice. In infected cells from Vav1-atg7−/− mice, Mito-TEMPO reduced IL1B but not TNF production and inhibited the production of activated CASP1 (). Mito-TEMPO also inhibited the increase in IL1B production and generation of activated CASP1 that was seen when autophagy was prevented by knockdown of Atg5 with siRNA (Fig. S3D).
We hypothesized that the mitochondrial damage following P. aeruginosa infection might also result in release of mitochondrial DNA. First, we assayed for cytoplasmic mitochondrial DNA release following infection of BMDMs. The copy number of cytoplasmic nuclear DNA encoding 18S rRNA (Rn18s) was not altered by infection (data not shown). Following infection with PA103ΔUΔT there was a marked increase in the relative amount of mitochondrial to nuclear cytoplasmic DNA (). This was further increased by inhibiting autophagy with 3-MA or by knockdown of Lc3b with siRNA (). Inhibiting mitochondrial reactive oxygen production with Mito-TEMPO significantly inhibited mitochondrial DNA release ().
Figure 4. (See previous page.) Mitochondrial DNA release following infection and requirement for mitochondria for inflammasome activation by P. aeruginosa. (A) and (B), qPCR analysis of cytosolic mitochondrial DNA (mtDNA) relative to nuclear DNA in macrophages pretreated (A) with Mito-TEMPO (500 μM) or 3-MA (10 mM) or control or Lc3b siRNA (B) and infected with PA103ΔUΔT (MOI 25) for 4 h or uninfected (Basal) as shown. Columns show means of 3 independent determinations; error bars are SEM. (C) Mitochondrial content of J774A.1 cells exposed to ethidium bromide (EtBr) at the indicated concentration (ng/ml) measured by qPCR (normalized to untreated cells; upper panel) and immunoblot for the mitochondrial protein ATPIF1 (lower panel) at low and high exposure time; TUBB5 is shown as a loading control. (D) Mitochondrial content of control or ethidium bromide-treated J774A.1 cells (ρJ774A.1) assayed by flow cytometry of MitoTracker Green stained cells. (E) Flow cytometry of J774A.1 and ρ°J774A.1 cells left uninfected (Basal) or infected with PA103ΔUΔT (MOI 25) for 4 h and stained with MitoSOX Red. (F) J774A.1 cells grown in the absence or presence of 500 ng/ml ethidium bromide (EtBr) were left untreated (basal) or infected with PA103ΔUΔT (MOI 25) for 4 h and analyzed as described in . *** indicates significant differences between the levels in the presence and absence of the EtBr (500 ng/ml), P < 0.001. All data are representative of results from 2 or 3 independent experiments.
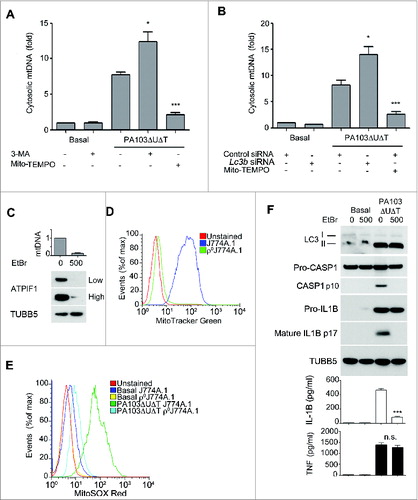
Further, to establish the importance of mitochondria in the activation of the NLRC4 inflammasome by P. aeruginosa, we grew J774A.1 murine macrophages in ethidium bromide to generate cells that lack mitochondria (ρ°J774A.1).Citation28 We confirmed that these cells had lost mitochondria by measuring cellular mitochondrial DNA content by quantitative PCR, western blotting cell lysates for the mitochondrial protein ATPase inhibitory factor 1 (ATPIF1), and flow cytometry of cells stained with the mitochondrial specific dye MitoTracker Green (). Infection of the ρ°J774A.1 cells with PA103ΔUΔT gave no increase in mitochondrial reactive oxygen production (). Moreover, when infected with PA103ΔUΔT the ρ°J774A.1 cells lacking mitochondria failed to activate CASP1 and produced significantly less IL1B but similar amounts of TNF (). Autophagy, as assayed by the formation of LC3B-II () and appearance of LC3B puncta (data not shown), was maintained in ρ°J774A.1 cells compared to J774A.1, showing that loss of mitochondria had not inhibited this energy-requiring process. Thus, these data also support the conclusion that mitochondria play an important role in the activation of the NLRC4 inflammasome by P. aeruginosa.
Mitochondrial DNA contributes to activation of the NLRC4 inflammasome
Next, we explored the role, if any, of cytoplasmic mitochondrial DNA in activating the NLRC4 inflammasome following P. aeruginosa infection. We transfected BMDMs with DNASE1, or with a control protein LDH or heat-inactivated DNASE1. LDH or heat-inactivated DNASE1 did not affect the production of activated CASP1 or production of IL1B following infection (). However, active DNASE1 prevented CASP1 activation and significantly reduced the production of mature IL1B following infection without affecting production of TNF (). DNASE1 treatment reduced the presence of cytosolic mitochondrial DNA as expected (). Transfection of active DNASE1 also reduced the inflammasome activation produced by infection of BMDMs with wild-type PAO1 P. aeruginosa, without affecting TNF (Fig. S4).
Figure 5. (See previous page.) Mitochondrial DNA activates the NLRC4 inflammasome independently of Aim2. (A) BMDMs were transfected with 3 μg DNASE1, lactate dehydrogenase (LDH), or heat-inactivated (HI) DNASE1 as shown and then infected with PA103ΔUΔT (MOI 25) for 4 h. The panels show immunoblot of the indicated proteins and TUBB5 as a loading control as in , levels of IL1B and TNF as in and qPCR analysis of cytosolic mtDNA as in . *** indicates significant difference from HI DNASE1, P <0 .001. (B) ELISA of IL1B and TNF secretion from BMDMs of Aim2+/+ and aim2−/− mice transfected for 6 h with mtDNA, oxidized mtDNA, or DNA predigested by DNASE1 as shown and then infected with PA103ΔUΔT (MOI 25) for 4 h as shown. Columns are means of triplicate independent determinations; error bars are SEM. *,** and *** indicate significant differences at a level of P < 0.05, 0.01 or 0.001 respectively for the indicated comparison or from the result with oxidized DNA + infection. (C) As (A) but in LPS primed Nlrc4+/+ and nlrc4−/− BMDMs transfected with mtDNA, or oxidized mtDNA as shown. Levels of significant differences are as in (B).
The DNA sensor AIM2 might be responsible for these observed effects, as it contributes to the activation of the inflammasome by a number of pathogens. Although NLRP3 has been suggested to bind and be activated by DNA, this protein does not contribute to activation of the inflammasome following P. aeruginosa infection.Citation18,19 This is considered further in the discussion. To examine the contribution of AIM2 to activation of the inflammasome by P. aeruginosa, we measured secreted IL1B following infection in BMDMs from WT and Aim2 knockout mice.Citation14 We found that the levels of secreted IL1B were significantly reduced from the infected Aim2 knockout BMDMs compared to those derived from WT animals (). Thus, AIM2 contributes to inflammasome activation in P. aeruginosa infection. We also examined the effect of transfected mitochondrial DNA on IL1B production in infected BMDMs from mice with a knockout of the Aim2 gene (aim2‑/−). Even in the absence of AIM2, transfected mitochondrial DNA boosted IL1B production in infected cells; oxidized DNA was more effective and TNF levels were unchanged (). Thus, although AIM2 contributes to activation of the inflammasome following infection with P. aeruginosa, this suggests that an additional DNA sensor or sensors also is present in these cells that can contribute to inflammasome activation.
We speculated that NLRC4 might itself be activated by released mitochondrial DNA. Therefore, we repeated these experiments using BMDMs from mice with a knockout of the Nlrc4 gene (nlrc4−/−). LPS primed cells were then transfected with mitochondrial DNA and inflammasome activation determined. Compared to wild-type BMDMs (Nlrc4+/+), transfection of mitochondrial DNA into Nlrc4 knockout cells produced significantly reduced amounts of IL1B and activated CASP1 (). There was still some residual response to mitochondrial DNA in the nlrc4−/− cells as would be expected from remaining AIM2 and NLRP3, but it was substantially and significantly reduced. Thus, NLRC4 can, independently of NLRP3 and AIM2, mediate activation of the inflammasome in response to transfected mitochondrial DNA.
NLRC4 interacts with and is activated by mitochondrial DNA
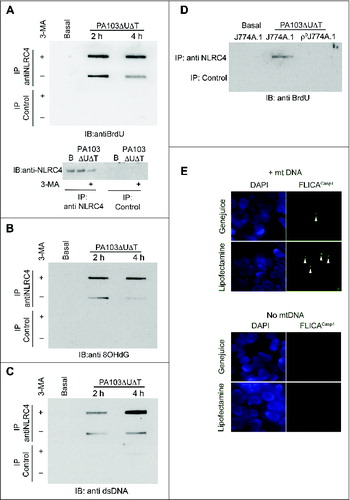
We hypothesized that the activation of the NLRC4 inflammasome by mitochondrial DNA was mediated by binding to the NLRC4 protein. To test this, we grew cells in 5-bromo-2-deoxyuridine (BrdU) and prepared cell lysates before and after infection. NLRC4 was immunoprecipitated from the lysates and bound DNA in the immunoprecipitates detected by probing slot blots of the eluates with antibody to BrdU (). We added 3-MA to some of the cells prior to lysis to block autophagy and thus enhance the release of mitochondrial DNA. In lysates prepared from uninfected cells, no DNA was detected in the NLRC4 immunoprecipitates, even in the presence of 3-MA (). Following infection, NLRC4, but not control, immunoprecipitates contained DNA; the amount was further increased in the presence of 3-MA (). We repeated this experiment, but probed the slot blot with an antibody to 8-OH deoxyguanosine, a modified deoxynuceloside found commonly in oxidized DNA.Citation29 NLRC4, but not control, immunoprecipitates contained material reacting with this antibody (). The findings were further corroborated by probing the immunoprecipitates with a generic DNA antibody, which gave the same result (). Thus, following infection with P. aeruginosa, NLRC4 has a direct or indirect interaction with DNA, including DNA that has undergone oxidation. To demonstrate that this DNA is mitochondrial in origin, we performed NLRC4 immunoprecipitation from both infected J774A.1 and ρ°J774A.1 that lack mitochondria. In lysates from infected cells lacking mitochondria, immunoprecipitates of NLRC4 did not contain DNA ().
Figure 6. Mitochondrial DNA is present in NLRC4 immunoprecipitates and activates a reconstituted NLRC4 inflammasome. (A) BMDMs were grown in BrdU and infected as shown before lysates were immunoprecipitated with anti-NLRC4 or control rabbit serum as indicated. Bound material was slot-blotted to nitrocellulose and then blotted with anti-BrdU. The lower panel shows separate immunoblot of eluted material from NLRC4 immunoprecipitates blotted for NLRC4. (B) As in (A), but reprobed with antibody to 8OHdG. (C) As (A), but blot probed with generic anti-DNA antibody. (D) Immunoblot of immunoprecipitates as set out in (A) but in either control J774A.1 cells or in ρJ774A.1 cells lacking mitochondria. (E) HEK cells transfected with NLRC4 and NAIP were transfected with and without mitochondrial DNA and active CASP1 localized by immunofluorescent imaging using FLICACasp1. Panels show representative images of cells stained with FLICACasp1 (green) and nuclei stained with DAPI (blue) using the indicated transfection reagents. Arrows show spots of active CASP1 formation. Experiments were all repeated 2 or 3 times.
Next, we set out to determine if the interaction between NLRC4 and mitochondrial DNA was important in initiating inflammasome activation. To determine if mitochondrial DNA could directly activate NLRC4, we tested the effect of mitochondrial DNA on CASP1 activation in a reconstituted cell-based assay. Using a variety of transfection reagents, we detected ‘spots’ of activated CASP1 in cells following transfection of mitochondrial DNA, but not in control cells transfected without DNA (). Thus, mitochondrial DNA alone is sufficient in this assay to result in NLRC4 inflammasome activation.
Manipulation of autophagy alters inflammasome activation in vivo following P. aeruginosa infection
We have previously found that autophagy appears to reduce NLRC4 activation following P. aeruginosa infection in vivo.Citation17 We hypothesized that by drug manipulation of autophagy we could alter inflammasome activation in vivo. First, we tested the effect of adding the known inducers of autophagy, rapamycin and resveratrol, to P. aeruginosa infected BMDMs as well as the macrophage lines J774A.1 and THP-1. We found that these agents augmented the degree of autophagy observed during infection (Fig. S5A to E and ). In all cell lines studied, the addition of rapamycin significantly reduced the amount of IL1B produced during infection (). Neither rapamycin nor 3-MA had any significant effect on the growth of P. aeruginosa in culture broth (data not shown). We also increased autophagy by transfecting BMDMs with an expression plasmid for murine Atg5. (Fig. S5C to F). This treatment attenuated production of IL1B and release of cytosolic mitochondrial DNA following infection (), as well as inhibiting production of mitochondrial reactive oxygen (). We also confirmed that infection with P. aeruginosa truly increased flux through the autophagy pathway by following the fate of transfected tandem green fluorescent protein (GFP)-mCherry-LC3B.Citation30 The GFP from this fusion protein loses its fluorescence in the acidic environment induced in autophagosomes when they fuse with lysosomes while the signal from the acid-resistant mCherry remains intact. As shown in Fig. S6A, at 2 h following infection or treatment with autophagy inducers, virtually all puncta are positive for both the GFP and mCherry signal. At 4 h after infection, there is a dramatic reduction in the number of green puncta, while the red puncta are still clearly visible. At 6 h after infection, virtually no green puncta are visible, while red puncta are beginning to coalesce into larger vesicles. Quantification of the numbers of green puncta at various times after treatment or infection showed that these changes were statistically significant, confirming that infection or treatment with rapamycin or resveratrol increased flux through the autophagy pathway.
Figure 7. Manipulating in vitro and in vivo levels of autophagy modulates inflammasome activation following P. aeruginosa infection. (A) The panels show representative protein gel blots of LC3B isoforms and TUBB5 as a loading control following infection and rapamycin (50 μg/ml) (Rap) or resveratrol (50 μg/ml) (Res) treatment as indicated. Graphs are means (with SEM as error bars) of IL1B secretion in the same experiments. *** indicates significant difference between the levels in the presence and absence of rapamycin or resveratrol during infection, P < 0.001. (B) Levels of IL1B (upper panel) and cytosolic mitochondrial DNA (lower panel) in cells transfected with expression plasmid for murine Atg5 (pUNO1-mAtg5) or control plasmid (pUC19) infected as shown. (C) Flow cytometry of BMDMs transfected with plasmids as indicted and infected as shown and stained for mitochondrial reactive oxygen with mitososx. (D to G), results from intraperitoneal infection of female C57BL/6 mice with PA103ΔUΔT treated with rapamycin (R), or 3-methyl adenine as indicated. (D) Levels of LC3B-I and -II in recovered peritoneal cells following infections and treatments as shown; lower panel shows mean (± SEM) numbers of LC3B containing puncta per cell as described in Fig. S1B. (E) Levels (n = 3) of IL1B and TNF (error bars are SEM) in the blood (left panels) and peritoneal washings (right panels) before and 6 h after infection with the indicated treatments. * and ** and *** indicate significant differences from the levels in infected animals with no pretreatment, P < 0.05, 0.01 and 0.001 respectively. (F) Protein concentration in peritoneal fluid following infection and treatments shown. (G) Bacterial colony counts per ml of recovered fluid from the peritoneal cavity with the treatments as shown. Columns are means of triplicate determinations, error bars SEM. (D to G) Representative data from 2 independent in vivo experiments. Other experiments were repeated 2 or 3 times.
Next, we tested the effect of altering autophagy in an in vivo model of P. aeruginosa infection in mice. Animals were infected with the microbe intraperitoneally and the effects of augmenting autophagy with rapamycin and inhibiting autophagy with 3-MA studied. These treatments boosted and inhibited respectively the degree of autophagy in cells recovered from the peritoneal cavity, as assayed by levels of LC3B-II and LC3B puncta per cell (). We found that rapamycin treatment significantly reduced the amount of IL1B recovered from the peritoneal cavity and blood after infection, but had no effect on levels of TNF (). Inhibiting autophagy with 3-MA significantly enhanced IL1B levels, with no effect on TNF (). As an indicator of disruption to the peritoneal barrier, we measured protein concentration in peritoneal fluid recovered after infection. Rapamycin significantly reduced the protein concentration while 3-MA enhanced it (). We also measured the numbers of viable bacteria recovered from the peritoneal cavity following infection (). This showed that rapamycin reduced the numbers of bacteria while 3-MA increased these numbers. Thus, increasing the degree of autophagy with rapamycin reduces the amount of inflammasome activation and resulting inflammatory response following infection in vivo. Inhibiting autophagy with 3-MA has the opposite effect. However, increasing the degree of autophagy with rapamycin results in lower numbers of bacteria remaining after infection; again inhibition of autophagy with 3-MA had the opposite effect.
Discussion
The results here present the novel finding that autophagy regulates NLRC4 activation following P. aeruginosa infection by selective removal of damaged mitochondria—mitophagy. Moreover, we have shown that mitochondrial reactive oxygen species and release of mitochondrial DNA subsequent to infection with P. aeruginosa are important in NLRC4 activation. This establishes a novel pathway of NLRC4 activation dependent on mitochondrial sensing of infection that is regulated by the autophagy pathway. We show using an in vivo peritoneal infection model with P. aeruginosa that manipulation of the autophagic pathway with rapamycin and 3-MA can alter the degree of activation of the inflammasome and subsequent inflammation. This reinforces the physiological relevance of the mechanisms we have described in this work. Additionally, it suggests that manipulation of autophagy could be exploited therapeutically to modify the IL1B response following infection. Clearly, IL1B plays an important role in host defense, but excess production of inflammatory mediators is deleterious as found in sepsis and septic shock. Downregulating inflammasome activation by promoting autophagy in sepsis might therefore be a useful therapeutic strategy. Autophagy also has a role in clearance of P. aeruginosa; in our model of infection, augmenting or inhibiting autophagy decreased or increased respectively the numbers of bacteria recovered from the peritoneal cavity ().
The mechanism by which P. aeruginosa produces mitochondrial damage is unclear, but it is dependent on the bacterial T3SS. FlagellinCitation31 and components of the T3SS rod and needle complex have been reported to activate the NLRC4 inflammasome, utilizing proteins of the NAIP family as adaptors.Citation5,6,27 How and at what level does mitochondrial damage interact with these NAIP-dependent effects? One approach would be to measure mitochondrial reactive oxygen output and release of mitochondrial DNA in BMDMs from mice with selective knockout of NAIP family members. However, we have recently found that there is a reciprocal effect of inflammasome activation on the process of autophagy, such that CASP1 activation leads to proteolytic processing of the signaling intermediate TRIF and hence downregulates autophagy.Citation17 Thus, preventing NLRC4 activation by removing the NAIP adaptors will prevent CASP1 activation and lead to enhanced autophagy. This will lead to a reduction in mitochondrial reactive oxygen production and release of mitochondrial DNA, but would not imply that the NAIP protein interactions with bacterial products were directly responsible for this effect. We suggest that this is the mechanism that accounts for the apparent dependence of mitochondrial damage on NLRP3, as reported by Nakahira et al.Citation12
Initiation of inflammasome activation and pyroptosis has many similarities to apoptosis, in which mitochondria play a key role. For example, the Fas apoptotic pathway can result in cleavage of the protein B cell leukemia/lymphoma 2 homology domain 3 interacting domain death agonist (BID) to a form that moves from the cytoplasm to mitochondria where it initiates damage and release of CYCS/cytochrome c, amplifying the apoptotic signal.Citation32 We speculate that these bacterial interactions with NAIP proteins are upstream of a subsequent initiation of mitochondrial damage and release of mitochondrial DNA. Translocation of the NAIP proteins to mitochondria after activation by flagellin or T3SS rod proteins would be a possible mechanism to account for T3SS dependent mitochondrial damage, in much the same way as the mitochondrial localization of BID leads to apoptosis.
Several groups have shown the importance of mitochondrial damage and sensing of released mitochondrial DNA in NLRP3 inflammasome activation;Citation11,12 removal of damaged mitochondria by selective autophagy (mitophagy) inhibits this activation. Thus, the question remains as to how specific NLRP3 or NLRC4 inflammasome activation can be achieved through an identical signal. Moreover, despite the presence of cytoplasmic mitochondrial DNA following LPS + ATP stimulation that is able to bind and activate the NLRP3 inflammasome, this apparently does not result in activation of the DNA-sensing AIM2 inflammasome, which plays no part in this process.Citation14 Likewise, NLRP3 plays no part in the activation of the inflammasome by P. aeruginosa,Citation18 yet we show here that infection by this microbe results in accumulation of cytoplasmic mitochondrial DNA that in LPS + ATP treatment of cells has been shown to activate the NLRP3 inflammasome. We propose that additional proteins must be involved in triggering either a NLRC4 or NLRP3 response. These might be NAIP family members that in the context of binding to flagellin or T3SS rod/needle proteins direct a NLRC4 response over NLRP3 activation. As the original description of the inflammasome makes clear, an activating signal is required to bring together an inflammasome complex.Citation33 Thus, the presence of particular activated binding partners, such as NAIPs, may lead to assembly of the NLRC4 inflammasome, while different protein interactions may produce a NLRP3 inflammasome. For example, the guanylate binding protein 5 is important for assembly of the NLRP3 inflammasome for some, but not all, triggering stimuli.Citation34 Indeed, different inflammasomes may assemble at different times during a triggering event such as an infection. A role for mitochondrial damage and sensing of mitochondrial DNA may therefore be a common factor that is required for the final activation of the assembled inflammasome. Certainly NLRC4 can respond directly to the presence of cytoplasmic DNA as the data in demonstrate. The contribution of this to the overall activation of the inflammasome in P. aeruginosa infection is not clear. Transfected DNASE1 reduced inflammasome activation following infection almost completely (). This suggests that cytoplasmic DNA is required as a factor in inflammasome activation in P. aeruginosa infection. Activation of AIM2 by DNA will also contribute to any effect of NLRC4 activation by DNA.
P. aeruginosa that lack a functional T3SS can activate the NLRP3 inflammasome by a mechanism that requires a TRIF-dependent activation of CASP11.Citation35,36 This is a slower process than activation via the T3SS as it requires transcriptional activation of CASP11, which typically takes some hours. All the work described here was with P. aeruginosa that has an active T3SS which produces rapid inflammasome activation that is independent of CASP11 and NLRP3 and is abolished in the absence of NLRC4.Citation19,35 Thus, the involvement of mitochondria in the activation of the inflammasome that we describe here is quite independent of CASP11 and NLRP3 involvement.
We show here that immunoprecipitated NLRC4 contains bound mitochondrial DNA (). Similar results have been found for NLRP3. We do not know whether DNA is binding directly to the NLR proteins or if it binds to an associated protein. Direct binding to these different NLRs might suggest a role for the common central NOD domain of these proteins as DNA binding elements; equally, other interacting proteins may be involved. Further experiments to define the exact element that interacts with DNA are required. In conclusion, the work described here establishes a novel pathway by which infection activates the NLRC4 inflammasome, by inducing mitochondrial damage and release of mitochondrial DNA. This pathway is similar to that described for the activation of the NLRP3 inflammasome by LPS and ATP. Further work will be required to establish how each pathway operates independently. This study serves to underscore the importance of mitochondria in initiating an inflammatory response through activation of the inflammasome, and how control of mitochondrial quality through autophagy is central in limiting this response.
Ethics Statement
All animal experiments were performed under project License PPL60/4361 granted and approved by the UK Government Home Office, according to the Animals (Scientific Procedures) Act 1986 Amendment Regulations with regard to Directive 2010/63/EU of the European Parliament and of the Council on the protection of animals used for scientific purposes. The granting of such a project license was approved locally by the University of Glasgow Biological Services Ethical Review Committee followed by approval of the application for animal work by the UK Home Office who granted and approved the project license allowing the work to proceed. This is the legal requirement for all animal work within the UK and ensures all animal work is performed according to the principles of the Weatherall Report with due consideration of replacing, refining and reducing animal experimentation wherever possible.
Materials and Methods
Reagents
The following regents were used: Mito-TEMPO (Enzo Lifescience, ALX-430–150-M005), N-acetylcysteine (Sigma, A7250), ethidium bromide (Sigma, 1510), LDH (Sigma, L2500), rapamycin (Enzo lifesciences, BML-A2750025), DNASE1/DNAse-I (Sigma, D5025), resveratrol (Invivogen, tlr1-resv).
Animals
C57/BL6 mice were obtained from Harlan UK. The following genetically modified mouse strains were used, all on the C57/BL6 background: aim2−/−, nlrc4−/− both kindly provided by K. Fitzgerald (University of Massachusetts) and Vav1-atg7−/− Citation37 which is a conditional deletion of Atg7 in hematopoetic cells generated in the laboratory of AKS.
Cells
Primary bone-marrow macrophages were isolated as described from C57/BL6 mice.Citation38 Cells were cultured in RPMI 1640 (Sigma, R8758) supplemented with 10% heat inactivated fetal calf serum (Invitrogen, 15561020), streptomycin 100 IU/ml, penicillin 100 IU/ml (Sigma, P0781), L-glutamine 2 mM (Invitrogen, 25030) and 25 mM HEPES, pH 7.3. Macrophages were selected by addition of colony stimulating factor 1 (macrophage) (PeproTech, 315–02) 10 ng/ml or by using the supernatant fraction of L929 cells at a final concentration of 30%. Cells were allowed to grow for between 6 to 9 d before use. Under these conditions, the resultant cell population was > 95% macrophages as judged by staining with the macrophage marker EMR1 (EGF-like module containing, mucin-like, hormone receptor-like sequence 1; F4/80). Dendritic cells were produced in a similar fashion but using growth in CSF2 (colony stimulating factor 2 [granulocyte-macrophage]; PeproTech, 315–03).
J774A.1 was from the European Collection of Cell Cultures. The human macrophage cell line THP-1 (gift of Dr. Damo Xu, University of Glasgow) was grown in RPMI 1640 medium supplemented as above.
Bacteria
P. aeruginosa PA103ΔUΔT and PA103pcrV− were kindly provided by Dara Frank, Medical College of Wisconsin. Bacterial strains were cultured in LB broth to mid-log phase (OD 0.4 to 0.6) immediately prior to use. Cells were washed twice in sterile phosphate-buffered saline (PBS; Sigma, D6682) and used to infect cells at the indicated MOI.
Immunoblot analysis
The following antibodies were used: monoclonal anti-TUBB5 (Sigma, T8328); anti-CASP1/caspase 1 p10 (Santa Cruz Biotechnology, sc-514), anti-8-OHdG (Santa Cruz Biotechnology, sc-66036); anti-IL1B (Abcam, ab13810); anti-LC3B (Novus Biological, NB100–2220), anti-NLRC4 (Novus Biological, NBP1–78979ss), anti-PINK1 (Novus Biological, BC100–494); anti-BrdU (Sigma, Bu33); anti-dsDNA (abcam, 27156); anti-rabbit IgG IP beads (eBioscience, 00–880025), anti-ATG7 (Cell Signaling Technology, 2631s); anti-ATG5 (Novus Biological, NB110–53818ss). Bound antibody was visualized using anti-rabbit (Cell Signaling Technology, 7074s) or anti-mouse (Cell Signaling Technology, 7076) horseradish peroxidase-coupled immunoglobulin and chemiluminescence ECL kit (GE healthcare, RPN2209).
Confocal and immunofluorescence microscopy
For immunofluorescence, cells were fixed in 2% paraformaldehyde in PBS and then permeabilized with Triton X-100. Slides were blocked with 10% normal goat serum (NGS; Sigma, G9023) and then incubated overnight at 4°C with 1.25 μg/ml rabbit polyclonal anti-LC3B (Abgent, AP1802a) in 10% NGS in PBS or with 1 μg/ml mouse monoclonal antibody to ATPIF1 (ATPase inhibitory factor 1; Abcam, ab110277) in 10% NGS in PBS. Bound antibody was visualized with Alexa Fluor 488-conjugated goat anti-rabbit IgG (Invitrogen, A11034) or with Alexa Fluor 568-conjugated goat anti-mouse IgG (Invitrogen, A11031). Cells were mounted in Vectashield with DAPI (Vector, H-1500), and viewed using a Zeiss Axiovert S100 microscope using OpenLab software (PerkinElmer, Cambridge, UK) or a LSM 510 Meta Confocal microscope (Carl Zeiss, Cambridge, UK) using LSM Meta 510 software (Carl Zeiss, Cambridge, UK).
Cytokines
Cytokines in cell culture supernatants were measured by ELISA using the following kits: Murine IL1B, (R&D systems, DY401); murine TNF (eBioscience, 88–7324–22) and human IL1B (eBioscience, 88–7010–22).
SiRNA and transfection
Control siRNA and siRNAs to the indicated genes were all OnTarget plus SMART pool siRNA (Dharmacon, Thermo Scientific, Loughborough, UK). pUNO1-mAtg5 was from Invivogen (puno1-matg5). The tandem expression plasmid for LC3B (pDest-mCherry-EGFP-LC3B) was kindly provided by Terje Johansen (University of Tromsø, Norway).Citation30 Silencing constructs were introduced into cells using HiPerfect transfection reagent (Qiagen, 301705). Transfection of BMDMs was optimized using SiGLO Green transfection indicator (Dharmacon, D-001630–01–05) and flow cytometry. We routinely achieved transfection efficiencies greater than 90%. For efficient knockdown, cells were cultured for 24 to 48 h.
Cytoplasmic mitochondrial DNA
For measuring cytoplasmic mtDNA, 1 × 10⁷ cells infected as indicated were homogenized with a Dounce homogenizer in 100 mM NaOH solution, pH 7.4, containing 0.25 M sucrose (Sigma, S0389), 1 mM EDTA, and protease inhibitors (Roche, 04693159001), then centrifuged at 800 g for 12 min at 4°C. The protein concentrations were determined with Micro BCA protein detection kit (Pierce, 23235) and adjusted to equal concentrations across different samples, followed by centrifugation at 12,000 g for 30 min at 4°C for the production of a supernatant corresponding to the cytosolic fraction. Total DNA was isolated from 200 μl of the cytosolic fraction with a DNeasy blood and tissue kit (Qiagen, 69504). Quantitative PCR was used for measurement of cytoplasmic mitochondrial DNA mtDNA using SYBR Green PCR master mix (Applied Biosystems, 4385612). The copy number of cytoplasmic mtDNA was normalized to that of nuclear DNA as the ratio of DNA encoding MT-CO1 (mitochondrially encoded cytochrome c oxidase I) to nuclear DNA encoding Rn18S rRNA.
The following primers were used for q-PCR:
Rn18S sense, 5′-TAGAGGGACAAGTGGCGTTC-3′,
anti-sense, 5′-CGCTGAGCCAGTCAGTGT-3′;
Mt-Co1 sense, 5′-GCCCCAGATATAGCATTCCC-3′,
anti-sense, 5′-GTTCATCCTGTTCCTGCTCC-3′.
The copy number of DNA encoding MT-CO1 was measured by quantitative real-time PCR with same volume of the DNA solution.
Isolation of mitochondrial DNA
Mouse mitochondrial DNA (mtDNA) was isolated from 40 × 106 J774A.1cell with a mitochondrial DNA isolation kit (Thermo scientific, 89874) according to the manufacturer's instructions. Mitochondrial DNA was isolated from the pellet with a DNeasy blood and tissue kit (Qiagen, 69504). To generate oxidized mtDNA, the material was incubated with 100 μM hydrogen peroxide for 30 min at 37°C.
Transfection of mtDNA
BMDMs were transfected for 6 h with 2 μg/ml isolated mtDNA or oxidized mtDNA through the use of 3 μl Attractene (Qiagen, 301005) according to the manufacturer's instructions.
Protein transfection
Protein transfection was performed using Polyplus reagent (Polyplus, pplu50–01) for 5 h. After washing, cells were infected with PA103ΔUΔT for 4 h (MOI 1:25).
Cell culture and transient transfection
HEK293 cells were maintained in Dulbecco's modified Eagle's medium (Gibco, 21969–035) supplemented with 10% fetal calf serum, 2 mM L-glutamine, 100 U/ml penicillin and 100 μg/ml streptomycin. The expression vector pcDNA3 containing DNA insert encoding either NLRC4, NAIP and CASP1 (125 ng/dish of each) were mixed with transfection reagent (JetPEI; Polyplus, 101–01N) according to the manufacturer's instructions. After 48 h cells were transfected with mitochondrial DNA using the designated transfection reagent and subsequently stained for CASP1 using the FAM FLICA CASP1 assay (Immunochemistry Technologies, 98).
Generation of mtDNA deficient ρ° cells
J774A.1 macrophages were grown in RPMI 1640 media supplemented as above but also with added uridine (25 μg/ml). Ethidium bromide (500 ng/ml) was added to the medium for 15 d.Citation28 Depletion of mitochondrial DNA was evaluated by quantitative PCR for the mitochondrial gene mt-Co1, compared to nuclear DNA encoding 18S rRNA, protein gel blot to detect mitochondrial ATPIF1, and flow cytometry for measurement of mitochondrial mass using MitoTracker Green FM stain (Invitrogen, M7514).
Flow cytometry
Mitochondrial ROS were measured in cells after infection as indicated by using 2.5 μM for 30 min at 37°C MitoSOX Red staining (Invitrogen, M36008). For measurement of mitochondrial mass, cells were stained for 30 min at 37°C with 50 nM MitoTracker Green FM (Invitrogen, M7514). Intracellular LC3B-II was detected following the method described.Citation39 Cells were analyzed using a CyAn ADP (Beckman Coulter, CY20030) or FACScalibur flow cytometer (BD, Oxford, UK). Flow cytometry data was analyzed with Flowjo Software (Tree Star Inc. Ashland, OR, USA).
Transmission electron microscopy
BMDM cells infected by PA for 4 h were harvested, washed with Sorensen Phosphate buffer and prefixed with 2% glutaraldehyde, followed by post-fixation with 1% OsO4 in 6.6 mM Sorensen's phosphate buffer (0.133 M Na2HPO4, 0.133 M KH2PO4, pH 7.2). All pellets were dehydrated stepwise in a graded series of ethanol and embedded in araldite CY212. Ultrathin sections were double stained with uranyl acetate and lead citrate (Agar Scientific, AGR1260A and AGR1210) and examined using a Tecnai transmission electron microscope (Model No. 943205018411, FEI Company, Czech Republic) equipped with Olympus Veleta digital camera (Olympus, Munster, Germany).
Immunoprecipitation
BMDMs were preloaded with BrdU (10 mM; Sigma, B5002) for 48 h and then infected with PA103ΔUΔT at MOI 25. After infection cells were washed twice with ice-cold PBS and then lysed in 500 μl RIPA lysis buffer (Thermo Scientific, 89900) for 30 min. Lysates were precleared by addition of 50 μl of anti-rabbit IgG beads (eBioscience, 00–8800–25) on ice for 50 min with gentle agitation. Five μg of rabbit anti-NLRC4 (Novus biological, NBP1–78979ss) antibody or 5 μg of negative control rabbit IgG (Dakocytomation, X0936) were added to 250 μl aliquots of the lysate and incubated on ice for 1.5 h. Immune complexes were collected using anti-rabbit IgG beads and washed 3 times with ice-cold RIPA lysis buffer. Bound material was eluted with distilled water at 100°C for 10 min. A 20 μl aliquot was analyzed on a standard western blot for NLRC4 protein. DNA in the remaining 80 μl aliquot was alkali denatured and neutralized before transferring to nitrocellulose membranes. DNA was detected with monoclonal antibodies to BrdU (1.5 μg/ml; Sigma, B8434) or mouse anti-8OH-dG (0.5 μg/ml; Rockland Immunochemicals, 200–301-A99) or anti-dsDNA (abcam, 27156) and enhanced chemiluminescence ECL.
Animal model
Female C57/BL6 mice aged 8 wk were obtained from Harlan UK. Mice were randomly divided into to 6 groups (n = 3 per group). Three control groups were injected intraperitoneally (ip) with sterile PBS, rapamycin (1.5 g/kg), or 3-MA (Sigma, M9281; 20mg/kg). Experimental groups were injected ip with PA103ΔUΔT (107 cfu) alone or with rapamycin or 3-MA as above. Six h after infection, animals were sacrificed and blood and peritoneal fluid collected for analysis as indicated.
Statistics
Comparison between groups at one time point was made with an unpaired Student t test using Prism 6 (GraphPad Software Inc. San Diego, CA, USA). A P value of < 0.05 was considered significant.
Supplemental_Material.pdf
Download PDF (4.8 MB)Funding
The study was supported by the Ministry of Higher Education and Scientific Research, Iraqi Cultural Attaché, London. M.S.J is a visiting scholar from the University of Technology, Applied Science School, Biotechnology Depart-ment, Baghdad, Iraq. N.D.R. was supported by an MRC Clinical Research Fellowship (Grant G1001998) and H.K.B. by a Wellcome Trust Scottish Translational Medicine and Therapeutics Initiative (WT094779MA).
References
- Franchi L, Munoz-Planillo R, Nunez G. Sensing and reacting to microbes through the inflammasomes. Nat Immunol 2012; 13:325-32; PMID:22430785; http://dx.doi.org/10.1038/ni.2231
- Smith DE. The biological paths of IL-1 family members IL18 and IL-33. J Leukoc Biol 2011; 89:383-92; PMID:20952658; http://dx.doi.org/10.1189/jlb.0810470
- Franchi L, Stoolman J, Kanneganti TD, Verma A, Ramphal R, Nunez G. Critical role for Ipaf in Pseudomonas aeruginosa-induced CASP1 activation. Eur J Immunol 2007; 37:3030-9; PMID:17935074; http://dx.doi.org/10.1002/eji.200737532
- Miao EA, Ernst RK, Dors M, Mao DP, Aderem A. Pseudomonas aeruginosa activates caspase 1 through Ipaf. Proc Natl Acad Sci U S A 2008; 105:2562-7; PMID:18256184; http://dx.doi.org/10.1073/pnas.0712183105
- Miao EA, Mao DP, Yudkovsky N, Bonneau R, Lorang CG, Warren SE, Leaf IA, Aderem A. Innate immune detection of the type III secretion apparatus through the NLRC4 inflammasome. Proc Natl Acad Sci U S A 2010; 107:3076-80; PMID:20133635; http://dx.doi.org/10.1073/pnas.0913087107
- Zhao Y, Yang J, Shi J, Gong YN, Lu Q, Xu H, Liu L, Shao F. The NLRC4 inflammasome receptors for bacterial flagellin and type III secretion apparatus. Nature 2011; 477:596-600; PMID:21918512; http://dx.doi.org/10.1038/nature10510
- Lightfield KL, Persson J, Brubaker SW, Witte CE, von Moltke J, Dunipace EA, Henry T, Sun YH, Cado D, Dietrich WF, et al. Critical function for Naip5 in inflammasome activation by a conserved carboxy-terminal domain of flagellin. Nat Immunol 2008; 9:1171-8; PMID:18724372; http://dx.doi.org/10.1038/ni.1646
- Yang J, Zhao Y, Shi J, Shao F. Human NAIP and mouse NAIP1 recognize bacterial type III secretion needle protein for inflammasome activation. Proc Natl Acad Sci U S A 2013; 110:14408-13; PMID:23940371
- Franchi L, Eigenbrod T, Munoz-Planillo R, Nunez G. The inflammasome: a CASP1-activation platform that regulates immune responses and disease pathogenesis. Nat Immunol 2009; 10:241-7; PMID:19221555; http://dx.doi.org/10.1038/ni.1703
- Munoz-Planillo R, Kuffa P, Martinez-Colon G, Smith BL, Rajendiran TM, Nunez G. K(+) efflux is the common trigger of NLRP3 inflammasome activation by bacterial toxins and particulate matter. Immunity 2013; 38:1142-53; PMID:23809161; http://dx.doi.org/10.1016/j.immuni.2013.05.016
- Shimada K, Crother TR, Karlin J, Dagvadorj J, Chiba N, Chen S, Ramanujan VK, Wolf AJ, Vergnes L, Ojcius DM, et al. Oxidized mitochondrial DNA activates the NLRP3 inflammasome during apoptosis. Immunity 2012; 36:401-14; PMID:22342844; http://dx.doi.org/10.1016/j.immuni.2012.01.009
- Nakahira K, Haspel JA, Rathinam VA, Lee SJ, Dolinay T, Lam HC, Englert JA, Rabinovitch M, Cernadas M, Kim HP, et al. Autophagy proteins regulate innate immune responses by inhibiting the release of mitochondrial DNA mediated by the NALP3 inflammasome. Nat Immunol 2011; 12:222-30; PMID:21151103; http://dx.doi.org/10.1038/ni.1980
- Saitoh T, Fujita N, Jang MH, Uematsu S, Yang B-G, Satoh T, Omori H, Noda T, Yamamoto N, Komatsu M, et al. Loss of the autophagy protein Atg16L1 enhances endotoxin-induced IL-1beta production. Nature 2008; 456:264-8; PMID:18849965; http://dx.doi.org/10.1038/nature07383
- Rathinam VA, Jiang Z, Waggoner SN, Sharma S, Cole LE, Waggoner L, Vanaja SK, Monks BG, Ganesan S, Latz E, et al. The AIM2 inflammasome is essential for host defense against cytosolic bacteria and DNA viruses. Nat Immunol 2010; 11:395-402; PMID:20351692; http://dx.doi.org/10.1038/ni.1864
- Subramanian N, Natarajan K, Clatworthy MR, Wang Z, Germain RN. The adaptor MAVS promotes NLRP3 mitochondrial localization and inflammasome activation. Cell 2013; 153:348-61; PMID:23582325; http://dx.doi.org/10.1016/j.cell.2013.02.054
- Higa N, Toma C, Koizumi Y, Nakasone N, Nohara T, Masumoto J, Kodama T, Iida T, Suzuki T, et al. Vibrio parahaemolyticus effector proteins suppress inflammasome activation by interfering with host autophagy signaling. PLoS Pathog 2013; 9:e1003142; PMID:23357873; http://dx.doi.org/10.1371/journal.ppat.1003142
- Jabir MS, Ritchie ND, Li D, Bayes HK, Tourlomousis P, Puleston D, Lupton A, Hopkins L, Simon AK, Bryant C, et al. Caspase-1 Cleavage of the TLR Adaptor TRIF Inhibits Autophagy and beta-Interferon Production during Pseudomonas aeruginosa Infection. Cell Host Microbe 2014; 15:214-27; PMID:24528867; http://dx.doi.org/10.1016/j.chom.2014.01.010
- Sutterwala FS, Mijares LA, Li L, Ogura Y, Kazmierczak BI, Flavell RA. Immune recognition of Pseudomonas aeruginosa mediated by the IPAFNLRC4 inflammasome. J Exp Med 2007; 204:3235-45; PMID: 18070936; http://dx.doi.org/10.1084/jem.20071239
- Arlehamn CS, Evans TJ. Pseudomonas aeruginosa pilin activates the inflammasome. Cell Microbiol 2011; 13:388-401; PMID: 20955240; http://dx.doi.org/10.1111/j.1462-5822.2010.01541.x
- Yuan K, Huang C, Fox J, Laturnus D, Carlson E, Zhang B, Yin Q, Gao H, Wu M. Autophagy plays an essential role in the clearance of Pseudomonas aeruginosa by alveolar macrophages. J Cell Sci 2012; 125:507-15; PMID:22302984; http://dx.doi.org/10.1242/jcs.094573
- Mortensen M, Ferguson DJ, Edelmann M, Kessler B, Morten KJ, Komatsu M, Simon AK. Loss of autophagy in erythroid cells leads to defective removal of mitochondria and severe anemia in vivo. Proc Natl Acad Sci U S A 2010; 107:832-7; PMID:20080761; http://dx.doi.org/10.1073/pnas.0913170107
- Mizushima N, Yoshimori T, Levine B. Methods in mammalian autophagy research. Cell 2010; 140:313-26; PMID:20144757; http://dx.doi.org/10.1016/j.cell.2010.01.028
- Stromhaug PE, Klionsky DJ. Approaching the molecular mechanism of autophagy. Traffic 2001; 2:524-31; PMID:11489210; http://dx.doi.org/10.1034/j.1600-0854.2001.20802.x
- Gomes LC, Scorrano L. Mitochondrial morphology in mitophagy and macroautophagy. Biochim Biophys Acta 2013; 1833:205-12; PMID:22406072; http://dx.doi.org/10.1016/j.bbamcr.2012.02.012
- Jin SM, Youle RJ. PINK1- and Parkin-mediated mitophagy at a glance. J Cell Sci 2012; 125:795-9; PMID: 22448035; http://dx.doi.org/10.1242/jcs.093849
- Smith RA, Hartley RC, Murphy MP. Mitochondria-targeted small molecule therapeutics and probes. Antioxid Redox Signal 2011; 15:3021-38; PMID: 21395490; http://dx.doi.org/10.1089/ars.2011.3969
- Kofoed EM, Vance RE. Innate immune recognition of bacterial ligands by NAIPs determines inflammasome specificity. Nature 2011; 477:592-5; PMID: 21874021; http://dx.doi.org/10.1038/nature10394
- Hashiguchi K, Zhang-Akiyama QM. Establishment of human cell lines lacking mitochondrial DNA. Methods Mol Biol 2009; 554:383-91; PMID:19513686; http://dx.doi.org/10.1007/978-1-59745-521-3_23
- Maki H, Sekiguchi M. MutT protein specifically hydrolyses a potent mutagenic substrate for DNA synthesis. Nature 1992; 355:273-5; PMID:1309939; http://dx.doi.org/10.1038/355273a0
- Pankiv S, Clausen TH, Lamark T, Brech A, Bruun JA, Outzen H, Øvervatn A, Bjørkøy G, Johansen T. p62SQSTM1 binds directly to Atg8LC3 to facilitate degradation of ubiquitinated protein aggregates by autophagy. J Biol Chem 2007; 282:24131-45; PMID: 17580304; http://dx.doi.org/10.1074/jbc.M702824200
- Miao EA, Alpuche-Aranda CM, Dors M, Clark AE, Bader MW, Miller SI, Aderem A. Cytoplasmic flagellin activates CASP1 and secretion of interleukin 1beta via Ipaf. Nat Immunol 2006; 7:569-75; PMID: 16648853; http://dx.doi.org/10.1038/ni1344
- Billen LP, Shamas-Din A, Andrews DW. Bid: a Bax-like BH3 protein. Oncogene 2008; 27 Suppl 1:S93-104; http://dx.doi.org/10.1038/onc.2009.47
- Martinon F, Burns K, Tschopp J. The inflammasome: a molecular platform triggering activation of inflammatory caspases and processing of proIL-beta. Mol Cell 2002; 10:417-26; PMID:12191486; http://dx.doi.org/10.1016/S1097-2765(02)00599-3
- Shenoy AR, Wellington DA, Kumar P, Kassa H, Booth CJ, Cresswell P, MacMicking JD. GBP5 promotes NLRP3 inflammasome assembly and immunity in mammals. Science 2012; 336:481-5; PMID: 22461501; http://dx.doi.org/10.1126/science.1217141
- Rathinam VA, Vanaja SK, Waggoner L, Sokolovska A, Becker C, Stuart LM, Leong JM, Fitzgerald KA. TRIF licenses CASP11-dependent NLRP3 inflammasome activation by gram-negative bacteria. Cell 2012; 150:606-19; PMID:22819539; http://dx.doi.org/10.1016/j.cell.2012.07.007
- Kayagaki N, Warming S, Lamkanfi M, Vande Walle L, Louie S, Dong J, Newton K, Qu Y, Liu J, Heldens S, et al. Non-canonical inflammasome activation targets CASP11. Nature 2011; 479:117-21; PMID: 22002608; http://dx.doi.org/10.1038/nature10558
- Mortensen M, Soilleux EJ, Djordjevic G, Tripp R, Lutteropp M, Sadighi-Akha E, Stranks AJ, Glanville J, Knight S, Jacobsen SE, et al. The autophagy protein Atg7 is essential for hematopoietic stem cell maintenance. J Exp Med 2011; 208:455-67; PMID: 21339326; http://dx.doi.org/10.1084/jem.20101145
- Celada A, Gray PW, Rinderknecht E, Schreiber RD. Evidence for a gamma-interferon receptor that regulates macrophage tumoricidal activity. J Exp Med 1984; 160:55-74; PMID:6330272; http://dx.doi.org/10.1084/jem.160.1.55
- Eng KE, Panas MD, Karlsson Hedestam GB, McInerney GM. A novel quantitative flow cytometry-based assay for autophagy. Autophagy 2010; 6:634-41; PMID: 20458170; http://dx.doi.org/10.4161/auto.6.5.12112